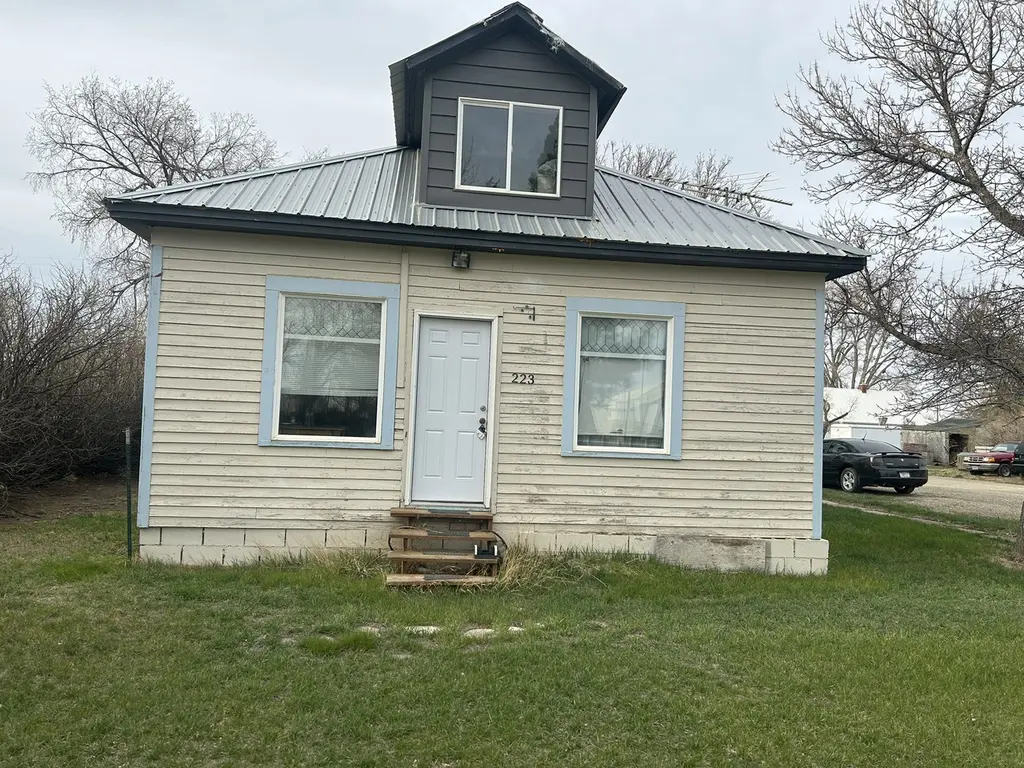
223 1st Ave NE · Brady, MT
Flood risk 1/10 · Minimal
- FEMA flood zone
- —
- Chance of flooding over 30 yrs
- 0.0%
- Est. flood insurance / yr
- —
Fire risk 1/10 · Minimal
- Est. fire insurance / yr
- $918 – $1,706
Heat risk 2/10 · Minimal
- Hot days now (above 91°F)
- 6 days/yr
- Hot days in 30 yrs
- 12 days/yr
Wind risk 1/10 · Minimal
- Chance of severe wind over 30 yrs
- —
Air-quality risk 6/10 · Moderate
- Unhealthy air days now
- 11 days/yr
- Unhealthy air days in 30 yrs
- 11 days/yr
Risk factors via First Street. Map © Google.
Why this score? — see what drove the D grade
The composite is a weighted blend of 9 inputs, each scored 0–100. Each bar is that input's sub-score; the figure is the points it added to the 100-point composite (weight × sub-score).
- Cash flow +9.6/30.0
- Appreciation +9.6/10.0
- ARV discount +7.5/15.0
- Schools +3.7/10.0
- Livability +3.2/5.0
- DSCR +2.7/10.0
- Rent growth +2.5/5.0
- Condition / age +2.5/5.0
- 1% rule +1.6/10.0
$140,000
🖨 Deal sheet 📄 Offer letter ✓ Due diligence
Key facts
- Pear trees
- Apple trees
- Two car garage
Tags
Property features AI
Finance
- HOA & community: Playground nearby; Park nearby
Exterior
- Parking: 2-car garage; Additional parking; Alley access; On-street parking
- Utilities: Public water; Cable available; Electricity available and connected; Propane
- Home design: Single-family residence; One and one-half stories
- Construction: Wood siding and block construction; Block foundation; Metal roof; Built with partial unfinished basement (crawl space)
- Exterior features: Rear porch; Greenhouse; Level topography; Back yard and front yard; Orchard(s); Gravel road access; See remarks
Interior
- Kitchen: Range; Refrigerator
- Bathrooms: 1 full bathroom
- Heating & cooling: Central air conditioning; Forced air heating; Hot water heating
- Interior features: Gas water heater; Range; Refrigerator; Has basement with crawl space, partial and unfinished areas
- Laundry & utility: Washer hookup
Neighborhood map
What this means for you Summary
Snapshot
- This is a 1-bed/1.0-bath single-family listed at $140k.
Deal economics
- At list price, monthly cash flow is $-94 ($-1k/yr) — negative.
- To cash-flow at today's rent, offer at most $123k (11.8% below list).
- To meet the 1% rule (rent ≥ 1% of price), the offer needs to be $93k (33.9% below list).
- Recommended offer: $93k (33.9% below list) — sets the bar for 1% rule.
Location & tenants
- Location reads 64/100 on livability (#149 in MT) — a middle-class / working-renter tenant base. Strengths: employment A+, cost of living A+, crime A; Watch: health & safety C-, amenities F, commute F.
- Dutton/Brady K-12 Schools (rural): math 35% / reading 45% proficiency, ranked #143 of 339 in MT (top 42%) — families likely to look elsewhere, expect single-tenant / working-renter base with shorter leases.
- Market conditions: 5 active listings in the ZIP.
Forward outlook
- In year one you build about $14k of equity ($968 loan paydown + $13k appreciation (9.2% local appreciation)).
- Pondera County population projected to shrink 7% by 2050 — rents likely to lag national; underwrite the cash flow, not the appreciation.
- By year 3, paydown + projected appreciation supports a ~$35k cash-out refi (75% LTV) — recoverable capital for the next deal without selling this one.
Negotiation context
- It's been on market 54 days — a 3% lower offer ($136k) is reasonable based on typical stale-listing flexibility.
Risks & watch-outs
- Watch-outs: built in 1925 — expect roof / HVAC / electrical / plumbing capex.
Questions for the listing agent
- What do current leases actually rent for vs. the listed asking? Can we see a recent rent roll and the last 12 months of T-12 income?
- It's been on market 54 days. Have you received any prior offers? Is the seller open to a 34% concession, seller financing, or rate buy-down credit?
- Built in 1925 — when were the roof, HVAC, electrical panel, plumbing, and water heater last replaced?
- Is there a deadline driving the sale (1031 exchange, divorce, estate, relocation)? That informs how much negotiation room exists.
- The area grade is low — what's the realistic commute time and amenity access for the typical tenant pool here? Any planned neighborhood developments (good or bad) we should know about?
- What's the average days-on-market for RENTAL listings here right now (not sales)? A rising rental-DOM trend means longer vacancies and softer asking-rent achievability than the comps imply.
- What's the recent tenant-quality profile in this submarket — average credit score on applications, eviction rate, late-payment / NSF rate, and stable-employment percentage? A property-management company in the area should have these aggregated.
- How much new for-sale + rental construction is in the pipeline within 1–3 miles? Heavy new supply typically softens prices + rents 12–24 months out; constrained supply supports both.
Investment metrics
- 1% rule
- 0.66% ✗
- Cap rate
- 5.49%
- Cash-on-cash
- -2.87%
- DSCR
- 0.87
- GRM
- 12.6
CMA / ARV
No comps found within radius.
Projected returns pro-forma
9.15% appreciation · 3.0% rent growth · sell at horizon
- IRR
- 20.4%
- Equity multiple
- 2.58×
- Total profit
- $62,117
- Equity at exit
- $117,512
- IRR
- 18.6%
- Equity multiple
- 5.74×
- Total profit
- $185,729
- Equity at exit
- $244,781
Cash invested: $39,200 (down + closing). Projections, not guarantees.
Landlord ↔ Tenant lean methodology
- Overall (STATE)
- 82 Strongly Landlord-Friendly
- State Montana
- 82 Strongly Landlord-Friendly · R+11
- County
- — inherits STATE
- City
- — inherits STATE
ZIP-level market 59416
- Home prices YoY
- 3.4%
- Active inventory
- 5
- Price-to-rent
- 12.6×
Monthly cashflow live
- Estimated rent
- $926 medium interval (Pro) →
- Mortgage (P&I)
- −$734
- Tax from tax record
- −$33 /mo · $391/yr
- Insurance
- −$58
- HOA
- −$0
- Vacancy / Maint / Mgmt
- −$194
- Net cashflow
- $-94
Break-even live
UW: 25.0% down · 7.5% · 30yr · 1.5% tax · 5.0% vac · 8.0% maint · 8.0% mgmt
Financing live
Cash to close
- Down payment
- $35,000
- Closing costs
- $4,200
- Reserves months
- —
- Total cash needed
- —
Loan-product check · same deal, 3 products live
Conventional
25% down · 7.5% · 30yr
- Down + closing
- —
- Monthly P&I
- —
- Monthly cashflow
- —
- DSCR
- —
- Eligible?
- —
Personal DTI + credit; lowest rate.
DSCR
20% down · 8.5% · 30yr
- Down + closing
- —
- Monthly P&I
- —
- Monthly cashflow
- —
- DSCR
- —
- Eligible?
- —
No personal income docs; deal must DSCR.
Hard money
10% down · 12.0% · 12mo
- Down + closing
- —
- Monthly P&I
- —
- Monthly cashflow
- —
- DSCR
- —
- Eligible?
- —
Short-term bridge; refi at stabilization.
Listing history 17 events
-
2026-06-19days on market $140,000 Active 54 DOM
-
2026-06-18days on market $140,000 Active 53 DOM
-
2026-06-17days on market $140,000 Active 52 DOM
-
2026-06-16days on market $140,000 Active 51 DOM
-
2026-06-15days on market $140,000 Active 50 DOM
-
2026-06-14days on market $140,000 Active 48 DOM
-
2026-06-13days on market $140,000 Active 47 DOM
-
2026-06-10days on market $140,000 Active 45 DOM
-
2026-06-09days on market $140,000 Active 44 DOM
-
2026-06-08days on market $140,000 Active 43 DOM
-
2026-06-07days on market $140,000 Active 42 DOM
-
2026-06-03days on market $140,000 Active 38 DOM
-
2026-06-02days on market $140,000 Active 37 DOM
-
2026-06-01days on market $140,000 Active 36 DOM
-
2026-05-31days on market $140,000 Active 35 DOM
-
2026-05-30days on market $140,000 Active 34 DOM
-
2026-04-27$140,000 Active
ⓘ Source: listings_history table (triggers on properties + properties_extension) + one-shot
backfill from property_details.listing_events for pre-trigger history.
Tax reassessment forecast MT · Resets to sale price
- Current annual tax
- $391 · $33/mo
- Projected year-2 tax
- $1,176 · $98/mo
- Expected delta
- +$785/yr (+$65/mo · 201.1%)
ⓘ Screening estimate from a state-policy table — verify with the county assessor before closing.
Climate risk First Street
- Flood 1/10 Low 0% chance over 30 yrs
- Wildfire 1/10 Low
- Heat 2/10 Low 6 d/yr ≥91°F today · 12 d/yr by 30 yrs out
- Wind 1/10 Low
- Air quality 6/10 Major 11 unhealthy d/yr today · 11 by 30 yrs out
Nearby sold comps map
Loading sold comps map…
Walkable amenities ~0.75 mi
Loading nearby amenities…
Taxation est. · year 1
- Rental income
- $11,111
- − Mortgage interest
- −$7,842
- − Property taxes
- −$391
- − Insurance
- −$700
- − Repairs & maintenance
- −$889
- − Management
- −$889
- − Depreciation
- −$4,073
- Taxable loss
- −$3,673
- Est. tax savings @ 24.0%
- +$881
- After-tax cash flow
- $-242/yr
For passive investors: Depreciation is non-cash, so a rental often shows a tax loss while cash-flowing — sheltering income. Rental losses are passive: they offset passive income freely, and up to $25,000/yr can offset ordinary (W-2) income if you actively participate and your MAGI is under $100k (phasing out to $0 by $150k); unused losses carry forward. On sale, claimed depreciation is recaptured at up to 25%, and gains may owe capital-gains tax (a 1031 exchange can defer both). Figures are a year-1 estimate at your 24.0% rate — not tax advice; consult a CPA.
Schools (NCES district)
- District
- Dutton/Brady K-12 Schools
- NCES district ID
- 3000102
- Math proficiency
- 35% ▼ -5.00%
- Reading proficiency
- 45% ▲ 10.00%
- Median HH income
- $45,986
- Composite
- 36.52/100
- National rank
- #9305
- State rank
- #143 of 339 in MT
Livability — Brady
- Score
- 64/100
- State rank
- #149
- US rank
- #14627
Category grades
Schools grade is shown separately in the Schools card above.
Census & demographics
- Census place
- Brady, MT
- Population (ZIP)
- 378
Population outlook (Pondera County) Hauer SSP2
- Today (2025)
- 6,131 people
- By 2030
- 6,066 · -1.1%
- By 2040
- 5,893 · -3.9%
- By 2050
- 5,721 · -6.7%
- By 2075
- 5,544 · -9.6%
- By 2100
- 5,089 · -17.0%
Race, ethnicity, and origin ACS 2023
- Neighborhood character
- Predominantly White (92%)
- Race & ethnicity
- White 92% Two or more races 8% Hispanic / Latino 1%
- Common ancestry
- Portuguese 11% Italian 6% Romanian 4%
- Languages at home
- 99% English-only · Spanish 1%
Political lean MEDSL · Pondera
- 2024 margin
- Solid R (+41.7) · D 27.4% · R 69.1% · Other 3.4%
- 2008→2024 swing
- -29.1pp toward R · 2008: -12.7pp · 2024: -41.7pp
- All cycles
- 2024: R+41.7 2020: R+37.7 2016: R+39.0 2012: R+25.8 2008: R+12.7
Not yet ingested
- Civics
- —
Market trends
- HPI YoY
- ▲ 9.15%
- Current HPI
- 282.0121
- Rent YoY
- —
- Metro
- —
- State GDP YoY
- ▲ 3.41%
- F500 in state
- 2
Industry mix (Fortune 500 HQ in MT)
| Industry | F500 HQs | Revenue |
|---|---|---|
| Technology / Analytics | 1 | $2B |
|
||
Price history
1 event — show timeline
- 2026-04-27 Listed $140,000 MRMLS
Property tax history
-0.6%/yrLatest (2025): $391 · -26.1% YoY. Source: county tax records.
Cash-flow waterfall
monthlySold comps — $/sqft
last 12 mo · ≤1 miLoading sold comps…