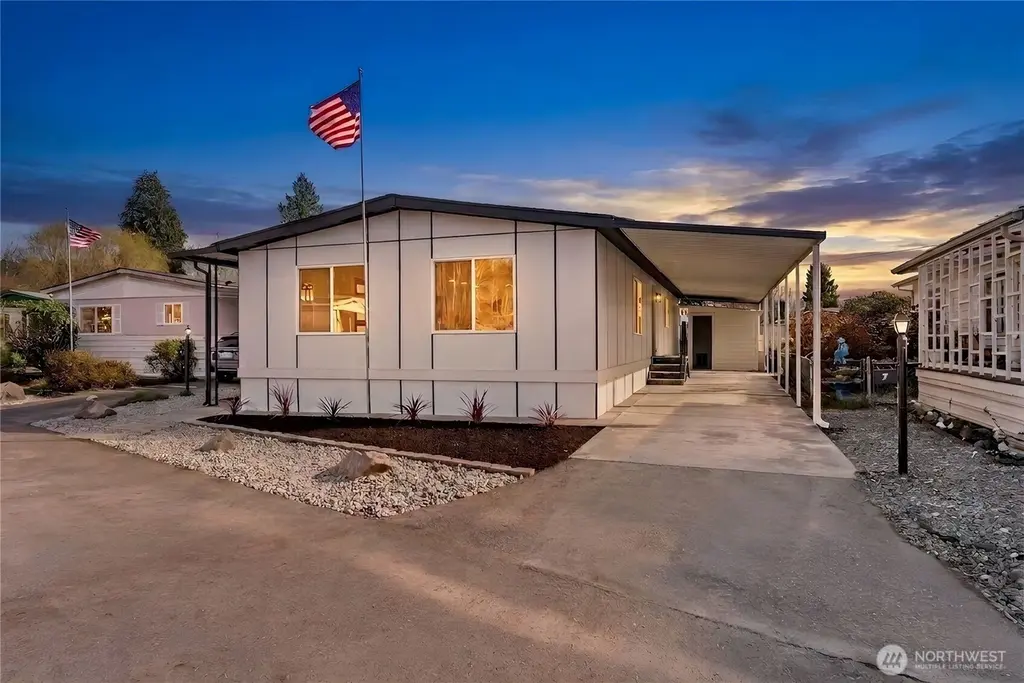
1510 Maple Ln #7 · Kent, WA
Flood risk 5/10 · Moderate
- FEMA flood zone
- X
- Chance of flooding over 30 yrs
- 0.27%
- Est. flood insurance / yr
- $473 – $860
Fire risk 1/10 · Minimal
- Est. fire insurance / yr
- $604 – $1,122
Heat risk 3/10 · Minor
- Hot days now (above 88°F)
- 7 days/yr
- Hot days in 30 yrs
- 15 days/yr
Wind risk 1/10 · Minimal
- Chance of severe wind over 30 yrs
- —
Air-quality risk 8/10 · Major
- Unhealthy air days now
- 12 days/yr
- Unhealthy air days in 30 yrs
- 12 days/yr
Risk factors via First Street. Map © Google.
Why this score? — see what drove the C grade
The composite is a weighted blend of 9 inputs, each scored 0–100. Each bar is that input's sub-score; the figure is the points it added to the 100-point composite (weight × sub-score).
- Cash flow +21.9/30.0
- ARV discount +7.5/15.0
- DSCR +7.0/10.0
- 1% rule +5.7/10.0
- Schools +4.8/10.0
- Livability +4.0/5.0
- Rent growth +3.4/5.0
- Condition / age +2.5/5.0
- Appreciation +0.0/10.0
$249,999
🖨 Deal sheet 📄 Offer letter ✓ Due diligence
Listing remarks
One of the finest homes in the sought-after 55+ Walnut Grove community, this fully remodeled 3-bedroom, 2-bath residence offers exceptional style and comfort throughout. Thoughtfully updated inside and out, featuring a new roof, new windows, new furnace with heat pump, and beautiful LVP flooring. The stunning chef’s kitchen showcases new custom cabinetry, waterfall quartz countertops, full-height quartz backsplash, under-cabinet and island lighting, stainless steel appliances, and a sleek slide-in range. Vaulted ceilings elevate the expansive living room, anchored by a striking electric fireplace and seamless flow into the dining area—perfect for entertaining. Enjoy year-round r
Key facts
- Custom cabinetry
- New furnace
- Heat pump
Tags
Neighborhood map
What this means for you Summary
Snapshot
- This is a 3-bed/2.0-bath manufactured listed at $250k.
Deal economics
- At list price, monthly cash flow is $393 ($5k/yr) — positive.
- The deal already cash-flows at list — no discount required.
- Meets the 1% rule at list price ($3k rent vs $250k).
- Recommended offer: $235k (6.0% below list) — sets the bar for market timing.
- Cap rate 8.2% vs local median 2.7% in Kent — top-decile yield for the area; either an underpriced asset or a hidden risk that comps aren't pricing in. Stress-test before assuming the spread holds.
Location & tenants
- Location reads 79/100 on livability (#109 in WA, #2,154 nationally) — a middle-class / working-renter tenant base. Strengths: amenities A+, commute A+, housing A+; Watch: schools C-, crime F, cost of living F.
- Kent School District (urban): math 47% / reading 57% proficiency, ranked #109 of 291 in WA (top 38%) — acceptable for families but not a draw, mixed tenant base, ~2y average lease.
- Market conditions: Rents rising (+3.7%/yr); 171 active listings in the ZIP; 12 comparable units currently listed for rent nearby; rentals leasing fast (median 13d on market — plan ~1-2 weeks tenant-placement turnaround); solid renter incomes; 10,555 units permitted in King County in 2024 (7,119 in 5+ unit buildings).
- This rent runs 35% of the median local income ($92k/yr) — at the standard rent-burdened threshold; future hikes will face affordability resistance.
Forward outlook
- Local home prices are declining (-3.0%/yr); year-one equity from $2k of loan paydown is wiped out by about $8k of value loss. Plan a longer hold.
- King County population projected at +44% by 2050 — long-run rental-demand tailwind backs the buy-and-hold thesis.
Negotiation context
- It's been on market 86 days — a 6% lower offer ($235k) is reasonable based on typical stale-listing flexibility.
Risks & watch-outs
- Climate carrying-cost: moderate flood risk — expect insurance premiums to compound above CPI over the hold.
Questions for the listing agent
- It's been on market 86 days. Have you received any prior offers? Is the seller open to a 6% concession, seller financing, or rate buy-down credit?
- Built in 1979 — when were the roof, HVAC, electrical panel, plumbing, and water heater last replaced?
- Why hasn't it sold? Are there any deal-killer items the seller is aware of (foundation, flood, title, zoning, code violations)?
- Is there a deadline driving the sale (1031 exchange, divorce, estate, relocation)? That informs how much negotiation room exists.
- Crime grade is F in this area — have there been break-ins, vandalism, or insurance claims at this property in the last 3 years? What carrier currently insures it and at what premium?
- What's the average days-on-market for RENTAL listings here right now (not sales)? A rising rental-DOM trend means longer vacancies and softer asking-rent achievability than the comps imply.
- What's the recent tenant-quality profile in this submarket — average credit score on applications, eviction rate, late-payment / NSF rate, and stable-employment percentage? A property-management company in the area should have these aggregated.
- How much new for-sale + rental construction is in the pipeline within 1–3 miles? Heavy new supply typically softens prices + rents 12–24 months out; constrained supply supports both.
Investment metrics
- 1% rule
- 1.07% ✓
- Cap rate
- 8.18%
- Cash-on-cash
- 6.74%
- DSCR
- 1.30
- GRM
- 7.8
CMA / ARV
- ARV (median comp)
- $134,546
- List price
- $249,999
- Delta
- 85.81%
- Verdict
- OVERPRICED
- Comps
- 2 within 1.0 mi
Show comp detail 1 sale within ~0.75 mi
| Address | Dist | Beds/Ba | Sqft | Sold | Price | $/sf | Match |
|---|---|---|---|---|---|---|---|
| 1540 Maple Ln #35 | 0.07mi | 3/2.0 | 1,400 (-9%) | 7mo | $165,000 | $118 | 76 |
Match score weights: distance 35% · size 25% · config 20% · recency 20%. Top-matched comps best support the ARV.
Projected returns pro-forma
-3.0% appreciation · 3.72% rent growth · sell at horizon
- IRR
- -5.1%
- Equity multiple
- 0.81×
- Total profit
- $-13,481
- Equity at exit
- $37,276
- IRR
- 5.4%
- Equity multiple
- 1.41×
- Total profit
- $28,812
- Equity at exit
- $21,615
Cash invested: $70,000 (down + closing). Projections, not guarantees.
Landlord ↔ Tenant lean methodology
- Overall (STATE)
- 28 Tenant-Leaning
- State Washington
- 28 Tenant-Leaning · D+8
- County
- — inherits STATE
- City
- — inherits STATE
ZIP-level market 98030
- Rents YoY
- 3.7%
- Active inventory
- 171
- Price-to-rent
- 7.8×
Monthly cashflow live
- Estimated rent
- $2,684 high interval (Pro) →
- Mortgage (P&I)
- −$1,311
- Tax est. 1.5%
- −$312 /mo · $3,750/yr
- Insurance
- −$104
- HOA
- −$0
- Vacancy / Maint / Mgmt
- −$564
- Net cashflow
- $393
Break-even live
UW: 25.0% down · 7.5% · 30yr · 1.5% tax · 5.0% vac · 8.0% maint · 8.0% mgmt
Financing live
Cash to close
- Down payment
- $62,500
- Closing costs
- $7,500
- Reserves months
- —
- Total cash needed
- —
Loan-product check · same deal, 3 products live
Conventional
25% down · 7.5% · 30yr
- Down + closing
- —
- Monthly P&I
- —
- Monthly cashflow
- —
- DSCR
- —
- Eligible?
- —
Personal DTI + credit; lowest rate.
DSCR
20% down · 8.5% · 30yr
- Down + closing
- —
- Monthly P&I
- —
- Monthly cashflow
- —
- DSCR
- —
- Eligible?
- —
No personal income docs; deal must DSCR.
Hard money
10% down · 12.0% · 12mo
- Down + closing
- —
- Monthly P&I
- —
- Monthly cashflow
- —
- DSCR
- —
- Eligible?
- —
Short-term bridge; refi at stabilization.
Rent comps 12 comps
| Address | Beds | Baths | Sqft | Rent | $/sqft | DOM | Units | Dist |
|---|---|---|---|---|---|---|---|---|
| 1220 E Laurel St Kent, WA | 3.0 | 2.0 | 1580 | $2,995 | $1.90 | 12d | 1 | 0.71mi |
| 713 3rd Ave S Kent, WA | 3.0 | 2.5 | 1350 | $2,795 | $2.07 | 43d | 1 | 0.78mi |
| 702 5th Ave S Kent, WA | 2.0–3.0 | 1.5 | 1150 | $2,400 | $2.09 | 4d | 3 | 0.84mi |
| 10031 SE 258th Pl Kent, WA | 3.0 | 2.0–2.5 | 1454 | $2,968 | $2.04 | 3d | 3 | 0.94mi |
| 622 6th Ave S Kent, WA | 3.0 | 2.0 | 1114 | $2,999 | $2.69 | 43d | 1 | 0.94mi |
| 401 3rd Ave S Unit Lower Kent, WA | 3.0 | 2.0 | 2000 | $2,780 | $1.39 | 43d | 1 | 0.99mi |
| 1462 51st Pl NE Auburn, WA | 3.0 | 2.5 | 1539 | $2,900 | $1.88 | 2d | 1 | 1.12mi |
| 4750 Auburn Way N Auburn, WA | 1.0–4.0 | 1.0–2.0 | 1011 | $2,417 | $2.39 | 1d | 10 | 1.13mi |
| 802 45th St NE Auburn, WA | 1.0–3.0 | 1.0–2.0 | 895 | $1,999 | $2.23 | 1d | 11 | 1.31mi |
| 10215 SE 248th St Kent, WA | 3.0 | 2.0 | 1250 | $2,895 | $2.32 | 20d | 1 | 1.37mi |
| 10215 SE 248th St Kent, WA | 2.0–3.0 | 2.0 | 1240 | $2,895 | $2.33 | 43d | 3 | 1.37mi |
| 10710 SE 256th St Kent, WA | 2.0 | 2.0 | 1029 | $2,200 | $2.14 | 1d | 5 | 1.41mi |
Listing history 14 events
-
2026-06-18days on market $249,999 Active 86 DOM
-
2026-06-17days on market $249,999 Active 85 DOM
-
2026-06-16days on market $249,999 Active 84 DOM
-
2026-06-15days on market $249,999 Active 83 DOM
-
2026-06-13days on market $249,999 Active 81 DOM
-
2026-06-09days on market $249,999 Active 77 DOM
-
2026-06-08days on market $249,999 Active 76 DOM
-
2026-06-07days on market $249,999 Active 75 DOM
-
2026-06-04days on market $249,999 Active 72 DOM
-
2026-06-03days on market $249,999 Active 71 DOM
-
2026-06-02days on market $249,999 Active 70 DOM
-
2026-06-01days on market $249,999 Active 69 DOM
-
2026-05-31days on market $249,999 Active 68 DOM
-
2026-03-24$249,999 Active
ⓘ Source: listings_history table (triggers on properties + properties_extension) + one-shot
backfill from property_details.listing_events for pre-trigger history.
Climate risk First Street
- Flood 5/10 Major FEMA zone X · 27% chance over 30 yrs
- Wildfire 1/10 Low
- Heat 3/10 Moderate 7 d/yr ≥88°F today · 15 d/yr by 30 yrs out
- Wind 1/10 Low
- Air quality 8/10 Severe 12 unhealthy d/yr today · 12 by 30 yrs out
Nearby sold comps map
Loading sold comps map…
Walkable amenities ~0.75 mi
Loading nearby amenities…
Taxation est. · year 1
- Rental income
- $32,213
- − Mortgage interest
- −$14,004
- − Property taxes
- −$3,750
- − Insurance
- −$1,250
- − Repairs & maintenance
- −$2,577
- − Management
- −$2,577
- − Depreciation
- −$7,273
- Taxable income
- $782
- Est. tax owed @ 24.0%
- −$188
- After-tax cash flow
- $4,528/yr
For passive investors: Depreciation is non-cash, so a rental often shows a tax loss while cash-flowing — sheltering income. Rental losses are passive: they offset passive income freely, and up to $25,000/yr can offset ordinary (W-2) income if you actively participate and your MAGI is under $100k (phasing out to $0 by $150k); unused losses carry forward. On sale, claimed depreciation is recaptured at up to 25%, and gains may owe capital-gains tax (a 1031 exchange can defer both). Figures are a year-1 estimate at your 24.0% rate — not tax advice; consult a CPA.
Schools (NCES district)
- District
- Kent School District
- NCES district ID
- 5303960
- Math proficiency
- 47% ▼ -1.00%
- Reading proficiency
- 57% ▼ -1.00%
- Median HH income
- $69,823
- Composite
- 48.25/100
- National rank
- #4714
- State rank
- #109 of 291 in WA
Livability — Kent
- Score
- 79/100
- State rank
- #109
- US rank
- #2154
Category grades
Schools grade is shown separately in the Schools card above.
Census & demographics
- Census place
- Kent, WA
- County
- King County · 2,251,916 people
- City population
- 119,479
- Metro
- Seattle-Tacoma-Bellevue, WA
- Population (ZIP)
- 38,523
- Household income
- $91,761
- Rent vs Own
- Severe rent burden
- 1415.0
Population outlook (King County) Hauer SSP2
- Today (2025)
- 2,576,485 people
- By 2030
- 2,803,316 · +8.8%
- By 2040
- 3,255,921 · +26.4%
- By 2050
- 3,706,444 · +43.9%
- By 2075
- 4,746,063 · +84.2%
- By 2100
- 5,407,730 · +109.9%
Race, ethnicity, and origin ACS 2023
- Neighborhood character
- Highly diverse neighborhood (Simpson 0.74)
- Race & ethnicity
- White 41% Asian 24% Hispanic / Latino 15% Black 11% Two or more races 9% Pacific Islander 3%
- Hispanic origin (detail)
- Mexican 12%
- Common ancestry
- Subsaharan African 6% Italian 4% Portuguese 2%
- Foreign-born
- 36% · Canada, Vietnam, Philippines
- Languages at home
- 53% English-only · Spanish 10% Other Indo-European 9% Other Asian/Pacific 8%
Political lean MEDSL · King
- 2024 margin
- Solid D (+51.7) · D 74.2% · R 22.5% · Other 3.4%
- 2008→2024 swing
- +9.6pp toward D · 2008: 42.1pp · 2024: 51.7pp
- All cycles
- 2024: D+51.7 2020: D+52.7 2016: D+50.4 2012: D+39.9 2008: D+42.1
Not yet ingested
- Civics
- —
Market trends
- HPI YoY
- ▼ -494.18%
- Current HPI
- 315.2007
- Rent YoY
- ▲ 3.72%
- Metro
- Seattle-Tacoma-Bellevue, WA
- State GDP YoY
- ▲ 4.65%
- F500 in state
- 22
Industry mix (Fortune 500 HQ in WA)
| Industry | F500 HQs | Revenue |
|---|---|---|
| Retail | 2 | $269B |
|
||
| Technology / Retail | 1 | $638B |
|
||
| Technology | 1 | $245B |
|
||
| Telecommunications | 1 | $38B |
|
||
| Food / Beverage | 1 | $36B |
|
||
| Automotive / Trucks | 1 | $34B |
|
||
Price history
1 event — show timeline
- 2026-03-24 Listed $249,999 NWMLS as Distributed by MLS Grid
Cash-flow waterfall
monthlySold comps — $/sqft
last 12 mo · ≤1 miLoading sold comps…