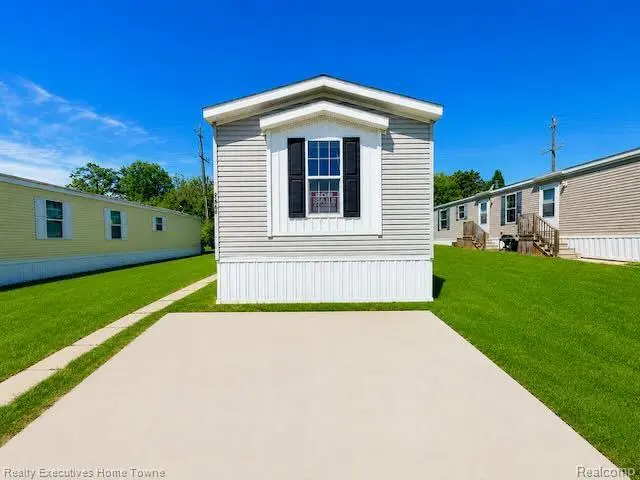
71597 Penny Ct #240 · Bruce, MI
Flood risk No data
- FEMA flood zone
- —
- Chance of flooding over 30 yrs
- —
- Est. flood insurance / yr
- —
Fire risk No data
- Est. fire insurance / yr
- —
Heat risk No data
- Hot days now (above threshold)
- —
- Hot days in 30 yrs
- —
Wind risk No data
- Chance of severe wind over 30 yrs
- —
Air-quality risk No data
- Unhealthy air days now
- —
- Unhealthy air days in 30 yrs
- —
Risk factors via First Street. Map © Google.
Why this score? — see what drove the B grade
The composite is a weighted blend of 9 inputs, each scored 0–100. Each bar is that input's sub-score; the figure is the points it added to the 100-point composite (weight × sub-score).
- Cash flow +30.0/30.0
- 1% rule +10.0/10.0
- DSCR +10.0/10.0
- ARV discount +7.5/15.0
- Schools +4.2/10.0
- Condition / age +4.0/5.0
- Rent growth +2.5/5.0
- Livability +2.5/5.0
- Appreciation +0.0/10.0
$39,900
🖨 Deal sheet 📄 Offer letter ✓ Due diligence
Listing remarks MLS
Move-In Ready 2018 Champion Home in Springbrook Estates! Beautifully maintained manufactured home featuring an open-concept layout, spacious kitchen with abundant cabinetry and appliances, large living area, comfortable bedrooms, and 2 full baths. Enjoy a private driveway, storage shed included in sale, and low-maintenance living in the desirable Springbrook Estates community with access to a pool, clubhouse, playground, walking trails, and more. Conveniently located near shopping, dining, and major commuter routes. Lot rent applies; community approval required.
Key facts
- Large living area
- Private driveway
- Spacious kitchen
Tags
Property features AI
Finance
- HOA & community: Community pool
Exterior
- Parking: Driveway; no garage
- Utilities: Public water; Sewer available
- Home design: Condominium residence; One-level living; Ground-level entry with steps
- Construction: Aluminum siding; Slab foundation; Built as single-story construction
- Exterior features: Paved road access; Pets allowed (cats and dogs)
Interior
- Bathrooms: 2 full bathrooms
- Heating & cooling: Electric forced-air heating; No central air
- Interior features: 7 total rooms; Community pool access
- Laundry & utility: Laundry room with electric and gas dryer hookups
Neighborhood map
What this means for you Summary
Snapshot
- This is a 3-bed/2.0-bath condo listed at $40k. Condition is rated good.
Deal economics
- At list price, monthly cash flow is $776 ($9k/yr) — positive.
- The deal already cash-flows at list — no discount required.
- Meets the 1% rule at list price ($1k rent vs $40k).
- Recommended offer: $39k (1.5% below list) — sets the bar for market timing.
Location & tenants
- Location reads: area grade B — affects rentability + tenant quality, not the cash-flow math above.
- Romeo Community Schools (suburban): math 43% / reading 51% proficiency, ranked #102 of 540 in MI (top 19%) — families likely to look elsewhere, expect single-tenant / working-renter base with shorter leases.
- Market conditions: 87 active listings in the ZIP; 8 comparable units currently listed for rent nearby; rentals lingering (median 44d on market — plan ~5-8 weeks vacancy on turnover, expect pricing pressure); 50% of comp listings sitting > 30 days — soft ceiling on asking rent; 1,321 units permitted in Macomb County in 2024 (86 in 5+ unit buildings).
Forward outlook
- Local home prices are declining (-3.0%/yr); year-one equity from $276 of loan paydown is wiped out by about $1k of value loss. Plan a longer hold.
- Macomb County population projected at +9% by 2050 — modest demand growth; plan on rents tracking national, not racing it.
- At projected returns (-3.0% appreciation + 3.0% rent growth), your $11k cash investment doubles in ~2 years — after that, you're playing with house money.
Negotiation context
- It's been on market 15 days — a 2% lower offer ($39k) is reasonable based on typical stale-listing flexibility.
- 2 sale attempts with the ask held roughly flat each time — persistent listings suggest the price (not the market) is what's stuck; bring a comps-based counter.
Questions for the listing agent
- Any open or pending special assessments — roof, HVAC, plumbing, elevator, façade? What's the per-unit balance and payoff schedule, and is the seller paying it off at close or rolling it to the buyer?
- Is there a deadline driving the sale (1031 exchange, divorce, estate, relocation)? That informs how much negotiation room exists.
- What's the average days-on-market for RENTAL listings here right now (not sales)? A rising rental-DOM trend means longer vacancies and softer asking-rent achievability than the comps imply.
- What's the recent tenant-quality profile in this submarket — average credit score on applications, eviction rate, late-payment / NSF rate, and stable-employment percentage? A property-management company in the area should have these aggregated.
- How much new apartment / multifamily construction is in the pipeline within 1–3 miles? Heavy new supply (>2% of stock underway) typically softens rents 12–24 months out; light construction supports rent growth.
Investment metrics
- 1% rule
- 3.34% ✓
- Cap rate
- 29.62%
- Cash-on-cash
- 83.33%
- DSCR
- 4.71
- GRM
- 2.5
CMA / ARV
No comps found within radius.
Projected returns pro-forma
-3.0% appreciation · 3.0% rent growth · sell at horizon
- IRR
- 83.7%
- Equity multiple
- 4.85×
- Total profit
- $42,963
- Equity at exit
- $5,949
- IRR
- 86.9%
- Equity multiple
- 10.05×
- Total profit
- $101,114
- Equity at exit
- $3,450
Cash invested: $11,172 (down + closing). Projections, not guarantees.
Landlord ↔ Tenant lean methodology
- Overall (STATE)
- 62 Landlord-Friendly
- State Michigan
- 62 Landlord-Friendly · EVEN
- County
- — inherits STATE
- City
- — inherits STATE
ZIP-level market 48065
- Active inventory
- 87
- Price-to-rent
- 2.5×
Monthly cashflow live
- Estimated rent
- $1,331 high interval (Pro) →
- Mortgage (P&I)
- −$209
- Tax est. 1.5%
- −$50 /mo · $598/yr
- Insurance
- −$17
- HOA
- −$0
- Vacancy / Maint / Mgmt
- −$280
- Net cashflow
- $776
Break-even live
UW: 25.0% down · 7.5% · 30yr · 1.5% tax · 5.0% vac · 8.0% maint · 8.0% mgmt
Financing live
Cash to close
- Down payment
- $9,975
- Closing costs
- $1,197
- Reserves months
- —
- Total cash needed
- —
Loan-product check · same deal, 3 products live
Conventional
25% down · 7.5% · 30yr
- Down + closing
- —
- Monthly P&I
- —
- Monthly cashflow
- —
- DSCR
- —
- Eligible?
- —
Personal DTI + credit; lowest rate.
DSCR
20% down · 8.5% · 30yr
- Down + closing
- —
- Monthly P&I
- —
- Monthly cashflow
- —
- DSCR
- —
- Eligible?
- —
No personal income docs; deal must DSCR.
Hard money
10% down · 12.0% · 12mo
- Down + closing
- —
- Monthly P&I
- —
- Monthly cashflow
- —
- DSCR
- —
- Eligible?
- —
Short-term bridge; refi at stabilization.
Rent comps 8 comps
| Address | Beds | Baths | Sqft | Rent | $/sqft | DOM | Units | Dist |
|---|---|---|---|---|---|---|---|---|
| 11975 Creekview Ave Unit 218 Bruce Township, MI | 2.0 | 2.0 | 1120 | $1,299 | $1.16 | 43d | 1 | 0.07mi |
| 71580 Penny Ct Unit 253 Bruce Township, MI | 3.0 | 2.0 | 1216 | $1,219 | $1.00 | 14d | 1 | 0.07mi |
| 11981 Springbrook Ct Unit 10 Bruce Township, MI | 2.0 | 2.0 | 960 | $1,269 | $1.32 | 20d | 1 | 0.20mi |
| 11747 Cascade Cir Unit 92 Bruce Township, MI | 3.0 | 2.0 | 1152 | $1,379 | $1.20 | 43d | 1 | 0.21mi |
| 12556 Margaret Ct Unit 287 Bruce Township, MI | 3.0 | 2.0 | 1152 | $1,569 | $1.36 | 4d | 1 | 0.21mi |
| 11791 Cascade Cir Unit 76 Bruce Township, MI | 4.0 | 2.0 | 1344 | $1,409 | $1.05 | 24d | 1 | 0.22mi |
| 11827 Cascade Cir Unit 4 Bruce Township, MI | 3.0 | 2.0 | 1056 | $1,299 | $1.23 | 43d | 1 | 0.33mi |
| 324 E Saint Clair St Romeo, MI | 2.0 | 1.5 | 1200 | $1,550 | $1.29 | 43d | 1 | 1.39mi |
HOA detail condo
- Monthly dues
- $0 · $0/yr
- Likely covers
- pool
- Assessments
- None detected in remarks — confirm with the listing agent.
Listing history 10 events
-
2026-06-18days on market $39,900 Active 15 DOM
-
2026-06-17days on market $39,900 Active 14 DOM
-
2026-06-16days on market $39,900 Active 13 DOM
-
2026-06-15days on market $39,900 Active 12 DOM
-
2026-06-13days on market $39,900 Active 10 DOM
-
2026-06-09days on market $39,900 Active 6 DOM
-
2026-06-08days on market $39,900 Active 5 DOM
-
2026-06-07days on market $39,900 Active 4 DOM
-
2026-06-04remarks 568-char remark
-
2026-06-04$39,900 Active 1 DOM
ⓘ Source: listings_history table (triggers on properties + properties_extension) + one-shot
backfill from property_details.listing_events for pre-trigger history.
Nearby sold comps map
Loading sold comps map…
Walkable amenities ~0.75 mi
Loading nearby amenities…
Taxation est. · year 1
- Rental income
- $15,972
- − Mortgage interest
- −$2,235
- − Property taxes
- −$598
- − Insurance
- −$200
- − Repairs & maintenance
- −$1,278
- − Management
- −$1,278
- − Depreciation
- −$1,161
- Taxable income
- $9,223
- Est. tax owed @ 24.0%
- −$2,213
- After-tax cash flow
- $7,096/yr
For passive investors: Depreciation is non-cash, so a rental often shows a tax loss while cash-flowing — sheltering income. Rental losses are passive: they offset passive income freely, and up to $25,000/yr can offset ordinary (W-2) income if you actively participate and your MAGI is under $100k (phasing out to $0 by $150k); unused losses carry forward. On sale, claimed depreciation is recaptured at up to 25%, and gains may owe capital-gains tax (a 1031 exchange can defer both). Figures are a year-1 estimate at your 24.0% rate — not tax advice; consult a CPA.
Condition & rehab AI · 13 photos
This move-in ready 2018 Champion home in Springbrook Estates is in good condition with no major repairs needed. It offers a good return on investment with updates that would increase its resale and rental value.
Value-add opportunities
- Both landscaping — improve curb appeal and increase property value
- Both furniture — improve living space and make home more attractive
Renovation cost estimate screening
Value-add ROI direction
- Both landscaping — improve curb appeal and increase property value ↑
- Both furniture — improve living space and make home more attractive ↑
ⓘ Cost ranges are severity-bucket heuristics (US national rule-of-thumb). Get contractor quotes + a written scope before underwriting a rehab budget.
Schools (NCES district)
- District
- Romeo Community Schools
- NCES district ID
- 2630090
- Math proficiency
- 43% ▼ -5.00%
- Reading proficiency
- 51% ▼ -8.00%
- Median HH income
- $73,121
- Composite
- 42.48/100
- National rank
- #3212
- State rank
- #102 of 540 in MI
Livability — Bruce
No livability data for this city. (Only ~50 U.S. cities are tracked.)
Census & demographics
- Population (ZIP)
- 11,344
Population outlook (Macomb County) Hauer SSP2
- Today (2025)
- 925,296 people
- By 2030
- 948,226 · +2.5%
- By 2040
- 983,961 · +6.3%
- By 2050
- 1,010,200 · +9.2%
- By 2075
- 1,076,222 · +16.3%
- By 2100
- 1,077,065 · +16.4%
Race, ethnicity, and origin ACS 2023
- Neighborhood character
- Predominantly White (91%)
- Race & ethnicity
- White 91% Hispanic / Latino 5% Two or more races 4%
- Common ancestry
- Romanian 14% Lithuanian 4% Slovak 4%
- Foreign-born
- 4% · Canada
- Languages at home
- 95% English-only · Spanish 3% Other Indo-European 1% German/W. Germanic 1%
Political lean MEDSL · Macomb
- 2024 margin
- R (+13.7) · D 42.2% · R 55.9% · Other 1.9%
- 2008→2024 swing
- -22.3pp toward R · 2008: 8.6pp · 2024: -13.7pp
- All cycles
- 2024: R+13.7 2020: R+8.1 2016: R+11.6 2012: D+4.0 2008: D+8.6
Not yet ingested
- Civics
- —
Market trends
- HPI YoY
- ▼ -252.70%
- Current HPI
- 214.524
- Rent YoY
- —
- Metro
- —
- State GDP YoY
- ▲ 1.37%
- F500 in state
- 28
Industry mix (Fortune 500 HQ in MI)
| Industry | F500 HQs | Revenue |
|---|---|---|
| Automotive Parts | 3 | $48B |
|
||
| Automotive | 2 | $372B |
|
||
| Chemicals | 1 | $45B |
|
||
| Automotive Retail | 1 | $29B |
|
||
| Healthcare / Medical Devices | 1 | $23B |
|
||
| Automotive Technology | 1 | $20B |
|
||
Price history
+0.0% since first listed2 events — show timeline
- 2026-06-03 Listed $39,900 REALCOMP
- 2026-06-03 Listed $39,900 MiRealSource-MiMLS
Cash-flow waterfall
monthlySold comps — $/sqft
last 12 mo · ≤1 miLoading sold comps…