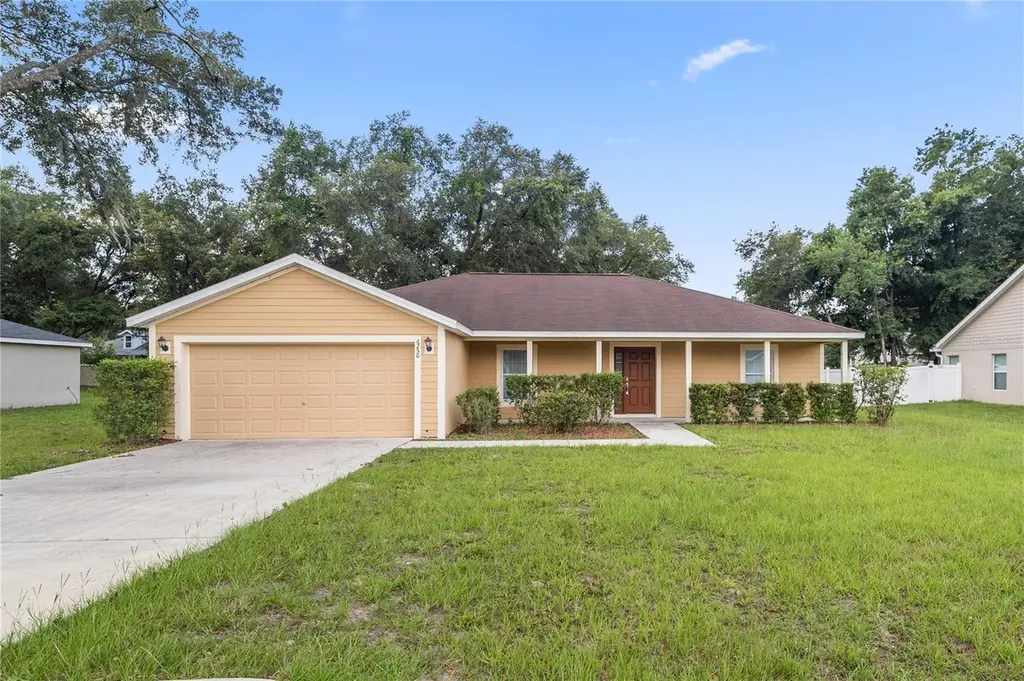
6250 SW 116th Street Rd · Liberty Triangle, FL
Flood risk 5/10 · Moderate
- FEMA flood zone
- X (unshaded)
- Chance of flooding over 30 yrs
- 0.57%
- Est. flood insurance / yr
- $507 – $1,088
Fire risk 4/10 · Minor
- Est. fire insurance / yr
- $947 – $1,759
Heat risk 8/10 · Major
- Hot days now (above 108°F)
- 7 days/yr
- Hot days in 30 yrs
- 20 days/yr
Wind risk 9/10 · Severe
- Chance of severe wind over 30 yrs
- 99.0%
Air-quality risk 2/10 · Minimal
- Unhealthy air days now
- 2 days/yr
- Unhealthy air days in 30 yrs
- 2 days/yr
Risk factors via First Street. Map © Google.
Why this score? — see what drove the D- grade
The composite is a weighted blend of 9 inputs, each scored 0–100. Each bar is that input's sub-score; the figure is the points it added to the 100-point composite (weight × sub-score).
- ARV discount +11.5/15.0
- Cash flow +10.9/30.0
- Schools +3.6/10.0
- DSCR +3.2/10.0
- 1% rule +3.1/10.0
- Livability +2.5/5.0
- Condition / age +2.5/5.0
- Rent growth +1.9/5.0
- Appreciation +0.0/10.0
$289,999
🖨 Deal sheet 📄 Offer letter ✓ Due diligence
Listing remarks MLS
MOVE IN READY!! Welcome to your dream home! This beautiful 3-bedroom, 2-bathroom residence, built in 2017, is move-in ready and designed with modern living in mind. Situated on a generous 0.35-acre lot, this property offers both space and convenience, making it the perfect place to call home. Step inside to discover an inviting open floorplan featuring high ceilings and elegant tile flooring throughout. The split floorplan ensures privacy, with the master suite separated from the other bedrooms, ideal for families or guests. The spacious master bedroom includes a luxurious en-suite bathroom, providing a private retreat at the end of the day. The heart of this home is the bright and airy living area, seamlessly flowing into the dining space and well-appointed kitchen. Large windows and sliding glass doors flood the space with natural light, creating a warm and welcoming atmosphere. Step out onto the rear screened lanai, perfect for enjoying your morning coffee or entertaining friends and family while overlooking the expansive backyard. Location is key, and this home does not disappoint. Just minutes away from Highway 200, you’ll have easy access to the mall, shopping centers, eateries, and medical facilities. Enjoy the best of both worlds with a short drive to the stunning Crystal River, charming downtown Ocala, and the vibrant communities of The Villages and Gainesville. Don't miss out on this incredible opportunity to own a modern, move-in ready home in a prime location.
Key facts
- Master suite
- Split floorplan
- Open floorplan
Tags
Neighborhood map
What this means for you Summary
Snapshot
- This is a 3-bed/2.0-bath single-family listed at $290k.
Deal economics
- At list price, monthly cash flow is $-125 ($-2k/yr) — negative.
- To cash-flow at today's rent, offer at most $268k (7.6% below list).
- To meet the 1% rule (rent ≥ 1% of price), the offer needs to be $234k (19.4% below list).
- Recommended offer: $234k (19.4% below list) — sets the bar for 1% rule.
- Cap rate 5.8% vs local median 4.5% in Liberty Triangle — meaningfully above typical; check what's discounted (condition, days-on-market, listing class) to confirm the premium yield is real.
Location & tenants
- Location reads: area grade D — affects rentability + tenant quality, not the cash-flow math above.
- Marion (rural): math 42% / reading 43% proficiency, ranked #61 of 73 in FL (top 84%) — families likely to look elsewhere, expect single-tenant / working-renter base with shorter leases; 61% free/reduced lunch — lower-income household profile, screen leases tightly.
- Market conditions: Rents soft (-2.6%/yr); 852 active listings in the ZIP; 6 comparable units currently listed for rent nearby; rentals at typical pace (median 21d on market — plan ~3-4 weeks tenant-placement turnaround); 7,071 units permitted in Marion County in 2024 (534 in 5+ unit buildings).
- This rent runs 43% of the median local income ($66k/yr) — at the standard rent-burdened threshold; future hikes will face affordability resistance.
Forward outlook
- Local home prices are declining (-3.0%/yr); year-one equity from $2k of loan paydown is wiped out by about $9k of value loss. Plan a longer hold.
- Marion County population projected at +13% by 2050 — modest demand growth; plan on rents tracking national, not racing it.
Negotiation context
- It's been on market 73 days — a 6% lower offer ($273k) is reasonable based on typical stale-listing flexibility.
- 9 sale attempts since 9y ago with the ask held roughly flat each time — persistent listings suggest the price (not the market) is what's stuck; bring a comps-based counter.
Risks & watch-outs
- Climate carrying-cost: moderate flood risk; severe wind risk, 99% chance of damaging wind over 30y; extreme-heat days projected 7→20/yr by 2055 (HVAC capex compounding) — expect insurance premiums to compound above CPI over the hold.
Questions for the listing agent
- What do current leases actually rent for vs. the listed asking? Can we see a recent rent roll and the last 12 months of T-12 income?
- It's been on market 73 days. Have you received any prior offers? Is the seller open to a 19% concession, seller financing, or rate buy-down credit?
- What does the HOA fee cover, when was the last increase, and are there any pending special assessments or reserve-fund shortfalls?
- Why hasn't it sold? Are there any deal-killer items the seller is aware of (foundation, flood, title, zoning, code violations)?
- Is there a deadline driving the sale (1031 exchange, divorce, estate, relocation)? That informs how much negotiation room exists.
- The area grade is low — what's the realistic commute time and amenity access for the typical tenant pool here? Any planned neighborhood developments (good or bad) we should know about?
- What's the average days-on-market for RENTAL listings here right now (not sales)? A rising rental-DOM trend means longer vacancies and softer asking-rent achievability than the comps imply.
- What's the recent tenant-quality profile in this submarket — average credit score on applications, eviction rate, late-payment / NSF rate, and stable-employment percentage? A property-management company in the area should have these aggregated.
- How much new for-sale + rental construction is in the pipeline within 1–3 miles? Heavy new supply typically softens prices + rents 12–24 months out; constrained supply supports both.
Investment metrics
- 1% rule
- 0.81% ✗
- Cap rate
- 5.77%
- Cash-on-cash
- -1.85%
- DSCR
- 0.92
- GRM
- 10.3
CMA / ARV
- ARV (median comp)
- $318,300
- List price
- $289,999
- Delta
- -8.89%
- Verdict
- FAIR
- Comps
- 20 within 1.0 mi
Show comp detail 10 sales within ~0.75 mi
| Address | Dist | Beds/Ba | Sqft | Sold | Price | $/sf | Match |
|---|---|---|---|---|---|---|---|
| 11635 SW 65th Avenue Rd | 0.11mi | 4/2.0 (+1) | 1,722 (+8%) | 1mo | $367,000 | $213 | 75 |
| 5900 SW 111th Place Rd | 0.52mi | 3/2.0 | 1,526 (-4%) | 2mo | $235,000 | $154 | 67 |
| 14285 SW 60th Ter | 0.21mi | 3/2.0 | 1,445 (-9%) | 12mo | $287,500 | $199 | 64 |
| 6679 SW 112th St | 0.57mi | 2/2.0 (-1) | 1,596 (+0%) | 6mo | $264,900 | $166 | 63 |
| 10987 SW 69th Cir | 0.68mi | 2/2.0 (-1) | 1,578 (-1%) | 1mo | $257,000 | $163 | 61 |
| 13632 SW 61st Cir | 0.30mi | 3/2.0 | 1,445 (-9%) | 19mo | $310,000 | $215 | 55 |
| 6246 SW 115th Street Rd | 0.48mi | 3/2.0 | 1,526 (-4%) | 19mo | $224,900 | $147 | 54 |
| 11663 SW 72nd Cir | 0.27mi | 3/2.0 | 1,375 (-14%) | 14mo | $267,500 | $195 | 53 |
| 6776 SW 114th Street Rd SW | 0.56mi | 3/3.0 | 1,665 (+4%) | 17mo | $259,000 | $156 | 48 |
| 6870 SW 112th St | 0.72mi | 2/2.0 (-1) | 1,425 (-10%) | 5mo | $210,500 | $148 | 40 |
Match score weights: distance 35% · size 25% · config 20% · recency 20%. Top-matched comps best support the ARV.
Projected returns pro-forma
-3.0% appreciation · 0.0% rent growth · sell at horizon
- IRR
- -22.7%
- Equity multiple
- 0.24×
- Total profit
- $-61,810
- Equity at exit
- $43,240
- IRR
- -27.1%
- Equity multiple
- -0.11×
- Total profit
- $-90,506
- Equity at exit
- $25,074
Cash invested: $81,200 (down + closing). Projections, not guarantees.
Landlord ↔ Tenant lean methodology
- Overall (STATE)
- 87 Strongly Landlord-Friendly
- State Florida
- 87 Strongly Landlord-Friendly · R+3
- County
- — inherits STATE
- City
- — inherits STATE
ZIP-level market 34476
- Rents YoY
- -2.6%
- Active inventory
- 852
- Price-to-rent
- 10.3×
Monthly cashflow live
- Estimated rent
- $2,336 high interval (Pro) →
- Mortgage (P&I)
- −$1,521
- Tax from tax record
- −$325 /mo · $3,895/yr
- Insurance
- −$121
- HOA
- −$5
- Vacancy / Maint / Mgmt
- −$491
- Net cashflow
- $-125
Break-even live
UW: 25.0% down · 7.5% · 30yr · 1.5% tax · 5.0% vac · 8.0% maint · 8.0% mgmt
Financing live
Cash to close
- Down payment
- $72,500
- Closing costs
- $8,700
- Reserves months
- —
- Total cash needed
- —
Loan-product check · same deal, 3 products live
Conventional
25% down · 7.5% · 30yr
- Down + closing
- —
- Monthly P&I
- —
- Monthly cashflow
- —
- DSCR
- —
- Eligible?
- —
Personal DTI + credit; lowest rate.
DSCR
20% down · 8.5% · 30yr
- Down + closing
- —
- Monthly P&I
- —
- Monthly cashflow
- —
- DSCR
- —
- Eligible?
- —
No personal income docs; deal must DSCR.
Hard money
10% down · 12.0% · 12mo
- Down + closing
- —
- Monthly P&I
- —
- Monthly cashflow
- —
- DSCR
- —
- Eligible?
- —
Short-term bridge; refi at stabilization.
Rent comps 6 comps
| Address | Beds | Baths | Sqft | Rent | $/sqft | DOM | Units | Dist |
|---|---|---|---|---|---|---|---|---|
| 6367 SW 117th Street Rd Ocala, FL | 3.0 | 2.0 | 1602 | $2,650 | $1.65 | 21d | 1 | 0.10mi |
| 11302 SW 62nd Cir Ocala, FL | 3.0 | 2.0 | 1526 | $2,095 | $1.37 | 21d | 1 | 0.20mi |
| 10912 SW 69th Cir Ocala, FL | 2.0 | 2.0 | 1169 | $1,600 | $1.37 | 21d | 1 | 0.50mi |
| 14173 SW 60th Ter Unit 2 Ocala, FL | 2.0 | 2.0 | 1127 | $1,450 | $1.29 | 21d | 1 | 0.93mi |
| 12816 SW 61st Ave Ocala, FL | 4.0 | 2.0 | 2134 | $2,100 | $0.98 | 13d | 1 | 1.30mi |
| 13915 SW 64th Terrace Rd Unit 1 Ocala, FL | 3.0 | 2.0 | 1124 | $1,524 | $1.36 | 13d | 1 | 1.44mi |
HOA detail
- Monthly dues
- $5 · $60/yr
Listing history 49 events
-
2026-06-18days on market $289,999 Active 73 DOM
-
2026-06-17days on market $289,999 Active 72 DOM
-
2026-06-16days on market $289,999 Active 71 DOM
-
2026-06-15days on market $289,999 Active 70 DOM
-
2026-06-14days on market $289,999 Active 68 DOM
-
2026-06-13days on market $289,999 Active 67 DOM
-
2026-06-10days on market $289,999 Active 65 DOM
-
2026-06-09days on market $289,999 Active 64 DOM
-
2026-06-08days on market $289,999 Active 63 DOM
-
2026-06-07days on market $289,999 Active 62 DOM
-
2026-06-03days on market $289,999 Active 58 DOM
-
2026-06-02days on market $289,999 Active 57 DOM
-
2026-06-01days on market $289,999 Active 56 DOM
-
2026-05-31days on market $289,999 Active 55 DOM
-
2026-05-30days on market $289,999 Active 54 DOM
-
2026-05-14price $289,999 1502-char remark
Show marketing remark (1502 chars)
MOVE IN READY!! Welcome to your dream home! This beautiful 3-bedroom, 2-bathroom residence, built in 2017, is move-in ready and designed with modern living in mind. Situated on a generous 0.35-acre lot, this property offers both space and convenience, making it the perfect place to call home. Step inside to discover an inviting open floorplan featuring high ceilings and elegant tile flooring throughout. The split floorplan ensures privacy, with the master suite separated from the other bedrooms, ideal for families or guests. The spacious master bedroom includes a luxurious en-suite bathroom, providing a private retreat at the end of the day. The heart of this home is the bright and airy living area, seamlessly flowing into the dining space and well-appointed kitchen. Large windows and sliding glass doors flood the space with natural light, creating a warm and welcoming atmosphere. Step out onto the rear screened lanai, perfect for enjoying your morning coffee or entertaining friends and family while overlooking the expansive backyard. Location is key, and this home does not disappoint. Just minutes away from Highway 200, you’ll have easy access to the mall, shopping centers, eateries, and medical facilities. Enjoy the best of both worlds with a short drive to the stunning Crystal River, charming downtown Ocala, and the vibrant communities of The Villages and Gainesville. Don't miss out on this incredible opportunity to own a modern, move-in ready home in a prime location.
-
2026-05-03price $1,799
-
2026-04-09price $1,845
-
2026-04-06$294,999 Active 1502-char remark
Show marketing remark (1502 chars)
MOVE IN READY!! Welcome to your dream home! This beautiful 3-bedroom, 2-bathroom residence, built in 2017, is move-in ready and designed with modern living in mind. Situated on a generous 0.35-acre lot, this property offers both space and convenience, making it the perfect place to call home. Step inside to discover an inviting open floorplan featuring high ceilings and elegant tile flooring throughout. The split floorplan ensures privacy, with the master suite separated from the other bedrooms, ideal for families or guests. The spacious master bedroom includes a luxurious en-suite bathroom, providing a private retreat at the end of the day. The heart of this home is the bright and airy living area, seamlessly flowing into the dining space and well-appointed kitchen. Large windows and sliding glass doors flood the space with natural light, creating a warm and welcoming atmosphere. Step out onto the rear screened lanai, perfect for enjoying your morning coffee or entertaining friends and family while overlooking the expansive backyard. Location is key, and this home does not disappoint. Just minutes away from Highway 200, you’ll have easy access to the mall, shopping centers, eateries, and medical facilities. Enjoy the best of both worlds with a short drive to the stunning Crystal River, charming downtown Ocala, and the vibrant communities of The Villages and Gainesville. Don't miss out on this incredible opportunity to own a modern, move-in ready home in a prime location.
-
2026-03-24$1,874
-
2026-03-06historical $1,874
-
2026-02-14$1,874
-
2025-08-16historical $1,974
-
2025-05-29$1,974
-
2025-01-20historical
-
2025-01-17price $274,900
-
2024-11-09$284,900 Active
-
2024-11-08historical
-
2024-11-01historical $1,950
-
2024-10-31price $299,699
-
2024-10-14price $299,799
-
2024-09-20price $299,899
-
2024-08-28$1,950
-
2024-08-12price $299,999
-
2024-07-25price $304,999
-
2024-07-22price $309,999
-
2024-06-19$314,999 Active
-
2023-09-18soldstatus $285,000
-
2023-09-15soldstatus $285,000 Closed
-
2023-08-11status Pending
-
2023-08-10price $288,000
-
2023-07-27price $293,000
-
2023-07-06price $299,000
-
2023-06-30$302,000 Active
-
2023-06-21soldstatus $266,429
-
2017-11-09soldstatus $176,166
-
2017-11-09$176,166
-
2017-06-15soldstatus $23,000
-
2016-10-28soldstatus $75,000
ⓘ Source: listings_history table (triggers on properties + properties_extension) + one-shot
backfill from property_details.listing_events for pre-trigger history.
Tax reassessment forecast FL · Resets to sale price
- Current annual tax
- $3,895 · $325/mo
- Projected year-2 tax
- $3,895 · $325/mo
- Expected delta
- $0/yr ($0/mo · 0.0%)
ⓘ Screening estimate from a state-policy table — verify with the county assessor before closing.
Climate risk First Street
- Flood 5/10 Major FEMA zone X (unshaded) · 57% chance over 30 yrs
- Wildfire 4/10 Moderate
- Heat 8/10 Severe 7 d/yr ≥108°F today · 20 d/yr by 30 yrs out
- Wind 9/10 Extreme 99% chance of damaging wind over 30 yrs
- Air quality 2/10 Low 2 unhealthy d/yr today · 2 by 30 yrs out
Nearby sold comps map
Loading sold comps map…
Walkable amenities ~0.75 mi
Loading nearby amenities…
Taxation est. · year 1
- Rental income
- $28,038
- − Mortgage interest
- −$16,244
- − Property taxes
- −$3,895
- − Insurance
- −$1,450
- − Repairs & maintenance
- −$2,243
- − Management
- −$2,243
- − HOA
- −$60
- − Depreciation
- −$8,436
- Taxable loss
- −$6,534
- Est. tax savings @ 24.0%
- +$1,568
- After-tax cash flow
- $64/yr
For passive investors: Depreciation is non-cash, so a rental often shows a tax loss while cash-flowing — sheltering income. Rental losses are passive: they offset passive income freely, and up to $25,000/yr can offset ordinary (W-2) income if you actively participate and your MAGI is under $100k (phasing out to $0 by $150k); unused losses carry forward. On sale, claimed depreciation is recaptured at up to 25%, and gains may owe capital-gains tax (a 1031 exchange can defer both). Figures are a year-1 estimate at your 24.0% rate — not tax advice; consult a CPA.
Schools (NCES district)
- District
- Marion
- NCES district ID
- 1201260
- Math proficiency
- 42% ▼ -7.00%
- Reading proficiency
- 43% ▼ -4.00%
- Median HH income
- $40,015
- Composite
- 35.61/100
- National rank
- #4890
- State rank
- #61 of 73 in FL
Livability — Liberty Triangle
No livability data for this city. (Only ~50 U.S. cities are tracked.)
Census & demographics
- Census place
- Liberty Triangle, FL
- County
- Marion County · 315,796 people
- City population
- 26,397
- Metro
- Ocala, FL
- Population (ZIP)
- 28,997
- Household income
- $65,860
- Rent vs Own
- Severe rent burden
- 204.0
Population outlook (Marion County) Hauer SSP2
- Today (2025)
- 365,905 people
- By 2030
- 376,768 · +3.0%
- By 2040
- 396,555 · +8.4%
- By 2050
- 412,723 · +12.8%
- By 2075
- 446,090 · +21.9%
- By 2100
- 436,193 · +19.2%
Race, ethnicity, and origin ACS 2023
- Neighborhood character
- Diverse neighborhood (Simpson 0.55)
- Race & ethnicity
- White 63% Hispanic / Latino 18% Black 13% Two or more races 10% Asian 1%
- Hispanic origin (detail)
- Mexican 3% Puerto Rican 8% Cuban 3%
- Common ancestry
- Romanian 3% Slovak 3% Lithuanian 3%
- Foreign-born
- 15% · Canada, Jamaica, Dominican Republic
- Languages at home
- 83% English-only · Spanish 14% Other Indo-European 1% German/W. Germanic 1%
Political lean MEDSL · Marion
- 2024 margin
- Solid R (+31.6) · D 33.8% · R 65.5%
- 2008→2024 swing
- -20.0pp toward R · 2008: -11.6pp · 2024: -31.6pp
- All cycles
- 2024: R+31.6 2020: R+25.9 2016: R+26.2 2012: R+16.2 2008: R+11.6
Not yet ingested
- Civics
- —
Market trends
- HPI YoY
- ▼ -105.22%
- Current HPI
- 189.0869
- Rent YoY
- ▼ -2.57%
- Metro
- Ocala, FL
- State GDP YoY
- ▲ 3.28%
- F500 in state
- 36
Industry mix (Fortune 500 HQ in FL)
| Industry | F500 HQs | Revenue |
|---|---|---|
| Industrial Technology | 2 | $29B |
|
||
| Insurance | 2 | $17B |
|
||
| Retail | 1 | $60B |
|
||
| Technology Distribution | 1 | $58B |
|
||
| Homebuilding | 1 | $35B |
|
||
| Technology Manufacturing | 1 | $35B |
|
||
Price history
+286.7% since first listed34 events — show timeline
- 2026-05-14 Price Changed $289,999 Stellar MLS as Distributed by MLS Grid
- 2026-05-03 Price Changed $1,799 TENANTTURNER2
- 2026-04-09 Price Changed $1,845 TENANTTURNER2
- 2026-04-06 Listed $294,999 Stellar MLS as Distributed by MLS Grid
- 2026-03-24 Listed for Rent $1,874 TENANTTURNER2
- 2026-03-06 Rental Removed $1,874 TENANTTURNER2
- 2026-02-14 Listed for Rent $1,874 TENANTTURNER2
- 2025-08-16 Rental Removed $1,974 TENANTTURNER2
- 2025-05-29 Listed for Rent $1,974 TENANTTURNER2
- 2025-01-20 Listing Removed — Stellar MLS as Distributed by MLS Grid
- 2025-01-17 Price Changed $274,900 Stellar MLS as Distributed by MLS Grid
- 2024-11-09 Listed $284,900 Stellar MLS as Distributed by MLS Grid
- 2024-11-08 Listing Removed — Stellar MLS as Distributed by MLS Grid
- 2024-11-01 Rental Removed $1,950 STELLARMLS
- 2024-10-31 Price Changed $299,699 Stellar MLS as Distributed by MLS Grid
- 2024-10-14 Price Changed $299,799 Stellar MLS as Distributed by MLS Grid
- 2024-09-20 Price Changed $299,899 Stellar MLS as Distributed by MLS Grid
- 2024-08-28 Listed for Rent $1,950 STELLARMLS
- 2024-08-12 Price Changed $299,999 Stellar MLS as Distributed by MLS Grid
- 2024-07-25 Price Changed $304,999 Stellar MLS as Distributed by MLS Grid
- 2024-07-22 Price Changed $309,999 Stellar MLS as Distributed by MLS Grid
- 2024-06-19 Listed $314,999 Stellar MLS as Distributed by MLS Grid
- 2023-09-18 Sold (Public Records) $285,000 Public Records
- 2023-09-15 Sold (MLS) $285,000 Stellar MLS as Distributed by MLS Grid
- 2023-08-11 Pending — Stellar MLS as Distributed by MLS Grid
- 2023-08-10 Price Changed $288,000 Stellar MLS as Distributed by MLS Grid
- 2023-07-27 Price Changed $293,000 Stellar MLS as Distributed by MLS Grid
- 2023-07-06 Price Changed $299,000 Stellar MLS as Distributed by MLS Grid
- 2023-06-30 Listed $302,000 Stellar MLS as Distributed by MLS Grid
- 2023-06-21 Sold (Public Records) $266,429 Public Records
- 2017-11-09 Listed $176,166 Stellar MLS as Distributed by MLS Grid
- 2017-11-09 Sold (MLS) $176,166 Stellar MLS as Distributed by MLS Grid
- 2017-06-15 Sold (Public Records) $23,000 Public Records
- 2016-10-28 Sold (Public Records) $75,000 Public Records
Property tax history
+30.8%/yrLatest (2025): $3,895 · +3.2% YoY. Source: county tax records.
Cash-flow waterfall
monthlySold comps — $/sqft
last 12 mo · ≤1 miLoading sold comps…