3196 State Highway 166 · Cherry Valley, NY
Flood risk 5/10 · Moderate
- FEMA flood zone
- X (unshaded)
- Chance of flooding over 30 yrs
- 0.24%
- Est. flood insurance / yr
- $473 – $860
Fire risk 1/10 · Minimal
- Est. fire insurance / yr
- $691 – $1,283
Heat risk 1/10 · Minimal
- Hot days now (above 90°F)
- 8 days/yr
- Hot days in 30 yrs
- 19 days/yr
Wind risk 2/10 · Minimal
- Chance of severe wind over 30 yrs
- 1.0%
Air-quality risk 1/10 · Minimal
- Unhealthy air days now
- 0 days/yr
- Unhealthy air days in 30 yrs
- 0 days/yr
Risk factors via First Street. Map © Google.
Why this score? — see what drove the C- grade
The composite is a weighted blend of 9 inputs, each scored 0–100. Each bar is that input's sub-score; the figure is the points it added to the 100-point composite (weight × sub-score).
- Cash flow +15.0/30.0
- ARV discount +7.5/15.0
- Appreciation +6.6/10.0
- 1% rule +5.0/10.0
- DSCR +5.0/10.0
- Schools +4.1/10.0
- Livability +3.0/5.0
- Rent growth +2.5/5.0
- Condition / age +2.5/5.0
$34,900
🖨 Deal sheet (PDF) 📄 Offer letter ✓ Due diligence
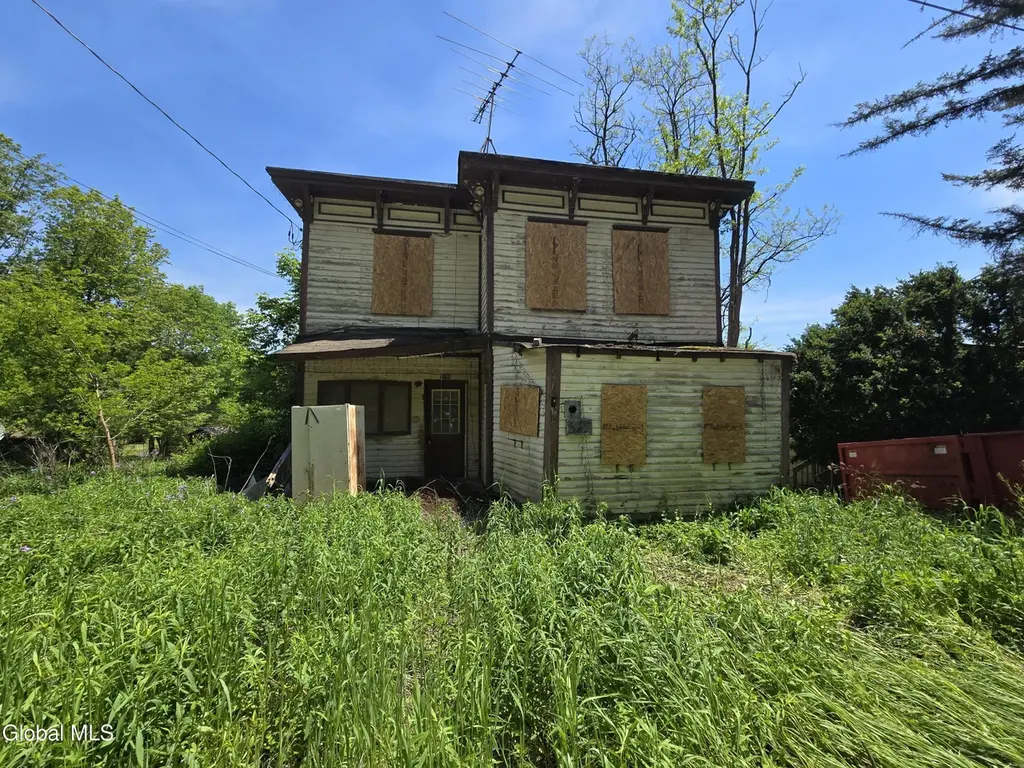
Listing remarks
Excellent location along scenic State Highway 166, surrounded by rolling countryside and minutes from Cooperstown and Oneonta. This property offers tremendous potential for those ready to remodel and make it their own. With easy access to local shops, dining, and outdoor recreation, it's an ideal opportunity to invest in a sought-after area known for its charm and community spirit. Bring your vision and creativity--this home is ready for transformation!
Key facts
- Outdoor recreation
- Sought-after area
- 0.36 acre lot
Tags
Property features AI
Exterior
- Parking: Total of 4 parking spaces
- Utilities: Septic tank; Other water source
- Home design: Single family residence; Wood siding construction
- Construction: Wood siding
- Exterior features: Lot of about 0.36 acre
Interior
- Kitchen: Kitchen on the first floor
- Bedrooms: Four bedrooms on the first floor; Four bedrooms on the second floor
- Bathrooms: One full bathroom (on the first floor)
- Heating & cooling: Wood heating
- Interior features: Unfinished walk-out basement; 11 total rooms
Neighborhood map
What this means for you Summary
Snapshot
- This is a 8-bed/1.0-bath single-family listed at $35k.
Deal economics
- At list price, monthly cash flow is $941 ($11k/yr) — positive.
- The deal already cash-flows at list — no discount required.
- Meets the 1% rule at list price ($2k rent vs $35k).
Location & tenants
- Location reads 60/100 on livability (#990 in NY) — a middle-class / working-renter tenant base. Strengths: housing A+, cost of living B+; Watch: schools C-, health & safety C-, employment D.
- Cherry Valley-Springfield Central School District (rural): math 45% / reading 45% proficiency, ranked #564 of 755 in NY (top 75%) — families likely to look elsewhere, expect single-tenant / working-renter base with shorter leases.
- Market conditions: 3 active listings in the ZIP; 133 units permitted in Otsego County in 2024 (10 in 5+ unit buildings).
Forward outlook
- In year one you build about $1k of equity ($241 loan paydown + $1k appreciation (3.3% local appreciation)).
- Otsego County population projected at -21% by 2050 — secular population decline; favor cash flow + early exit over multi-decade hold.
- At projected returns (3.3% appreciation + 3.0% rent growth), your $10k cash investment doubles in ~1 year — after that, you're playing with house money.
Negotiation context
- Only 11 days on market — expect competitive offers; lowballing is unlikely to land.
Risks & watch-outs
- Watch-outs: built in 1900 — expect roof / HVAC / electrical / plumbing capex.
- Climate carrying-cost: moderate flood risk — expect insurance premiums to compound above CPI over the hold.
Questions for the listing agent
- Built in 1900 — when were the roof, HVAC, electrical panel, plumbing, and water heater last replaced?
- Is there a deadline driving the sale (1031 exchange, divorce, estate, relocation)? That informs how much negotiation room exists.
- Crime grade is F in this area — have there been break-ins, vandalism, or insurance claims at this property in the last 3 years? What carrier currently insures it and at what premium?
- What's the average days-on-market for RENTAL listings here right now (not sales)? A rising rental-DOM trend means longer vacancies and softer asking-rent achievability than the comps imply.
- What's the recent tenant-quality profile in this submarket — average credit score on applications, eviction rate, late-payment / NSF rate, and stable-employment percentage? A property-management company in the area should have these aggregated.
- How much new for-sale + rental construction is in the pipeline within 1–3 miles? Heavy new supply typically softens prices + rents 12–24 months out; constrained supply supports both.
Investment metrics
- 1% rule
- 4.31% ✓
- Cap rate
- 38.66%
- Cash-on-cash
- 115.59%
- DSCR
- 6.14
- GRM
- 1.9
CMA / ARV
No comps found within radius.
Projected returns pro-forma
3.27% appreciation · 3.0% rent growth · sell at horizon
- IRR
- —
- Equity multiple
- 7.62×
- Total profit
- $64,681
- Equity at exit
- $16,221
- IRR
- —
- Equity multiple
- 15.91×
- Total profit
- $145,668
- Equity at exit
- $25,418
Cash invested: $9,772 (down + closing). Projections, not guarantees.
Landlord ↔ Tenant lean methodology
- Overall (STATE)
- 15 Strongly Tenant-Friendly
- State New York
- 15 Strongly Tenant-Friendly · D+10
- County
- — inherits STATE
- City
- — inherits STATE
ZIP-level market 13450
- Home prices YoY
- 2.3%
- Active inventory
- 3
- Price-to-rent
- 1.9×
Monthly cashflow live
- Estimated rent
- $1,505 medium interval (Pro) →
- Mortgage (P&I)
- −$183
- Tax from tax record
- −$50 /mo · $601/yr
- Insurance
- −$15
- HOA
- −$0
- Vacancy / Maint / Mgmt
- −$316
- Net cashflow
- $941
Break-even live
Sensitivity live
| Price | -10% $961 | -5% $951 | +0% $941 | +5% $931 | +10% $922 |
|---|---|---|---|---|---|
| Rent | -10% $822 | -5% $882 | +0% $941 | +5% $1,001 | +10% $1,060 |
| Rate | -1.0pp $959 | -0.5pp $950 | base $941 | +0.5pp $932 | +1.0pp $923 |
UW: 25.0% down · 7.5% · 30yr · 1.5% tax · 5.0% vac · 8.0% maint · 8.0% mgmt
Financing live
Cash to close
- Down payment
- $8,725
- Closing costs
- $1,047
- Reserves months
- —
- Total cash needed
- —
Loan-product check · same deal, 3 products live
Conventional
25% down · 7.5% · 30yr
- Down + closing
- —
- Monthly P&I
- —
- Monthly cashflow
- —
- DSCR
- —
- Eligible?
- —
Personal DTI + credit; lowest rate.
DSCR
20% down · 8.5% · 30yr
- Down + closing
- —
- Monthly P&I
- —
- Monthly cashflow
- —
- DSCR
- —
- Eligible?
- —
No personal income docs; deal must DSCR.
Hard money
10% down · 12.0% · 12mo
- Down + closing
- —
- Monthly P&I
- —
- Monthly cashflow
- —
- DSCR
- —
- Eligible?
- —
Short-term bridge; refi at stabilization.
Listing history 10 events
-
2026-06-21days on market $34,900 Active 11 DOM
-
2026-06-21days on market $34,900 Active 10 DOM
-
2026-06-18days on market $34,900 Active 8 DOM
-
2026-06-18price $34,900 Active 7 DOM
-
2026-06-17days on market $39,900 Active 7 DOM
-
2026-06-16days on market $39,900 Active 6 DOM
-
2026-06-15days on market $39,900 Active 5 DOM
-
2026-06-13days on market $39,900 Active 3 DOM
-
2026-06-12remarks 457-char remark
-
2026-06-12$39,900 Active 2 DOM
ⓘ Source: listings_history table (triggers on properties + properties_extension) + one-shot
backfill from property_details.listing_events for pre-trigger history.
Tax reassessment forecast NY · Partial reset (capped growth)
- Current annual tax
- $601 · $50/mo
- Projected year-2 tax
- $601 · $50/mo
- Expected delta
- $0/yr ($0/mo · 0.0%)
ⓘ Screening estimate from a state-policy table — verify with the county assessor before closing.
Climate risk First Street
- Flood 5/10 Major FEMA zone X (unshaded) · 24% chance over 30 yrs
- Wildfire 1/10 Low
- Heat 1/10 Low 8 d/yr ≥90°F today · 19 d/yr by 30 yrs out
- Wind 2/10 Low 100% chance of damaging wind over 30 yrs
- Air quality 1/10 Low 0 unhealthy d/yr today · 0 by 30 yrs out
Nearby sold comps map
Loading sold comps map…
Walkable amenities ~0.75 mi
Loading nearby amenities…
Taxation est. · year 1
- Rental income
- $18,060
- − Mortgage interest
- −$1,955
- − Property taxes
- −$601
- − Insurance
- −$174
- − Repairs & maintenance
- −$1,445
- − Management
- −$1,445
- − Depreciation
- −$1,015
- Taxable income
- $11,425
- Est. tax owed @ 24.0%
- −$2,742
- After-tax cash flow
- $8,554/yr
For passive investors: Depreciation is non-cash, so a rental often shows a tax loss while cash-flowing — sheltering income. Rental losses are passive: they offset passive income freely, and up to $25,000/yr can offset ordinary (W-2) income if you actively participate and your MAGI is under $100k (phasing out to $0 by $150k); unused losses carry forward. On sale, claimed depreciation is recaptured at up to 25%, and gains may owe capital-gains tax (a 1031 exchange can defer both). Figures are a year-1 estimate at your 24.0% rate — not tax advice; consult a CPA.
Schools (NCES district)
- District
- Cherry Valley-Springfield Central School District
- NCES district ID
- 3600006
- Math proficiency
- 45% ▲ 5.00%
- Reading proficiency
- 45% ▲ 10.00%
- Median HH income
- $49,619
- Composite
- 40.82/100
- National rank
- #7553
- State rank
- #564 of 755 in NY
Livability — Cherry Valley
- Score
- 60/100
- State rank
- #990
- US rank
- #19371
Category grades
Schools grade is shown separately in the Schools card above.
Census & demographics
- Population (ZIP)
- 251
Population outlook (Otsego County) Hauer SSP2
- Today (2025)
- 57,987 people
- By 2030
- 55,403 · -4.5%
- By 2040
- 50,336 · -13.2%
- By 2050
- 45,715 · -21.2%
- By 2075
- 38,769 · -33.1%
- By 2100
- 33,468 · -42.3%
Race, ethnicity, and origin ACS 2023
- Neighborhood character
- Predominantly White (100%)
- Race & ethnicity
- White 100%
- Common ancestry
- Serbian 30% Portuguese 2% Slovak 1%
- Languages at home
- 99% English-only · Spanish 1%
Political lean MEDSL · Otsego
- 2024 margin
- Lean R (+7.9) · D 46.1% · R 53.9%
- 2008→2024 swing
- -13.8pp toward R · 2008: 5.9pp · 2024: -7.9pp
- All cycles
- 2024: R+7.9 2020: R+5.0 2016: R+13.0 2012: D+2.0 2008: D+5.9
Not yet ingested
- Civics
- —
Market trends
- HPI YoY
- ▲ 3.27%
- Current HPI
- 148.0572
- Rent YoY
- —
- Metro
- —
- State GDP YoY
- ▲ 2.60%
- F500 in state
- 92
Industry mix (Fortune 500 HQ in NY)
| Industry | F500 HQs | Revenue |
|---|---|---|
| Financial Services | 10 | $950B |
|
||
| Consumer Goods | 9 | $162B |
|
||
| Insurance | 4 | $225B |
|
||
| Telecommunications | 2 | $144B |
|
||
| Pharmaceuticals | 2 | $112B |
|
||
| Media / Entertainment | 2 | $69B |
|
||
Price history
1 event — show timeline
- 2026-06-10 Listed $39,900 Global MLS
Property tax history
-5.2%/yrLatest (2025): $601 · +2.4% YoY. Source: county tax records.
Cash-flow waterfall
monthlySold comps — $/sqft
last 12 mo · ≤1 miLoading sold comps…