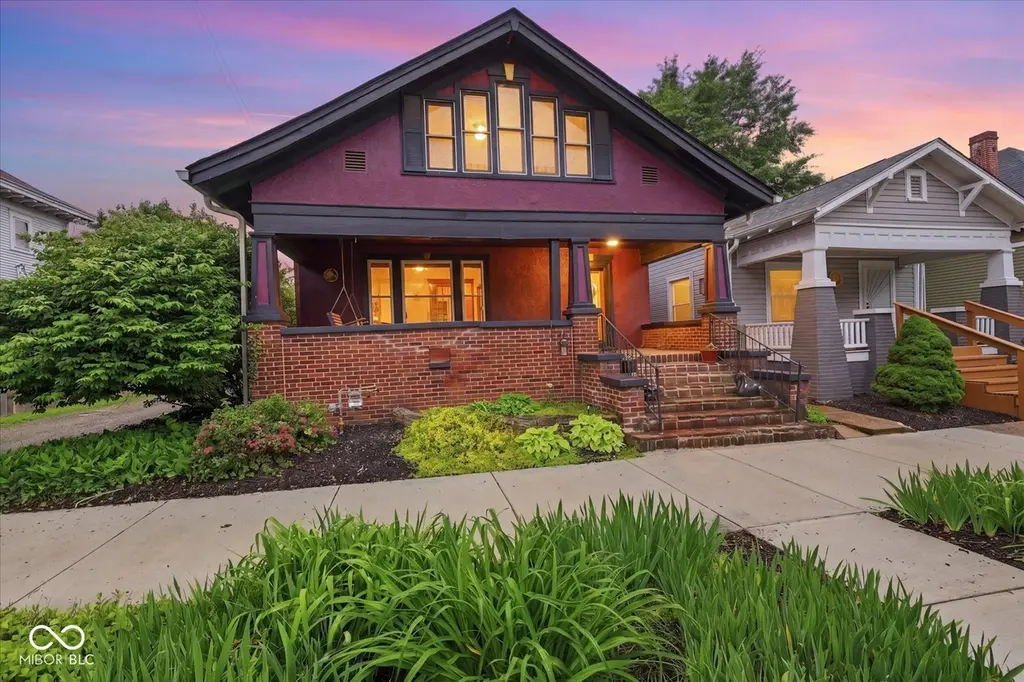
29 W Mechanic St · Shelbyville, IN
Flood risk 1/10 · Minimal
- FEMA flood zone
- X (unshaded)
- Chance of flooding over 30 yrs
- 0.0%
- Est. flood insurance / yr
- $473 – $860
Fire risk 1/10 · Minimal
- Est. fire insurance / yr
- $717 – $1,331
Heat risk 4/10 · Minor
- Hot days now (above 102°F)
- 7 days/yr
- Hot days in 30 yrs
- 20 days/yr
Wind risk 2/10 · Minimal
- Chance of severe wind over 30 yrs
- 1.0%
Air-quality risk 2/10 · Minimal
- Unhealthy air days now
- 1 days/yr
- Unhealthy air days in 30 yrs
- 2 days/yr
Risk factors via First Street. Map © Google.
Why this score? — see what drove the D grade
The composite is a weighted blend of 9 inputs, each scored 0–100. Each bar is that input's sub-score; the figure is the points it added to the 100-point composite (weight × sub-score).
- Cash flow +15.7/30.0
- ARV discount +9.3/15.0
- DSCR +4.8/10.0
- 1% rule +3.5/10.0
- Schools +3.4/10.0
- Livability +3.2/5.0
- Rent growth +2.5/5.0
- Condition / age +2.5/5.0
- Appreciation +0.0/10.0
$159,900
🖨 Deal sheet (PDF) 📄 Offer letter ✓ Due diligence
Listing remarks MLS
Home with original woodwork that just needs a little love to make it a showcase! 3 bedrooms, large living room with fireplace, dining room with original built-in china cabinet, remodeled kitchen complete with cherry cab inets and an extra large laundry room. Remodeled upper level makes spacious extra living area.
Key facts
- Painted basement
- Historical character
- Built in cabinets
Tags
Property features AI
Exterior
- Parking: Alley access; On-street parking
- Utilities: Public water; Municipal sewer
- Home design: Single-family residence; Two levels; Less than 1/4 acre lot
- Construction: Stucco exterior; Block foundation
- Exterior features: Storage
Interior
- Kitchen: Eat-in kitchen; Refrigerator
- Bedrooms: Two bedrooms on the main level
- Flooring: Hardwood floors
- Bathrooms: One full bathroom with tub and shower
- Heating & cooling: Natural gas heating; Central air conditioning
- Interior features: Built-in features; High ceilings; Hardwood floors; Eat-in kitchen; Unfinished basement; 1 fireplace in the family room
- Laundry & utility: Main-level laundry room; Electric water heater
Neighborhood map
What this means for you Summary
Snapshot
- This is a 2-bed/1.0-bath single-family listed at $160k.
Deal economics
- At list price, monthly cash flow is $69 ($829/yr) — positive.
- The deal already cash-flows at list — no discount required.
- To meet the 1% rule (rent ≥ 1% of price), the offer needs to be $136k (15.1% below list).
- Recommended offer: $136k (15.1% below list) — sets the bar for 1% rule.
- Cap rate 6.8% vs local median 4.0% in Shelbyville — top-decile yield for the area; either an underpriced asset or a hidden risk that comps aren't pricing in. Stress-test before assuming the spread holds.
Location & tenants
- Location reads 63/100 on livability (#450 in IN) — a middle-class / working-renter tenant base. Strengths: cost of living A+, housing A+, crime B; Watch: employment C-, amenities F, commute F.
- Shelbyville Central Schools (town): math 40% / reading 39% proficiency, ranked #148 of 301 in IN (top 49%) — families likely to look elsewhere, expect single-tenant / working-renter base with shorter leases.
- Zoned schools: Thomas A Hendricks Elementary Sch (math 49% / reading 39%, grade F, #408 of 994 statewide, top 41%, 533 students, 66% FRL); Shelbyville Middle School (math 37% / reading 39%, grade F, #136 of 330 statewide, top 44%, 882 students, 62% FRL); Shelbyville Sr High School (math 31% / reading 60%, grade D-, #164 of 369 statewide, top 45%, 1,101 students, 57% FRL) — zoned schools average 62% FRL vs 46% district-wide (16 pts higher); higher-poverty schools than district average — tighter screening recommended.
- Market conditions: 238 active listings in the ZIP; 7 comparable units currently listed for rent nearby; rentals leasing fast (median 13d on market — plan ~1-2 weeks tenant-placement turnaround); 285 units permitted in Shelby County in 2024 (147 in 5+ unit buildings).
Forward outlook
- Local home prices are declining (-3.0%/yr); year-one equity from $1k of loan paydown is wiped out by about $5k of value loss. Plan a longer hold.
- Shelby County population projected to shrink 6% by 2050 — rents likely to lag national; underwrite the cash flow, not the appreciation.
Negotiation context
- Only 2 days on market — expect competitive offers; lowballing is unlikely to land.
- 3 sale attempts since 19y ago with the ask held roughly flat each time — persistent listings suggest the price (not the market) is what's stuck; bring a comps-based counter.
- Current owner paid $59k; list at $160k implies a 171% gain — meaningful room to come down on a strong offer.
Risks & watch-outs
- Watch-outs: built in 1890 — expect roof / HVAC / electrical / plumbing capex.
Questions for the listing agent
- Built in 1890 — when were the roof, HVAC, electrical panel, plumbing, and water heater last replaced?
- Is there a deadline driving the sale (1031 exchange, divorce, estate, relocation)? That informs how much negotiation room exists.
- Schools are D-rated, which usually means shorter tenancies and higher turnover. Who's the typical renter profile here, and what's been the actual vacancy rate?
- The area grade is low — what's the realistic commute time and amenity access for the typical tenant pool here? Any planned neighborhood developments (good or bad) we should know about?
- What's the average days-on-market for RENTAL listings here right now (not sales)? A rising rental-DOM trend means longer vacancies and softer asking-rent achievability than the comps imply.
- What's the recent tenant-quality profile in this submarket — average credit score on applications, eviction rate, late-payment / NSF rate, and stable-employment percentage? A property-management company in the area should have these aggregated.
- How much new for-sale + rental construction is in the pipeline within 1–3 miles? Heavy new supply typically softens prices + rents 12–24 months out; constrained supply supports both.
Investment metrics
- 1% rule
- 0.85% ✗
- Cap rate
- 6.81%
- Cash-on-cash
- 1.85%
- DSCR
- 1.08
- GRM
- 9.8
CMA / ARV
- ARV (on-the-fly)
- $166,616
- Comps found
- 12
Show comp detail 12 sales within ~0.75 mi
| Address | Dist | Beds/Ba | Sqft | Sold | Price | $/sf | Match |
|---|---|---|---|---|---|---|---|
| 217 Howard St | 0.67mi | 2/1.0 | 1,410 (-0%) | 2mo | $160,000 | $113 | 67 |
| 637 W Franklin St | 0.65mi | 3/1.0 (+1) | 1,420 (+1%) | 3mo | $63,000 | $44 | 61 |
| 435 W Franklin St | 0.42mi | 2/1.0 | 1,312 (-7%) | 9mo | $175,000 | $133 | 61 |
| 264 E Pennsylvania St | 0.41mi | 3/2.0 (+1) | 1,492 (+6%) | 2mo | $175,000 | $117 | 60 |
| 410 E Mechanic St | 0.54mi | 3/1.0 (+1) | 1,564 (+11%) | 1mo | $185,000 | $118 | 51 |
| 547 W Taylor St | 0.57mi | 3/1.0 (+1) | 1,482 (+5%) | 12mo | $187,000 | $126 | 51 |
| 616 Main St | 0.73mi | 3/2.0 (+1) | 1,482 (+5%) | 1mo | $218,000 | $147 | 48 |
| 152 1st St W | 0.66mi | 3/1.0 (+1) | 1,321 (-6%) | 12mo | $134,000 | $101 | 44 |
| 637 W South St | 0.63mi | 3/2.0 (+1) | 1,578 (+12%) | 5mo | $183,000 | $116 | 38 |
| 714 W Washington St | 0.70mi | 3/2.0 (+1) | 1,553 (+10%) | 5mo | $160,000 | $103 | 38 |
| 421 W Hendricks St | 0.48mi | 3/2.0 (+1) | 1,200 (-15%) | 11mo | $209,000 | $174 | 34 |
| 407 Alice St | 0.70mi | 3/2.0 (+1) | 1,203 (-15%) | 4mo | $183,000 | $152 | 30 |
Match score weights: distance 35% · size 25% · config 20% · recency 20%. Top-matched comps best support the ARV.
Projected returns pro-forma
-3.0% appreciation · 3.0% rent growth · sell at horizon
- IRR
- -13.4%
- Equity multiple
- 0.52×
- Total profit
- $-21,555
- Equity at exit
- $23,842
- IRR
- -4.5%
- Equity multiple
- 0.70×
- Total profit
- $-13,277
- Equity at exit
- $13,825
Cash invested: $44,772 (down + closing). Projections, not guarantees.
Landlord ↔ Tenant lean methodology
- Overall (STATE)
- 90 Strongly Landlord-Friendly
- State Indiana
- 90 Strongly Landlord-Friendly · R+11
- County
- — inherits STATE
- City
- — inherits STATE
ZIP-level market 46176
- Home prices YoY
- -33.9%
- Active inventory
- 238
- Price-to-rent
- 9.8×
Monthly cashflow live
- Estimated rent
- $1,358 high interval (Pro) →
- Mortgage (P&I)
- −$839
- Tax from tax record
- −$98 /mo · $1,179/yr
- Insurance
- −$67
- HOA
- −$0
- Vacancy / Maint / Mgmt
- −$285
- Net cashflow
- $69
Break-even live
Sensitivity live
| Price | -10% $160 | -5% $114 | +0% $69 | +5% $24 | +10% $-21 |
|---|---|---|---|---|---|
| Rent | -10% $-38 | -5% $15 | +0% $69 | +5% $123 | +10% $176 |
| Rate | -1.0pp $150 | -0.5pp $110 | base $69 | +0.5pp $28 | +1.0pp $-15 |
UW: 25.0% down · 7.5% · 30yr · 1.5% tax · 5.0% vac · 8.0% maint · 8.0% mgmt
Financing live
Cash to close
- Down payment
- $39,975
- Closing costs
- $4,797
- Reserves months
- —
- Total cash needed
- —
Loan-product check · same deal, 3 products live
Conventional
25% down · 7.5% · 30yr
- Down + closing
- —
- Monthly P&I
- —
- Monthly cashflow
- —
- DSCR
- —
- Eligible?
- —
Personal DTI + credit; lowest rate.
DSCR
20% down · 8.5% · 30yr
- Down + closing
- —
- Monthly P&I
- —
- Monthly cashflow
- —
- DSCR
- —
- Eligible?
- —
No personal income docs; deal must DSCR.
Hard money
10% down · 12.0% · 12mo
- Down + closing
- —
- Monthly P&I
- —
- Monthly cashflow
- —
- DSCR
- —
- Eligible?
- —
Short-term bridge; refi at stabilization.
Rent comps 7 comps
| Address | Beds | Baths | Sqft | Rent | $/sqft | DOM | Units | Dist |
|---|---|---|---|---|---|---|---|---|
| 425 N Harrison St Shelbyville, IN | 1.0–3.0 | 1.0–2.0 | 987 | $1,516 | $1.54 | 0d | 5 | 0.13mi |
| 348 E Franklin St Shelbyville, IN | 2.0 | 1.0 | 934 | $1,295 | $1.39 | 24d | 1 | 0.50mi |
| 529 W Washington St Shelbyville, IN | 1.0 | 1.0 | 878 | $695 | $0.79 | 0d | 1 | 0.55mi |
| 713 Indiana Ave Shelbyville, IN | 2.0 | 1.0 | 1077 | $1,100 | $1.02 | 45d | 1 | 0.79mi |
| 809 Indiana Ave Unit 809 Shelbyville, IN | 2.0 | 2.0 | 1456 | $850 | $0.58 | 12d | 1 | 0.85mi |
| 1021 Amos Rd Shelbyville, IN | 3.0 | 1.5 | 1476 | $1,635 | $1.11 | 9d | 1 | 1.25mi |
| 205 Randell Ct Shelbyville, IN | 3.0 | 2.0 | 1524 | $1,796 | $1.18 | 45d | 1 | 1.36mi |
Listing history 5 events
-
2026-05-27$159,900 Active
-
2008-05-29soldstatus $59,000 315-char remark
Show marketing remark (315 chars)
Home with original woodwork that just needs a little love to make it a showcase! 3 bedrooms, large living room with fireplace, dining room with original built-in china cabinet, remodeled kitchen complete with cherry cab inets and an extra large laundry room. Remodeled upper level makes spacious extra living area.
-
2007-09-27$62,900 315-char remark
Show marketing remark (315 chars)
Home with original woodwork that just needs a little love to make it a showcase! 3 bedrooms, large living room with fireplace, dining room with original built-in china cabinet, remodeled kitchen complete with cherry cab inets and an extra large laundry room. Remodeled upper level makes spacious extra living area.
-
2007-09-13historical
-
2007-05-11$83,125
ⓘ Source: listings_history table (triggers on properties + properties_extension) + one-shot
backfill from property_details.listing_events for pre-trigger history.
Tax reassessment forecast IN · Partial reset (capped growth)
- Current annual tax
- $1,179 · $98/mo
- Projected year-2 tax
- $1,269 · $106/mo
- Expected delta
- +$90/yr (+$8/mo · 7.6%)
ⓘ Screening estimate from a state-policy table — verify with the county assessor before closing.
Climate risk First Street
- Flood 1/10 Low FEMA zone X (unshaded) · 0% chance over 30 yrs
- Wildfire 1/10 Low
- Heat 4/10 Moderate 7 d/yr ≥102°F today · 20 d/yr by 30 yrs out
- Wind 2/10 Low 100% chance of damaging wind over 30 yrs
- Air quality 2/10 Low 1 unhealthy d/yr today · 2 by 30 yrs out
Nearby sold comps map
Loading sold comps map…
Walkable amenities ~0.75 mi
Loading nearby amenities…
Taxation est. · year 1
- Rental income
- $16,290
- − Mortgage interest
- −$8,957
- − Property taxes
- −$1,179
- − Insurance
- −$800
- − Repairs & maintenance
- −$1,303
- − Management
- −$1,303
- − Depreciation
- −$4,652
- Taxable loss
- −$1,903
- Est. tax savings @ 24.0%
- +$457
- After-tax cash flow
- $1,285/yr
For passive investors: Depreciation is non-cash, so a rental often shows a tax loss while cash-flowing — sheltering income. Rental losses are passive: they offset passive income freely, and up to $25,000/yr can offset ordinary (W-2) income if you actively participate and your MAGI is under $100k (phasing out to $0 by $150k); unused losses carry forward. On sale, claimed depreciation is recaptured at up to 25%, and gains may owe capital-gains tax (a 1031 exchange can defer both). Figures are a year-1 estimate at your 24.0% rate — not tax advice; consult a CPA.
Schools (NCES district)
- District
- Shelbyville Central Schools
- NCES district ID
- 1810140
- Math proficiency
- 40% ▼ -10.00%
- Reading proficiency
- 39% ▼ -9.00%
- Median HH income
- $45,199
- Composite
- 33.63/100
- National rank
- #5402
- State rank
- #148 of 301 in IN
Livability — Shelbyville
- Score
- 63/100
- State rank
- #450
- US rank
- #16051
Category grades
Schools grade is shown separately in the Schools card above.
Census & demographics
- Census place
- Shelbyville, IN
- County
- Shelby County · 28,782 people
- City population
- 28,782
- Metro
- Indianapolis-Carmel-Anderson, IN
- Population (ZIP)
- 28,782
- Household income
- $65,182
- Rent vs Own
- Severe rent burden
- 921.0
Population outlook (Shelby County) Hauer SSP2
- Today (2025)
- 45,020 people
- By 2030
- 44,962 · -0.1%
- By 2040
- 44,126 · -2.0%
- By 2050
- 42,110 · -6.5%
- By 2075
- 37,131 · -17.5%
- By 2100
- 29,714 · -34.0%
Race, ethnicity, and origin ACS 2023
- Neighborhood character
- Predominantly White (88%)
- Race & ethnicity
- White 88% Hispanic / Latino 7% Two or more races 4% Black 2% Asian 1%
- Hispanic origin (detail)
- Mexican 5%
- Common ancestry
- Italian 2% Slovak 1% Lithuanian 1%
- Foreign-born
- 5% · Canada
- Languages at home
- 92% English-only · Spanish 5% German/W. Germanic 1% Other Asian/Pacific 1%
Political lean MEDSL · Shelby
- 2024 margin
- Solid R (+48.0) · D 25.1% · R 73.1% · Other 1.8%
- 2008→2024 swing
- -29.0pp toward R · 2008: -19.0pp · 2024: -48.0pp
- All cycles
- 2024: R+48.0 2020: R+47.7 2016: R+47.2 2012: R+33.5 2008: R+19.0
Not yet ingested
- Civics
- —
Market trends
- HPI YoY
- ▼ -116.59%
- Current HPI
- 227.6747
- Rent YoY
- —
- Metro
- Indianapolis-Carmel-Anderson, IN
- State GDP YoY
- ▲ 2.90%
- F500 in state
- 18
Industry mix (Fortune 500 HQ in IN)
| Industry | F500 HQs | Revenue |
|---|---|---|
| Industrial Machinery | 2 | $37B |
|
||
| Healthcare | 1 | $177B |
|
||
| Pharmaceuticals | 1 | $45B |
|
||
| Metals / Steel | 1 | $18B |
|
||
| Agriculture | 1 | $17B |
|
||
| Packaging | 1 | $12B |
|
||
Price history
+92.4% since first listed5 events — show timeline
- 2026-05-27 Listed $159,900 MIBOR as Distributed by MLS Grid
- 2008-05-29 Sold (MLS) $59,000 MIBOR as Distributed by MLS Grid
- 2007-09-27 Listed $62,900 MIBOR as Distributed by MLS Grid
- 2007-09-13 Listing Removed — MIBOR as Distributed by MLS Grid
- 2007-05-11 Listed $83,125 MIBOR as Distributed by MLS Grid
Property tax history
+4.2%/yrLatest (2025): $1,179 · -7.8% YoY. Source: county tax records.
Cash-flow waterfall
monthlySold comps — $/sqft
last 12 mo · ≤1 miLoading sold comps…