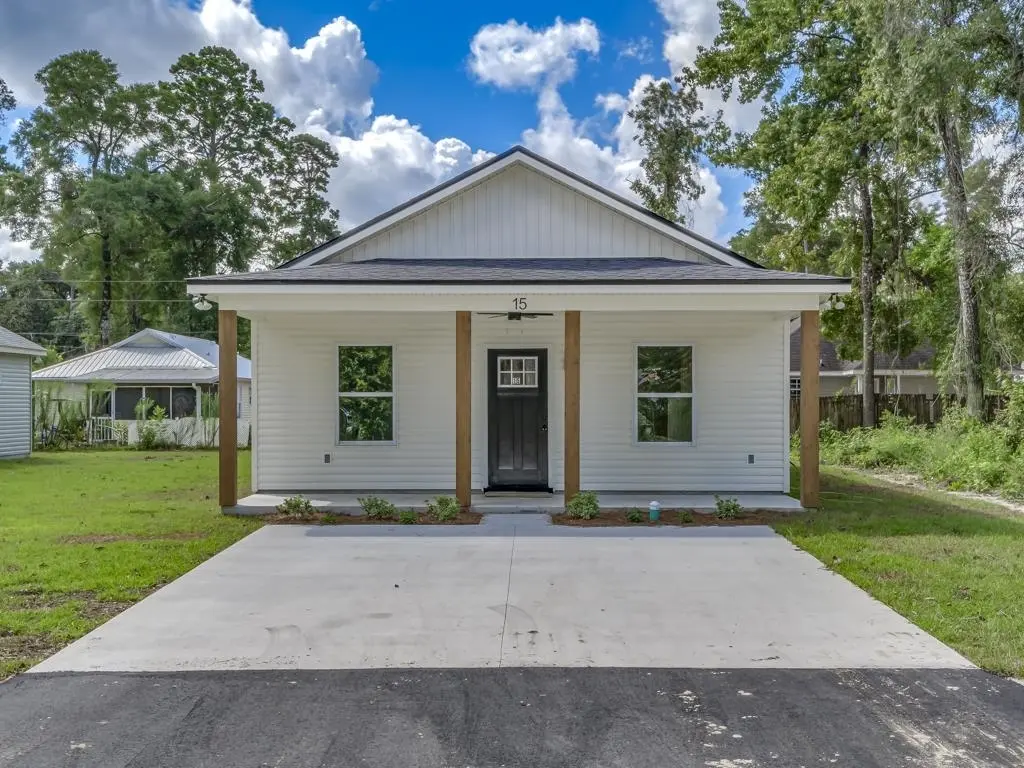
103 Beeler Rd · Crawfordville, FL
Flood risk 1/10 · Minimal
- FEMA flood zone
- X (unshaded)
- Chance of flooding over 30 yrs
- 0.0%
- Est. flood insurance / yr
- $507 – $1,088
Fire risk 6/10 · Moderate
- Est. fire insurance / yr
- $947 – $1,759
Heat risk 9/10 · Severe
- Hot days now (above 111°F)
- 7 days/yr
- Hot days in 30 yrs
- 22 days/yr
Wind risk 9/10 · Severe
- Chance of severe wind over 30 yrs
- 99.0%
Air-quality risk 3/10 · Minor
- Unhealthy air days now
- 3 days/yr
- Unhealthy air days in 30 yrs
- 3 days/yr
Risk factors via First Street. Map © Google.
Why this score? — see what drove the D- grade
The composite is a weighted blend of 9 inputs, each scored 0–100. Each bar is that input's sub-score; the figure is the points it added to the 100-point composite (weight × sub-score).
- Cash flow +8.2/30.0
- Condition / age +5.0/5.0
- Schools +4.8/10.0
- Livability +3.9/5.0
- ARV discount +3.7/15.0
- Rent growth +3.3/5.0
- Appreciation +2.7/10.0
- 1% rule +2.6/10.0
- DSCR +2.2/10.0
$230,000
🖨 Deal sheet (PDF) 📄 Offer letter ✓ Due diligence
Listing remarks
Welcome home to this newly constructed 3-bedroom, 2-bathroom home offering 1,225 sq of living space featuring an open and inviting living area with vaulted ceilings in the living room, kitchen and 9ft ceilings throughout. The kitchen has granite countertops, a large island with pendant lighting, ceramic tile backsplash, and modern black stainless-steel appliances. Durable vinyl plank floors grace the living areas and bedrooms, while the bathrooms feature elegant ceramic tile. The guest bath has a large cabinet for additional storage and a tiled shower surround. The master suite features a spacious walk-in closet with pocket door, double vanity, and large tiled shower with matte black framel
Key facts
- Open living area
- Large island
- Vaulted ceilings
Tags
Property features AI
Finance
- Financial info: For sale
Exterior
- Parking: Driveway
- Utilities: Public sewer; Publicly maintained road
- Home design: Single-story home; New construction; Vinyl siding; Has home warranty
- Construction: Slab foundation
- Exterior features: Covered porch
Interior
- Kitchen: Dishwasher; Icemaker; Microwave; Oven; Range; Refrigerator
- Bedrooms: Bedroom 2: 11x10; Bedroom 3: 10x8
- Flooring: Plank; Tile; Vinyl
- Bathrooms: 2 full bathrooms
- Heating & cooling: Central heating; Central air conditioning
- Interior features: Tray ceilings; High ceilings; Vaulted ceilings; Stall shower; Split bedroom layout; Walk-in closet(s)
- Laundry & utility: Utility room
Neighborhood map
What this means for you Summary
Snapshot
- This is a 3-bed/2.0-bath single-family listed at $230k. Condition is rated excellent.
Deal economics
- At list price, monthly cash flow is $-217 ($-3k/yr) — negative.
- To cash-flow at today's rent, offer at most $199k (13.6% below list).
- To meet the 1% rule (rent ≥ 1% of price), the offer needs to be $174k (24.5% below list).
- Recommended offer: $174k (24.5% below list) — sets the bar for 1% rule.
- Cap rate 5.2% vs local median 4.0% in Crawfordville — meaningfully above typical; check what's discounted (condition, days-on-market, listing class) to confirm the premium yield is real.
Location & tenants
- Location reads 77/100 on livability (#187 in FL, #2,943 nationally) — a middle-class / working-renter tenant base. Strengths: crime A+, cost of living A+, housing A+; Watch: amenities F, commute F.
- Wakulla (rural): math 56% / reading 56% proficiency, ranked #18 of 73 in FL (top 25%) — acceptable for families but not a draw, mixed tenant base, ~2y average lease.
- Zoned schools: Shadeville Elementary School (math 63% / reading 60%, grade B, #634 of 2,144 statewide, top 30%, 640 students, 46% FRL); Wakulla Middle School (math 55% / reading 52%, grade C+, #205 of 571 statewide, top 36%, 486 students, 41% FRL); Wakulla High School (math 42% / reading 51%, grade D-, #216 of 667 statewide, top 33%, 1,418 students, 37% FRL) — zoned schools at 41% FRL track the district average.
- Market conditions: Rents rising (+3.2%/yr); 346 active listings in the ZIP; 1 comparable units currently listed for rent nearby; solid renter incomes; 468 units permitted in Wakulla County in 2024 (0 in 5+ unit buildings).
Forward outlook
- Local home prices are declining (-3.0%/yr); year-one equity from $2k of loan paydown is wiped out by about $7k of value loss. Plan a longer hold.
Negotiation context
- It's been on market 33 days — a 3% lower offer ($223k) is reasonable based on typical stale-listing flexibility.
Risks & watch-outs
- Climate carrying-cost: severe wind risk, 99% chance of damaging wind over 30y; major wildfire risk; extreme-heat days projected 7→22/yr by 2055 (HVAC capex compounding) — expect insurance premiums to compound above CPI over the hold.
Questions for the listing agent
- What do current leases actually rent for vs. the listed asking? Can we see a recent rent roll and the last 12 months of T-12 income?
- It's been on market 33 days. Have you received any prior offers? Is the seller open to a 24% concession, seller financing, or rate buy-down credit?
- Is there a deadline driving the sale (1031 exchange, divorce, estate, relocation)? That informs how much negotiation room exists.
- Schools are B-rated — typically a magnet for longer-tenancy family renters. What's the average tenant stay here, and is there a school-zone premium baked into asking?
- The area grade is low — what's the realistic commute time and amenity access for the typical tenant pool here? Any planned neighborhood developments (good or bad) we should know about?
- What's the average days-on-market for RENTAL listings here right now (not sales)? A rising rental-DOM trend means longer vacancies and softer asking-rent achievability than the comps imply.
- What's the recent tenant-quality profile in this submarket — average credit score on applications, eviction rate, late-payment / NSF rate, and stable-employment percentage? A property-management company in the area should have these aggregated.
- How much new for-sale + rental construction is in the pipeline within 1–3 miles? Heavy new supply typically softens prices + rents 12–24 months out; constrained supply supports both.
Investment metrics
- 1% rule
- 0.76% ✗
- Cap rate
- 5.16%
- Cash-on-cash
- -4.04%
- DSCR
- 0.82
- GRM
- 11.0
CMA / ARV
- ARV (on-the-fly)
- $211,925
- Comps found
- 12
Show comp detail 12 sales within ~0.75 mi
| Address | Dist | Beds/Ba | Sqft | Sold | Price | $/sf | Match |
|---|---|---|---|---|---|---|---|
| 71 W F Magers Rd | 0.10mi | 3/2.0 | 1,300 (+6%) | 1mo | $236,000 | $182 | 85 |
| 1687 Dr Mlk Jr Memorial Rd | 0.25mi | 3/2.0 | 1,263 (+3%) | 3mo | $218,999 | $173 | 81 |
| 102 Beeler Rd | 0.04mi | 3/2.0 | 1,353 (+10%) | 2mo | $224,900 | $166 | 79 |
| 75 Blackfoot Rd | 0.49mi | 3/2.0 | 1,215 (-1%) | 1mo | $216,296 | $178 | 74 |
| 135 Catawba Trl | 0.62mi | 3/2.0 | 1,225 (0%) | 4mo | $209,900 | $171 | 68 |
| 73 W F Magers Rd | 0.09mi | 3/2.0 | 1,402 (+14%) | 5mo | $242,000 | $173 | 68 |
| 1 Blackfoot Rd | 0.71mi | 3/2.0 | 1,232 (+1%) | 1mo | $207,000 | $168 | 65 |
| 30 Menomini St | 0.75mi | 3/2.0 | 1,215 (-1%) | 3mo | $210,000 | $173 | 61 |
| 29 Klickitat Dr | 0.73mi | 3/2.0 | 1,215 (-1%) | 6mo | $209,900 | $173 | 60 |
| 17 Blackfoot Rd | 0.65mi | 4/2.0 (+1) | 1,208 (-1%) | 4mo | $250,000 | $207 | 59 |
| 119 Spokan Trl | 0.71mi | 3/2.0 | 1,055 (-14%) | 2mo | $176,000 | $167 | 42 |
| 31 Klickitat Dr | 0.73mi | 3/2.0 | 1,406 (+15%) | 6mo | $234,900 | $167 | 36 |
Match score weights: distance 35% · size 25% · config 20% · recency 20%. Top-matched comps best support the ARV.
Projected returns pro-forma
-3.0% appreciation · 3.18% rent growth · sell at horizon
- IRR
- -22.9%
- Equity multiple
- 0.21×
- Total profit
- $-50,733
- Equity at exit
- $34,294
- IRR
- -16.8%
- Equity multiple
- 0.06×
- Total profit
- $-60,548
- Equity at exit
- $19,886
Cash invested: $64,400 (down + closing). Projections, not guarantees.
Landlord ↔ Tenant lean methodology
- Overall (STATE)
- 87 Strongly Landlord-Friendly
- State Florida
- 87 Strongly Landlord-Friendly · R+3
- County
- — inherits STATE
- City
- — inherits STATE
ZIP-level market 32327
- Home prices YoY
- -1.5%
- Rents YoY
- 3.2%
- Active inventory
- 346
- Price-to-rent
- 11.0×
Monthly cashflow live
- Estimated rent
- $1,738 medium interval (Pro) →
- Mortgage (P&I)
- −$1,206
- Tax est. 1.5%
- −$288 /mo · $3,450/yr
- Insurance
- −$96
- HOA
- −$0
- Vacancy / Maint / Mgmt
- −$365
- Net cashflow
- $-217
Break-even live
Sensitivity live
| Price | -10% $-58 | -5% $-137 | +0% $-217 | +5% $-296 | +10% $-376 |
|---|---|---|---|---|---|
| Rent | -10% $-354 | -5% $-285 | +0% $-217 | +5% $-148 | +10% $-79 |
| Rate | -1.0pp $-101 | -0.5pp $-158 | base $-217 | +0.5pp $-276 | +1.0pp $-337 |
UW: 25.0% down · 7.5% · 30yr · 1.5% tax · 5.0% vac · 8.0% maint · 8.0% mgmt
Financing live
Cash to close
- Down payment
- $57,500
- Closing costs
- $6,900
- Reserves months
- —
- Total cash needed
- —
Loan-product check · same deal, 3 products live
Conventional
25% down · 7.5% · 30yr
- Down + closing
- —
- Monthly P&I
- —
- Monthly cashflow
- —
- DSCR
- —
- Eligible?
- —
Personal DTI + credit; lowest rate.
DSCR
20% down · 8.5% · 30yr
- Down + closing
- —
- Monthly P&I
- —
- Monthly cashflow
- —
- DSCR
- —
- Eligible?
- —
No personal income docs; deal must DSCR.
Hard money
10% down · 12.0% · 12mo
- Down + closing
- —
- Monthly P&I
- —
- Monthly cashflow
- —
- DSCR
- —
- Eligible?
- —
Short-term bridge; refi at stabilization.
Rent comps 1 comps
| Address | Beds | Baths | Sqft | Rent | $/sqft | DOM | Units | Dist |
|---|---|---|---|---|---|---|---|---|
| 60 Susquehanna Trl Crawfordville, FL | 3.0 | 2.0 | 1173 | $1,500 | $1.28 | 23d | 1 | 0.78mi |
Listing history 17 events
-
2026-06-22days on market $230,000 Active 33 DOM
-
2026-06-18days on market $230,000 Active 30 DOM
-
2026-06-17days on market $230,000 Active 29 DOM
-
2026-06-16days on market $230,000 Active 28 DOM
-
2026-06-15days on market $230,000 Active 27 DOM
-
2026-06-14days on market $230,000 Active 25 DOM
-
2026-06-10days on market $230,000 Active 22 DOM
-
2026-06-09days on market $230,000 Active 21 DOM
-
2026-06-08days on market $230,000 Active 20 DOM
-
2026-06-07days on market $230,000 Active 19 DOM
-
2026-06-05days on market $230,000 Active 16 DOM
-
2026-06-03days on market $230,000 Active 15 DOM
-
2026-06-02days on market $230,000 Active 14 DOM
-
2026-06-01days on market $230,000 Active 13 DOM
-
2026-05-31days on market $230,000 Active 12 DOM
-
2026-05-30days on market $230,000 Active 11 DOM
-
2026-05-19$230,000 Active
ⓘ Source: listings_history table (triggers on properties + properties_extension) + one-shot
backfill from property_details.listing_events for pre-trigger history.
Climate risk First Street
- Flood 1/10 Low FEMA zone X (unshaded) · 0% chance over 30 yrs
- Wildfire 6/10 Major
- Heat 9/10 Extreme 7 d/yr ≥111°F today · 22 d/yr by 30 yrs out
- Wind 9/10 Extreme 99% chance of damaging wind over 30 yrs
- Air quality 3/10 Moderate 3 unhealthy d/yr today · 3 by 30 yrs out
Nearby sold comps map
Loading sold comps map…
Walkable amenities ~0.75 mi
Loading nearby amenities…
Taxation est. · year 1
- Rental income
- $20,852
- − Mortgage interest
- −$12,884
- − Property taxes
- −$3,450
- − Insurance
- −$1,150
- − Repairs & maintenance
- −$1,668
- − Management
- −$1,668
- − Depreciation
- −$6,691
- Taxable loss
- −$6,659
- Est. tax savings @ 24.0%
- +$1,598
- After-tax cash flow
- $-1,003/yr
For passive investors: Depreciation is non-cash, so a rental often shows a tax loss while cash-flowing — sheltering income. Rental losses are passive: they offset passive income freely, and up to $25,000/yr can offset ordinary (W-2) income if you actively participate and your MAGI is under $100k (phasing out to $0 by $150k); unused losses carry forward. On sale, claimed depreciation is recaptured at up to 25%, and gains may owe capital-gains tax (a 1031 exchange can defer both). Figures are a year-1 estimate at your 24.0% rate — not tax advice; consult a CPA.
Condition & rehab AI · 15 photos
This newly constructed home is in excellent condition with no visible repairs or maintenance needed. It offers a good ROI with updates that would enhance its resale and rental value.
Value-add opportunities
- Resale Painting the exterior — Enhances curb appeal
- Resale Landscaping the front yard — Improves curb appeal
- Rental Adding a small outdoor seating area — Attracts renters with a cozy outdoor space
Renovation cost estimate screening
Value-add ROI direction
- Resale Painting the exterior — Enhances curb appeal ↑
- Resale Landscaping the front yard — Improves curb appeal ↑
- Rental Adding a small outdoor seating area — Attracts renters with a cozy outdoor space ↑
ⓘ Cost ranges are severity-bucket heuristics (US national rule-of-thumb). Get contractor quotes + a written scope before underwriting a rehab budget.
Schools (NCES district)
- District
- Wakulla
- NCES district ID
- 1201950
- Math proficiency
- 56% ▼ -7.00%
- Reading proficiency
- 56% ▼ -5.00%
- Median HH income
- $53,740
- Composite
- 48.12/100
- National rank
- #2183
- State rank
- #18 of 73 in FL
Livability — Crawfordville
- Score
- 77/100
- State rank
- #187
- US rank
- #2943
Category grades
Schools grade is shown separately in the Schools card above.
Census & demographics
- County
- Wakulla County · 31,445 people
- City population
- 31,445
- Metro
- Tallahassee, FL
- Population (ZIP)
- 31,445
- Household income
- $84,138
- Rent vs Own
- Severe rent burden
- 360.0
Population outlook (Wakulla County) Hauer SSP2
- Today (2025)
- 32,809 people
- By 2030
- 33,165 · +1.1%
- By 2040
- 33,245 · +1.3%
- By 2050
- 32,539 · -0.8%
- By 2075
- 29,676 · -9.5%
- By 2100
- 22,931 · -30.1%
Race, ethnicity, and origin ACS 2023
- Neighborhood character
- Predominantly White (75%)
- Race & ethnicity
- White 75% Black 15% Two or more races 6% Hispanic / Latino 5%
- Hispanic origin (detail)
- Mexican 1% Puerto Rican 1%
- Common ancestry
- Italian 5% Slovak 2% Serbian 2%
- Foreign-born
- 3% · Canada
- Languages at home
- 94% English-only · Spanish 3% Other Indo-European 1%
Political lean MEDSL · Wakulla
- 2024 margin
- Solid R (+44.4) · D 27.4% · R 71.8%
- 2008→2024 swing
- -19.5pp toward R · 2008: -24.8pp · 2024: -44.4pp
- All cycles
- 2024: R+44.4 2020: R+40.9 2016: R+40.1 2012: R+28.1 2008: R+24.8
Not yet ingested
- Civics
- —
Market trends
- HPI YoY
- ▼ -4.59%
- Current HPI
- 302.1883
- Rent YoY
- ▲ 3.18%
- Metro
- Tallahassee, FL
- State GDP YoY
- ▲ 3.28%
- F500 in state
- 36
Industry mix (Fortune 500 HQ in FL)
| Industry | F500 HQs | Revenue |
|---|---|---|
| Industrial Technology | 2 | $29B |
|
||
| Insurance | 2 | $17B |
|
||
| Retail | 1 | $60B |
|
||
| Technology Distribution | 1 | $58B |
|
||
| Homebuilding | 1 | $35B |
|
||
| Technology Manufacturing | 1 | $35B |
|
||
Price history
1 event — show timeline
- 2026-05-19 Listed $230,000 CATRS
Cash-flow waterfall
monthlySold comps — $/sqft
last 12 mo · ≤1 miLoading sold comps…