1337 N Alhambra Cir · Naples, FL
Flood risk 5/10 · Moderate
- FEMA flood zone
- AH
- Chance of flooding over 30 yrs
- 0.24%
- Est. flood insurance / yr
- $1,142 – $2,507
Fire risk 1/10 · Minimal
- Est. fire insurance / yr
- $947 – $1,759
Heat risk 10/10 · Severe
- Hot days now (above 107°F)
- 7 days/yr
- Hot days in 30 yrs
- 28 days/yr
Wind risk 10/10 · Severe
- Chance of severe wind over 30 yrs
- 99.0%
Air-quality risk 2/10 · Minimal
- Unhealthy air days now
- 2 days/yr
- Unhealthy air days in 30 yrs
- 2 days/yr
Risk factors via First Street. Map © Google.
Why this score? — see what drove the B+ grade
The composite is a weighted blend of 9 inputs, each scored 0–100. Each bar is that input's sub-score; the figure is the points it added to the 100-point composite (weight × sub-score).
- Cash flow +30.0/30.0
- ARV discount +15.0/15.0
- DSCR +10.0/10.0
- 1% rule +7.8/10.0
- Rent growth +5.0/5.0
- Schools +5.0/10.0
- Livability +4.0/5.0
- Condition / age +2.5/5.0
- Appreciation +0.0/10.0
$599,990
🖨 Deal sheet 📄 Offer letter ✓ Due diligence
Listing remarks
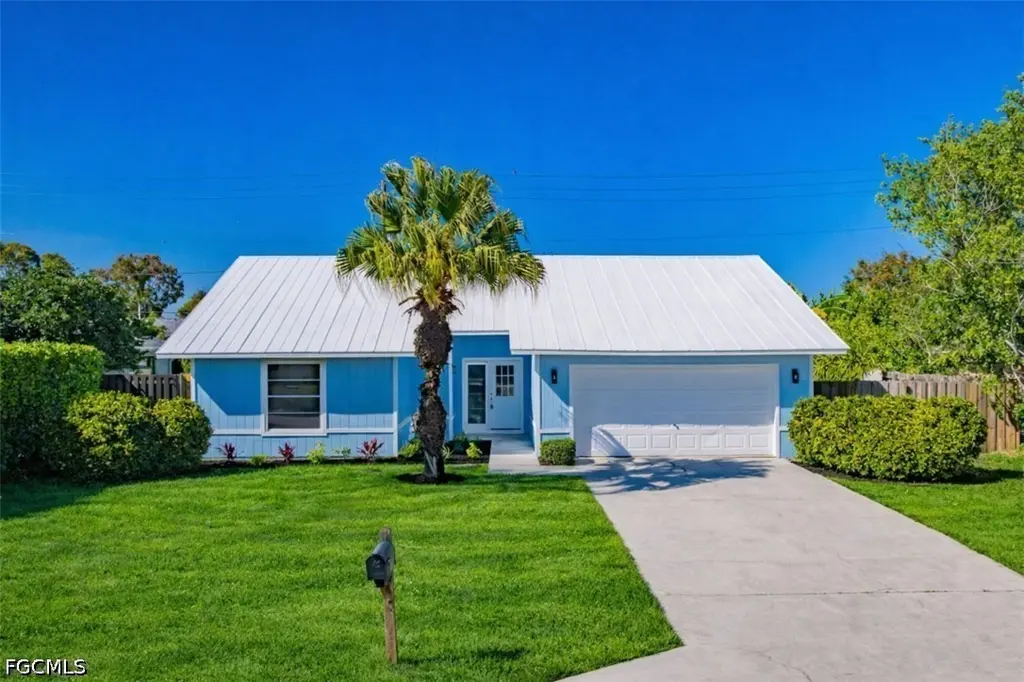
Exceptionally renovated Naples residence with NO HOA — minutes from Gulf beaches, Waterside Shops, scenic marinas, and premier golf courses. This move-in-ready home features a newer metal roof, brand-new A/C, luxury vinyl flooring, and soaring vaulted ceilings with designer accent walls and large windows. A two-car garage adds convenience and storage. The chef-inspired kitchen showcases bay windows, stainless appliances, a quartz waterfall countertop, and full-height designer backsplash. The primary suite offers a walk-in closet and spa-like en-suite with a beautifully tiled walk-in shower and modern fixtures. A newly screened Florida room overlooks a private, fully fenced backyard fr
Key facts
- Large windows
- Brand-new a/c
- Newer metal roof
Tags
Property features AI
Finance
- Financial info: Pets allowed
- HOA & community: Non-gated community; No association fee
Exterior
- Parking: Attached 2-space garage; 2 covered parking spaces
- Utilities: Public water; Public sewer; Cable available
- Home design: Single-story; Entry on level 1; Faces south; Resale property
- Construction: Block and concrete construction with vinyl siding; Metal roof
- Exterior features: Fenced yard; Lanai; Screened porch; Porch; Rectangular lot; Paved road access; North exposure
Interior
- Kitchen: Range; Microwave; Dishwasher; Refrigerator
- Flooring: Vinyl
- Bathrooms: 2 full bathrooms
- Heating & cooling: Central electric heating; Central electric air conditioning
- Interior features: Vaulted ceilings; Dual sinks; Combined living and dining area; Single-hung windows; Unfurnished
- Laundry & utility: Washer; Dryer
Neighborhood map
What this means for you Summary
Snapshot
- This is a 3-bed/2.0-bath single-family listed at $600k.
Deal economics
- At list price, monthly cash flow is $2k ($26k/yr) — positive.
- The deal already cash-flows at list — no discount required.
- Meets the 1% rule at list price ($8k rent vs $600k).
- Recommended offer: $582k (3.0% below list) — sets the bar for market timing.
Location & tenants
- Location reads 80/100 on livability (#126 in FL, #1,903 nationally) — a professional / high-income tenant draw. Strengths: crime A+, amenities A+, employment A+; Watch: commute D+, cost of living F.
- Collier (suburban): math 60% / reading 56% proficiency, ranked #16 of 73 in FL (top 22%) — acceptable for families but not a draw, mixed tenant base, ~2y average lease.
- Market conditions: Rents rising fast (+14.6%/yr); 479 active listings in the ZIP; 40 comparable units currently listed for rent nearby; rentals at typical pace (median 24d on market — plan ~3-4 weeks tenant-placement turnaround); high-income renter base; 3,520 units permitted in Collier County in 2024 (959 in 5+ unit buildings).
- At $7,691/mo this rent would consume 79% of the median local household income ($117k/yr) (locally 311% of renters already pay >50% of income on rent) — very limited rent-growth headroom before tenants either downsize or default.
Forward outlook
- Local home prices are declining (-3.0%/yr); year-one equity from $4k of loan paydown is wiped out by about $18k of value loss. Plan a longer hold.
- Collier County population projected at +30% by 2050 — long-run rental-demand tailwind backs the buy-and-hold thesis.
- At projected returns (-3.0% appreciation + 8.0% rent growth), your $168k cash investment doubles in ~6 years — after that, you're playing with house money.
Negotiation context
- It's been on market 33 days — a 3% lower offer ($582k) is reasonable based on typical stale-listing flexibility.
- 2 sale attempts with the ask held roughly flat each time — persistent listings suggest the price (not the market) is what's stuck; bring a comps-based counter.
- Current owner paid $368k; list at $600k implies a 63% gain — meaningful room to come down on a strong offer.
Risks & watch-outs
- Watch-outs: flood insurance adds $152/mo.
- Climate carrying-cost: in FEMA flood zone AH (mandatory federal flood insurance); severe wind risk, 99% chance of damaging wind over 30y; extreme-heat days projected 7→28/yr by 2055 (HVAC capex compounding) — expect insurance premiums to compound above CPI over the hold.
Questions for the listing agent
- It's been on market 33 days. Have you received any prior offers? Is the seller open to a 3% concession, seller financing, or rate buy-down credit?
- What's the actual annual flood-insurance premium (NFIP or private), and is the property in a SFHA with mandatory coverage?
- Is there a deadline driving the sale (1031 exchange, divorce, estate, relocation)? That informs how much negotiation room exists.
- Schools are B-rated — typically a magnet for longer-tenancy family renters. What's the average tenant stay here, and is there a school-zone premium baked into asking?
- What's the average days-on-market for RENTAL listings here right now (not sales)? A rising rental-DOM trend means longer vacancies and softer asking-rent achievability than the comps imply.
- What's the recent tenant-quality profile in this submarket — average credit score on applications, eviction rate, late-payment / NSF rate, and stable-employment percentage? A property-management company in the area should have these aggregated.
- How much new for-sale + rental construction is in the pipeline within 1–3 miles? Heavy new supply typically softens prices + rents 12–24 months out; constrained supply supports both.
Investment metrics
- 1% rule
- 1.28% ✓
- Cap rate
- 10.88%
- Cash-on-cash
- 16.39%
- DSCR
- 1.73
- GRM
- 6.5
CMA / ARV
- ARV (on-the-fly)
- $808,207
- Comps found
- 1
Show comp detail 1 sale within ~0.75 mi
| Address | Dist | Beds/Ba | Sqft | Sold | Price | $/sf | Match |
|---|---|---|---|---|---|---|---|
| 1523 Happolo Ln | 0.64mi | 3/2.0 | 1,571 (+8%) | 15mo | $875,000 | $557 | 44 |
Match score weights: distance 35% · size 25% · config 20% · recency 20%. Top-matched comps best support the ARV.
Projected returns pro-forma
-3.0% appreciation · 8.0% rent growth · sell at horizon
- IRR
- 11.3%
- Equity multiple
- 1.48×
- Total profit
- $79,852
- Equity at exit
- $89,460
- IRR
- 24.0%
- Equity multiple
- 3.56×
- Total profit
- $430,170
- Equity at exit
- $51,876
Cash invested: $167,997 (down + closing). Projections, not guarantees.
Landlord ↔ Tenant lean methodology
- Overall (STATE)
- 87 Strongly Landlord-Friendly
- State Florida
- 87 Strongly Landlord-Friendly · R+3
- County
- — inherits STATE
- City
- — inherits STATE
ZIP-level market 34103
- Rents YoY
- 14.6%
- Active inventory
- 479
- Price-to-rent
- 6.5×
Monthly cashflow live
- Estimated rent
- $7,691 high interval (Pro) →
- Mortgage (P&I)
- −$3,146
- Tax from tax record
- −$385 /mo · $4,625/yr
- Insurance
- −$250
- Flood insurance flood zone
- −$152 /mo · $1,824/yr
- HOA
- −$0
- Vacancy / Maint / Mgmt
- −$1,615
- Net cashflow
- $2,142
Break-even live
UW: 25.0% down · 7.5% · 30yr · 1.5% tax · 5.0% vac · 8.0% maint · 8.0% mgmt
Financing live
Cash to close
- Down payment
- $149,998
- Closing costs
- $18,000
- Reserves months
- —
- Total cash needed
- —
Loan-product check · same deal, 3 products live
Conventional
25% down · 7.5% · 30yr
- Down + closing
- —
- Monthly P&I
- —
- Monthly cashflow
- —
- DSCR
- —
- Eligible?
- —
Personal DTI + credit; lowest rate.
DSCR
20% down · 8.5% · 30yr
- Down + closing
- —
- Monthly P&I
- —
- Monthly cashflow
- —
- DSCR
- —
- Eligible?
- —
No personal income docs; deal must DSCR.
Hard money
10% down · 12.0% · 12mo
- Down + closing
- —
- Monthly P&I
- —
- Monthly cashflow
- —
- DSCR
- —
- Eligible?
- —
Short-term bridge; refi at stabilization.
Rent comps 40 comps
| Address | Beds | Baths | Sqft | Rent | $/sqft | DOM | Units | Dist |
|---|---|---|---|---|---|---|---|---|
| 1400 Pompei Ln Naples, FL | 2.0 | 2.0 | 1012 | $1,888 | $1.86 | 23d | 2 | 0.10mi |
| 1400 Pompei Ln Unit S-21 Naples, FL | 2.0 | 2.0 | 1025 | $3,000 | $2.93 | 23d | 1 | 0.11mi |
| 1400 Pompei Ln Unit O-21 Naples, FL | 2.0 | 2.0 | 1025 | $2,200 | $2.15 | 23d | 1 | 0.11mi |
| 1265 Pompei Ln Naples, FL | 3.0 | 2.0 | 1650 | $3,495 | $2.12 | 13d | 1 | 0.19mi |
| 4525 Fluvia Ave Naples, FL | 2.0 | 1.0 | 1050 | $5,500 | $5.24 | 23d | 1 | 0.29mi |
| 4523 Fluvia Ave Naples, FL | 2.0 | 1.0 | 1050 | $5,500 | $5.24 | 23d | 1 | 0.29mi |
| 1082 Capri Dr Naples, FL | 3.0 | 2.0 | 1500 | $9,000 | $6.00 | 23d | 1 | 0.39mi |
| 1240 Shady Rest Ln #102 Naples, FL | 3.0 | 2.0 | 1619 | $6,000 | $3.71 | 13d | 1 | 0.56mi |
| 5934 Premier Way Naples, FL | 1.0–3.0 | 1.0–3.0 | 1350 | $4,882 | $3.62 | 13d | 29 | 0.58mi |
| 4300 Belair Ln Naples, FL | 2.0 | 2.0 | 1200 | $6,750 | $5.62 | 13d | 2 | 0.70mi |
| 1614 Forest Lakes Blvd Naples, FL | 3.0 | 2.0 | 1869 | $10,000 | $5.35 | 23d | 1 | 0.70mi |
| 4200 Belair Ln Naples, FL | 2.0–3.0 | 2.0 | 1406 | $9,000 | $6.40 | 23d | 5 | 0.72mi |
| 1719 Camelia Ln Naples, FL | 3.0 | 2.0 | 1534 | $3,900 | $2.54 | 23d | 1 | 0.73mi |
| 1085 Forest Lakes Dr Unit 8202 Naples, FL | 2.0 | 2.0 | 1086 | $2,800 | $2.58 | 13d | 1 | 0.74mi |
| 1085 Forest Lakes Dr Unit 8106 Naples, FL | 2.0 | 2.0 | 1000 | $1,900 | $1.90 | 13d | 1 | 0.74mi |
| 1086 Forest Lakes Dr Unit 9303 Naples, FL | 2.0 | 2.0 | 1000 | $2,395 | $2.40 | 13d | 1 | 0.77mi |
| 4092 Belair Ln #15 Naples, FL | 3.0 | 3.0 | 1500 | $6,200 | $4.13 | 23d | 1 | 0.82mi |
| 4082 Belair Ln #11 Naples, FL | 3.0 | 2.0 | 1600 | $6,000 | $3.75 | 23d | 1 | 0.84mi |
| 287 Quail Forest Blvd #117 Naples, FL | 2.0 | 2.0 | 993 | $1,695 | $1.71 | 13d | 1 | 0.84mi |
| 287 Quail Forest Blvd #117 Naples, FL | 2.0 | 2.0 | 993 | $1,995 | $2.01 | 21d | 1 | 0.84mi |
| 260 Quail Forest Blvd Naples, FL | 1.0–2.0 | 1.0–2.0 | 875 | $2,533 | $2.89 | 13d | 22 | 0.89mi |
| 4180 Crayton Rd Unit E7 Naples, FL | 3.0 | 2.0 | 1600 | $8,900 | $5.56 | 23d | 1 | 0.95mi |
| 3930 Belair Ln Naples, FL | 2.0 | 2.0 | 1300 | $6,000 | $4.62 | 23d | 1 | 0.96mi |
| 6453 Autumn Woods Blvd Naples, FL | 3.0 | 2.0 | 1729 | $9,500 | $5.49 | 21d | 1 | 0.96mi |
| 723 Willowhead Dr Naples, FL | 3.0 | 3.0 | 1776 | $18,000 | $10.14 | 23d | 1 | 0.99mi |
| 555 Park Shore Dr Unit B410 Naples, FL | 2.0 | 2.0 | 1200 | $6,000 | $5.00 | 21d | 1 | 1.04mi |
| 1097 Frank Whiteman Blvd Naples, FL | 4.0 | 3.0 | 1590 | $10,900 | $6.86 | 23d | 1 | 1.05mi |
| 1044 Woodshire Ln Unit B212 Naples, FL | 3.0 | 2.0 | 1250 | $8,000 | $6.40 | 23d | 1 | 1.10mi |
| 611 Serendipity Dr #611 Naples, FL | 2.0 | 2.0 | 1300 | $10,000 | $7.69 | 21d | 1 | 1.11mi |
| 563 Serendipity Dr #563 Naples, FL | 2.0 | 2.0 | 1545 | $8,000 | $5.18 | 23d | 1 | 1.13mi |
| 355 Park Shore Dr Unit 1-114 Naples, FL | 2.0 | 2.0 | 1574 | $13,000 | $8.26 | 23d | 1 | 1.13mi |
| 595 Serendipity Dr #595 Naples, FL | 3.0 | 2.0 | 1395 | $10,000 | $7.17 | 23d | 1 | 1.14mi |
| 5637 Turtle Bay Dr Unit II-22 Naples, FL | 3.0 | 2.0 | 1506 | $10,000 | $6.64 | 13d | 1 | 1.15mi |
| 499 Forest Lakes Blvd #105 Naples, FL | 2.0 | 2.0 | 919 | $1,950 | $2.12 | 13d | 1 | 1.17mi |
| 5633 Turtle Bay Dr #37 Naples, FL | 2.0 | 2.0 | 1423 | $8,500 | $5.97 | 23d | 1 | 1.17mi |
| 788 Park Shore Dr Naples, FL | 1.0–2.0 | 1.5–2.0 | 931 | $5,500 | $5.90 | 13d | 3 | 1.18mi |
| 5635 Turtle Bay Dr #6 Naples, FL | 3.0 | 2.0 | 1713 | $8,500 | $4.96 | 13d | 1 | 1.18mi |
| 5501 Heron Point Dr #201 Naples, FL | 2.0 | 2.0 | 1230 | $12,000 | $9.76 | 21d | 1 | 1.18mi |
| 5501 Heron Point Dr #204 Naples, FL | 2.0 | 2.0 | 1230 | $10,000 | $8.13 | 23d | 1 | 1.18mi |
| 5501 Heron Point Dr #702 Naples, FL | 2.0 | 2.0 | 1155 | $11,000 | $9.52 | 23d | 1 | 1.18mi |
Listing history 7 events
-
2026-05-13price $599,990
-
2026-04-23$609,990 Active
-
2026-04-21historical
-
2026-04-07price $629,000
-
2026-03-25$629,990 Active
-
2025-10-20soldstatus $367,500
-
1996-02-15soldstatus $110,000
ⓘ Source: listings_history table (triggers on properties + properties_extension) + one-shot
backfill from property_details.listing_events for pre-trigger history.
Tax reassessment forecast FL · Resets to sale price
- Current annual tax
- $4,625 · $385/mo
- Projected year-2 tax
- $4,980 · $415/mo
- Expected delta
- +$355/yr (+$30/mo · 7.7%)
ⓘ Screening estimate from a state-policy table — verify with the county assessor before closing.
Climate risk First Street
- Flood 5/10 Major FEMA zone AH · 24% chance over 30 yrs
- Wildfire 1/10 Low
- Heat 10/10 Extreme 7 d/yr ≥107°F today · 28 d/yr by 30 yrs out
- Wind 10/10 Extreme 99% chance of damaging wind over 30 yrs
- Air quality 2/10 Low 2 unhealthy d/yr today · 2 by 30 yrs out
Nearby sold comps map
Loading sold comps map…
Walkable amenities ~0.75 mi
Loading nearby amenities…
Taxation est. · year 1
- Rental income
- $92,297
- − Mortgage interest
- −$33,609
- − Property taxes
- −$4,625
- − Insurance
- −$4,824
- − Repairs & maintenance
- −$7,384
- − Management
- −$7,384
- − Depreciation
- −$17,454
- Taxable income
- $17,016
- Est. tax owed @ 24.0%
- −$4,084
- After-tax cash flow
- $21,624/yr
For passive investors: Depreciation is non-cash, so a rental often shows a tax loss while cash-flowing — sheltering income. Rental losses are passive: they offset passive income freely, and up to $25,000/yr can offset ordinary (W-2) income if you actively participate and your MAGI is under $100k (phasing out to $0 by $150k); unused losses carry forward. On sale, claimed depreciation is recaptured at up to 25%, and gains may owe capital-gains tax (a 1031 exchange can defer both). Figures are a year-1 estimate at your 24.0% rate — not tax advice; consult a CPA.
Schools (NCES district)
- District
- Collier
- NCES district ID
- 1200330
- Math proficiency
- 60% ▼ -4.00%
- Reading proficiency
- 56% ▼ -2.00%
- Median HH income
- $58,275
- Composite
- 50.23/100
- National rank
- #1892
- State rank
- #16 of 73 in FL
Livability — Naples
- Score
- 80/100
- State rank
- #126
- US rank
- #1903
Category grades
Schools grade is shown separately in the Schools card above.
Census & demographics
- County
- Collier County · 396,295 people
- City population
- 344,941
- Metro
- Naples-Marco Island, FL
- Population (ZIP)
- 11,299
- Household income
- $116,875
- Rent vs Own
- Severe rent burden
- 311.0
Population outlook (Collier County) Hauer SSP2
- Today (2025)
- 420,858 people
- By 2030
- 450,054 · +6.9%
- By 2040
- 502,232 · +19.3%
- By 2050
- 544,932 · +29.5%
- By 2075
- 627,203 · +49.0%
- By 2100
- 659,015 · +56.6%
Race, ethnicity, and origin ACS 2023
- Neighborhood character
- Predominantly White (87%)
- Race & ethnicity
- White 87% Hispanic / Latino 10% Two or more races 8% Asian 1%
- Hispanic origin (detail)
- Common ancestry
- Romanian 4% Lithuanian 2% Portuguese 2%
- Foreign-born
- 13% · Canada
- Languages at home
- 87% English-only · Spanish 9% Other Indo-European 2% German/W. Germanic 1%
Political lean MEDSL · Collier
- 2024 margin
- Solid R (+33.1) · D 33.1% · R 66.2%
- 2008→2024 swing
- -10.6pp toward R · 2008: -22.5pp · 2024: -33.1pp
- All cycles
- 2024: R+33.1 2020: R+24.7 2016: R+26.0 2012: R+30.1 2008: R+22.5
Not yet ingested
- Civics
- —
Market trends
- HPI YoY
- ▼ -327.53%
- Current HPI
- 315.1396
- Rent YoY
- ▲ 14.55%
- Metro
- Naples-Marco Island, FL
- State GDP YoY
- ▲ 3.28%
- F500 in state
- 36
Industry mix (Fortune 500 HQ in FL)
| Industry | F500 HQs | Revenue |
|---|---|---|
| Industrial Technology | 2 | $29B |
|
||
| Insurance | 2 | $17B |
|
||
| Retail | 1 | $60B |
|
||
| Technology Distribution | 1 | $58B |
|
||
| Homebuilding | 1 | $35B |
|
||
| Technology Manufacturing | 1 | $35B |
|
||
Price history
+445.4% since first listed7 events — show timeline
- 2026-05-13 Price Changed $599,990 FORTMLS
- 2026-04-23 Listed $609,990 FORTMLS
- 2026-04-21 Listing Removed — NAPLESMLS
- 2026-04-07 Price Changed $629,000 NAPLESMLS
- 2026-03-25 Listed $629,990 NAPLESMLS
- 2025-10-20 Sold (Public Records) $367,500 Public Records
- 1996-02-15 Sold (Public Records) $110,000 Public Records
Property tax history
+10.0%/yrLatest (2025): $4,625 · +2.4% YoY. Source: county tax records.
Cash-flow waterfall
monthlySold comps — $/sqft
last 12 mo · ≤1 miLoading sold comps…