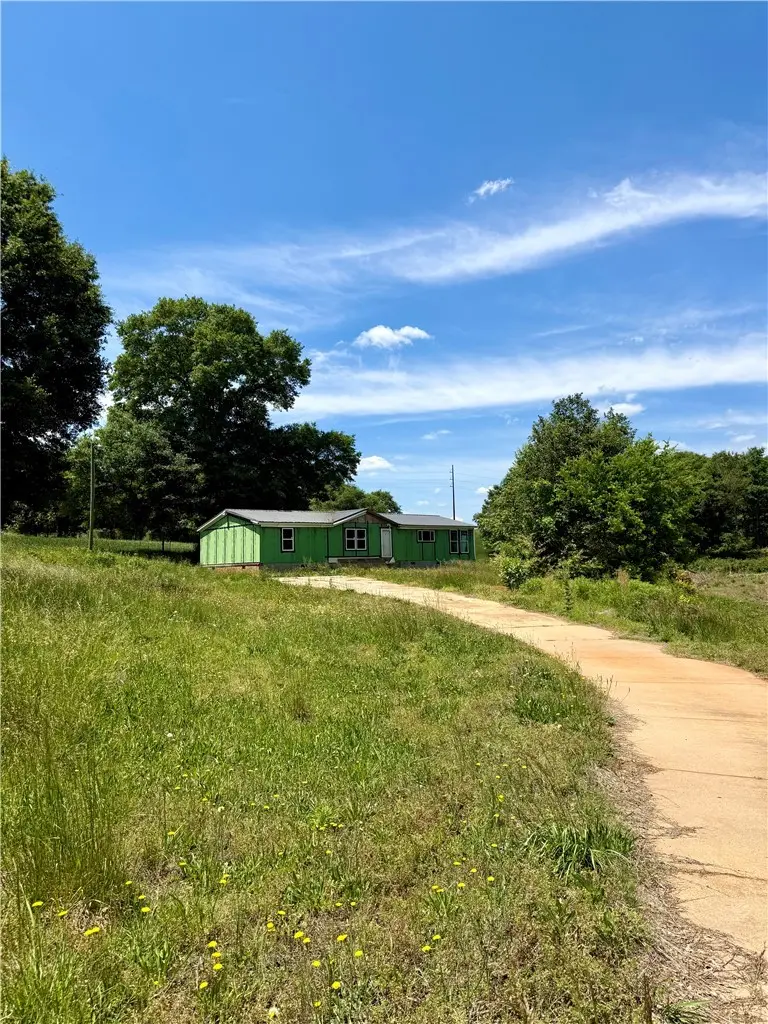
464 Earls Mill Rd · Fair Play, SC
Flood risk 1/10 · Minimal
- FEMA flood zone
- X (unshaded)
- Chance of flooding over 30 yrs
- 0.0%
- Est. flood insurance / yr
- $507 – $1,088
Fire risk 5/10 · Moderate
- Est. fire insurance / yr
- $783 – $1,453
Heat risk 5/10 · Moderate
- Hot days now (above 105°F)
- 7 days/yr
- Hot days in 30 yrs
- 17 days/yr
Wind risk 2/10 · Minimal
- Chance of severe wind over 30 yrs
- 3.0%
Air-quality risk 4/10 · Minor
- Unhealthy air days now
- 5 days/yr
- Unhealthy air days in 30 yrs
- 5 days/yr
Risk factors via First Street. Map © Google.
Why this score? — see what drove the C+ grade
The composite is a weighted blend of 9 inputs, each scored 0–100. Each bar is that input's sub-score; the figure is the points it added to the 100-point composite (weight × sub-score).
- Cash flow +24.8/30.0
- DSCR +8.0/10.0
- ARV discount +7.5/15.0
- 1% rule +6.4/10.0
- Rent growth +4.4/5.0
- Schools +3.7/10.0
- Livability +3.1/5.0
- Condition / age +2.5/5.0
- Appreciation +0.0/10.0
$150,000
🖨 Deal sheet (PDF) 📄 Offer letter ✓ Due diligence
Listing remarks
If you are looking for an investment property take a look at this as the owner is willing to finance! This home is not finished and may not quailify for financing. The previous owner started on this renovation and is waiting on you to finish this up for a great investment or can be a beautiful homesite. Previous renovations per the owner are a metal roof, new sub flooring, new windows, insulation and some electrical. Per the county the property can be divided once so you could finish this home out, sell it and have another beautiful lot to build a home on as well. This is being sold "as is", "where is", with the seller making no repairs warranties or guarantee.
Key facts
- Insulation
- Metal roof
- Some electrical
Tags
Property features AI
Exterior
- Utilities: Septic tank
- Home design: Single-story double wide mobile home; Metal roof
- Construction: Built 21–30 years ago; Crawlspace foundation
- Exterior features: Not in a subdivision; Outside city limits; Horses allowed
Interior
- Bedrooms: 3 main-level bedrooms
- Bathrooms: 2 full bathrooms (2 on the main level)
- Heating & cooling: Heat pump heating; Central air and forced air cooling
- Interior features: Crawl space basement
Neighborhood map
What this means for you Summary
Snapshot
- This is a 3-bed/2.0-bath manufactured listed at $150k.
Deal economics
- At list price, monthly cash flow is $317 ($4k/yr) — positive.
- The deal already cash-flows at list — no discount required.
- Meets the 1% rule at list price ($2k rent vs $150k).
Location & tenants
- Location reads 62/100 on livability (#185 in SC) — a middle-class / working-renter tenant base. Strengths: housing A+, crime A, employment B; Watch: cost of living D+, amenities F, commute F.
- Oconee 01 (rural): math 41% / reading 47% proficiency, ranked #27 of 80 in SC (top 34%) — families likely to look elsewhere, expect single-tenant / working-renter base with shorter leases.
- Zoned schools: Fair-Oak Elementary (math 49% / reading 46%, grade D, #199 of 597 statewide, top 35%, 586 students, 78% FRL); West Oak Middle (math 30% / reading 38%, grade F, #110 of 229 statewide, top 49%, 697 students, 86% FRL); West-Oak High (math 47% / reading 80%, grade B-, #95 of 196 statewide, top 49%, 813 students, 75% FRL) — zoned schools average 79% FRL vs 50% district-wide (29 pts higher); higher-poverty schools than district average — tighter screening recommended.
- Market conditions: Rents rising fast (+7.7%/yr); 370 active listings in the ZIP; 648 units permitted in Oconee County in 2024 (40 in 5+ unit buildings).
- This rent runs 39% of the median local income ($53k/yr) — at the standard rent-burdened threshold; future hikes will face affordability resistance.
Forward outlook
- Local home prices are declining (-3.0%/yr); year-one equity from $1k of loan paydown is wiped out by about $4k of value loss. Plan a longer hold.
- At projected returns (-3.0% appreciation + 7.7% rent growth), your $42k cash investment doubles in ~8 years — after that, you're playing with house money.
Negotiation context
- Only 7 days on market — expect competitive offers; lowballing is unlikely to land.
Risks & watch-outs
- Climate carrying-cost: moderate wildfire risk; extreme-heat days projected 7→17/yr by 2055 (HVAC capex compounding) — expect insurance premiums to compound above CPI over the hold.
Questions for the listing agent
- Is there a deadline driving the sale (1031 exchange, divorce, estate, relocation)? That informs how much negotiation room exists.
- Schools are F-rated, which usually means shorter tenancies and higher turnover. Who's the typical renter profile here, and what's been the actual vacancy rate?
- What's the average days-on-market for RENTAL listings here right now (not sales)? A rising rental-DOM trend means longer vacancies and softer asking-rent achievability than the comps imply.
- What's the recent tenant-quality profile in this submarket — average credit score on applications, eviction rate, late-payment / NSF rate, and stable-employment percentage? A property-management company in the area should have these aggregated.
- How much new for-sale + rental construction is in the pipeline within 1–3 miles? Heavy new supply typically softens prices + rents 12–24 months out; constrained supply supports both.
Investment metrics
- 1% rule
- 1.14% ✓
- Cap rate
- 8.83%
- Cash-on-cash
- 9.05%
- DSCR
- 1.40
- GRM
- 7.3
CMA / ARV
No comps found within radius.
Projected returns pro-forma
-3.0% appreciation · 7.71% rent growth · sell at horizon
- IRR
- 2.6%
- Equity multiple
- 1.10×
- Total profit
- $4,396
- Equity at exit
- $22,365
- IRR
- 16.3%
- Equity multiple
- 2.63×
- Total profit
- $68,378
- Equity at exit
- $12,969
Cash invested: $42,000 (down + closing). Projections, not guarantees.
Landlord ↔ Tenant lean methodology
- Overall (STATE)
- 90 Strongly Landlord-Friendly
- State South Carolina
- 90 Strongly Landlord-Friendly · R+6
- County
- — inherits STATE
- City
- — inherits STATE
ZIP-level market 29678
- Home prices YoY
- -32.5%
- Rents YoY
- 7.7%
- Active inventory
- 370
- Price-to-rent
- 7.3×
Monthly cashflow live
- Estimated rent
- $1,713 medium interval (Pro) →
- Mortgage (P&I)
- −$787
- Tax est. 1.5%
- −$188 /mo · $2,250/yr
- Insurance
- −$62
- HOA
- −$0
- Vacancy / Maint / Mgmt
- −$360
- Net cashflow
- $317
Break-even live
Sensitivity live
| Price | -10% $420 | -5% $369 | +0% $317 | +5% $265 | +10% $213 |
|---|---|---|---|---|---|
| Rent | -10% $181 | -5% $249 | +0% $317 | +5% $384 | +10% $452 |
| Rate | -1.0pp $392 | -0.5pp $355 | base $317 | +0.5pp $278 | +1.0pp $238 |
UW: 25.0% down · 7.5% · 30yr · 1.5% tax · 5.0% vac · 8.0% maint · 8.0% mgmt
Financing live
Cash to close
- Down payment
- $37,500
- Closing costs
- $4,500
- Reserves months
- —
- Total cash needed
- —
Loan-product check · same deal, 3 products live
Conventional
25% down · 7.5% · 30yr
- Down + closing
- —
- Monthly P&I
- —
- Monthly cashflow
- —
- DSCR
- —
- Eligible?
- —
Personal DTI + credit; lowest rate.
DSCR
20% down · 8.5% · 30yr
- Down + closing
- —
- Monthly P&I
- —
- Monthly cashflow
- —
- DSCR
- —
- Eligible?
- —
No personal income docs; deal must DSCR.
Hard money
10% down · 12.0% · 12mo
- Down + closing
- —
- Monthly P&I
- —
- Monthly cashflow
- —
- DSCR
- —
- Eligible?
- —
Short-term bridge; refi at stabilization.
Listing history 2 events
-
2026-05-14status Pending
-
2026-05-07$150,000 Active
ⓘ Source: listings_history table (triggers on properties + properties_extension) + one-shot
backfill from property_details.listing_events for pre-trigger history.
Climate risk First Street
- Flood 1/10 Low FEMA zone X (unshaded) · 0% chance over 30 yrs
- Wildfire 5/10 Major
- Heat 5/10 Major 7 d/yr ≥105°F today · 17 d/yr by 30 yrs out
- Wind 2/10 Low 3% chance of damaging wind over 30 yrs
- Air quality 4/10 Moderate 5 unhealthy d/yr today · 5 by 30 yrs out
Nearby sold comps map
Loading sold comps map…
Walkable amenities ~0.75 mi
Loading nearby amenities…
Taxation est. · year 1
- Rental income
- $20,557
- − Mortgage interest
- −$8,402
- − Property taxes
- −$2,250
- − Insurance
- −$750
- − Repairs & maintenance
- −$1,645
- − Management
- −$1,645
- − Depreciation
- −$4,364
- Taxable income
- $1,502
- Est. tax owed @ 24.0%
- −$360
- After-tax cash flow
- $3,440/yr
For passive investors: Depreciation is non-cash, so a rental often shows a tax loss while cash-flowing — sheltering income. Rental losses are passive: they offset passive income freely, and up to $25,000/yr can offset ordinary (W-2) income if you actively participate and your MAGI is under $100k (phasing out to $0 by $150k); unused losses carry forward. On sale, claimed depreciation is recaptured at up to 25%, and gains may owe capital-gains tax (a 1031 exchange can defer both). Figures are a year-1 estimate at your 24.0% rate — not tax advice; consult a CPA.
Schools (NCES district)
- District
- Oconee 01
- NCES district ID
- 4503060
- Math proficiency
- 41% ▼ -7.00%
- Reading proficiency
- 47% ▼ -1.00%
- Median HH income
- $42,074
- Composite
- 37.03/100
- National rank
- #4516
- State rank
- #27 of 80 in SC
Livability — Fair Play
- Score
- 62/100
- State rank
- #185
- US rank
- #16124
Category grades
Schools grade is shown separately in the Schools card above.
Census & demographics
- County
- Oconee County · 36,517 people
- City population
- 2,887
- Metro
- Seneca, SC
- Population (ZIP)
- 23,767
- Household income
- $52,550
- Rent vs Own
- Severe rent burden
- 822.0
Population outlook (Oconee County) Hauer SSP2
- Today (2025)
- 77,950 people
- By 2030
- 78,551 · +0.8%
- By 2040
- 78,628 · +0.9%
- By 2050
- 77,052 · -1.2%
- By 2075
- 71,098 · -8.8%
- By 2100
- 61,216 · -21.5%
Race, ethnicity, and origin ACS 2023
- Neighborhood character
- Predominantly White (74%)
- Race & ethnicity
- White 74% Black 18% Two or more races 5% Hispanic / Latino 4%
- Common ancestry
- Slovak 2% Lithuanian 2% Italian 2%
- Foreign-born
- 2% · Canada, United Kingdom
- Languages at home
- 97% English-only · Spanish 1% French/Haitian/Cajun 1%
Political lean MEDSL · Oconee
- 2024 margin
- Solid R (+51.5) · D 23.6% · R 75.2% · Other 1.2%
- 2008→2024 swing
- -14.0pp toward R · 2008: -37.5pp · 2024: -51.5pp
- All cycles
- 2024: R+51.5 2020: R+47.4 2016: R+48.1 2012: R+42.6 2008: R+37.5
Not yet ingested
- Civics
- —
Market trends
- HPI YoY
- ▼ -91.37%
- Current HPI
- 189.6751
- Rent YoY
- ▲ 7.71%
- Metro
- Seneca, SC
- State GDP YoY
- ▲ 4.51%
- F500 in state
- 2
Industry mix (Fortune 500 HQ in SC)
| Industry | F500 HQs | Revenue |
|---|---|---|
| Packaging | 1 | $7B |
|
||
Price history
2 events — show timeline
- 2026-05-14 Pending — WUMLS
- 2026-05-07 Listed $150,000 WUMLS
Property tax history
+11.4%/yrLatest (2018): $173 · +111.5% YoY. Source: county tax records.
Cash-flow waterfall
monthlySold comps — $/sqft
last 12 mo · ≤1 miLoading sold comps…