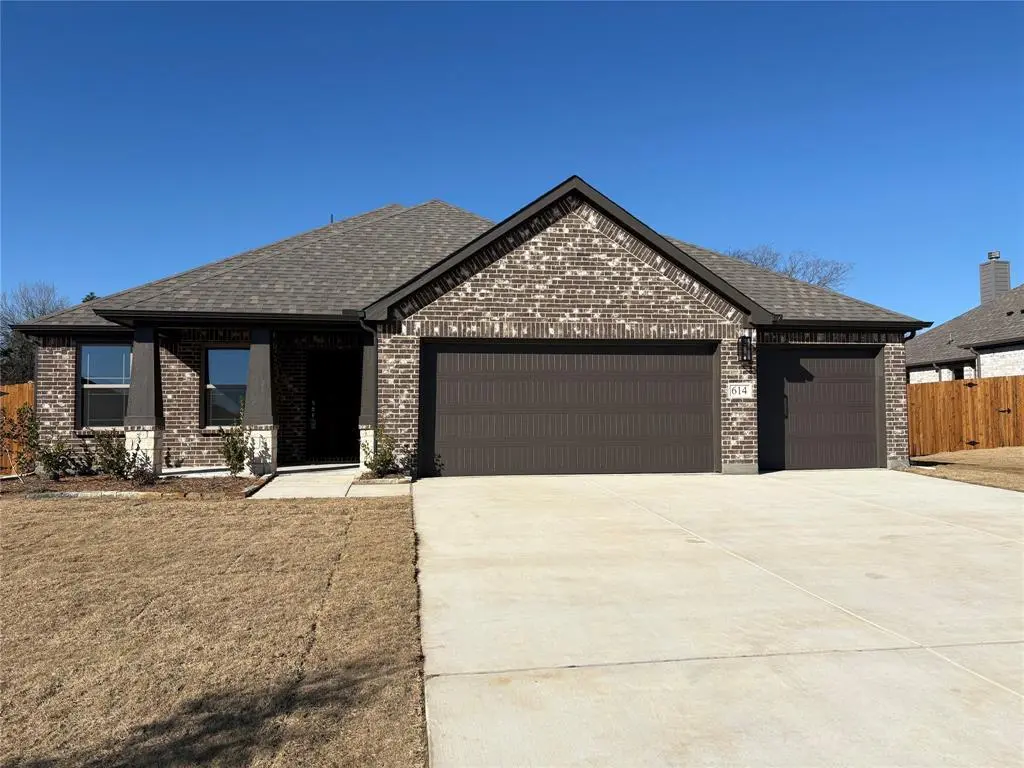
614 Kyle Dr · Tioga, TX
Flood risk 3/10 · Minor
- FEMA flood zone
- X (unshaded)
- Chance of flooding over 30 yrs
- 0.2%
- Est. flood insurance / yr
- $507 – $1,088
Fire risk 6/10 · Moderate
- Est. fire insurance / yr
- $1,222 – $2,270
Heat risk 7/10 · Major
- Hot days now (above 109°F)
- 7 days/yr
- Hot days in 30 yrs
- 22 days/yr
Wind risk 5/10 · Moderate
- Chance of severe wind over 30 yrs
- 26.0%
Air-quality risk 3/10 · Minor
- Unhealthy air days now
- 3 days/yr
- Unhealthy air days in 30 yrs
- 4 days/yr
Risk factors via First Street. Map © Google.
Why this score? — see what drove the D- grade
The composite is a weighted blend of 9 inputs, each scored 0–100. Each bar is that input's sub-score; the figure is the points it added to the 100-point composite (weight × sub-score).
- Appreciation +8.7/10.0
- ARV discount +7.3/15.0
- Cash flow +6.8/30.0
- Schools +4.0/10.0
- Livability +3.3/5.0
- Rent growth +2.5/5.0
- Condition / age +2.5/5.0
- 1% rule +1.8/10.0
- DSCR +1.0/10.0
$395,000
🖨 Deal sheet (PDF) 📄 Offer letter ✓ Due diligence
Listing remarks MLS
Step into a home that blends comfort, style, and smart design. The flexible front room can be configured as a private study instead of formal dining, giving you the perfect space to work, create, or unwind. Warm evenings are better by the stone-to-mantle fireplace, while the extended covered patio invites year-round outdoor living. The kitchen is truly the heart of this home, featuring upgraded built-in appliances, gleaming quartz countertops, and rich wood-look tile that flows through the main living areas. Need room for toys or tools? The optional 3-car garagedelivers the extra space you’ve been looking for. Every detail has been chosen to offer both beauty and function—this is a home you’ll love coming back to.
Key facts
- Flexible front room
- Quartz countertops
- Rich wood-look tile
Tags
Neighborhood map
What this means for you Summary
Snapshot
- This is a 3-bed/2.0-bath single-family listed at $395k.
Deal economics
- At list price, monthly cash flow is $-622 ($-7k/yr) — negative.
- To cash-flow at today's rent, offer at most $305k (22.8% below list).
- To meet the 1% rule (rent ≥ 1% of price), the offer needs to be $270k (31.6% below list).
- Recommended offer: $270k (31.6% below list) — sets the bar for 1% rule.
Location & tenants
- Location reads 66/100 on livability (#656 in TX) — a middle-class / working-renter tenant base. Strengths: crime A+, cost of living A+, housing A+; Watch: amenities F, commute F, health & safety F.
- Tioga ISD (rural): math 44% / reading 50% proficiency, ranked #226 of 826 in TX (top 27%) — families likely to look elsewhere, expect single-tenant / working-renter base with shorter leases.
- Market conditions: 85 active listings in the ZIP; 1 comparable units currently listed for rent nearby; 2,272 units permitted in Grayson County in 2024 (750 in 5+ unit buildings).
Forward outlook
- In year one you build about $32k of equity ($3k loan paydown + $30k appreciation (7.5% local appreciation)).
- Grayson County population projected at +12% by 2050 — modest demand growth; plan on rents tracking national, not racing it.
- By year 2, paydown + projected appreciation supports a ~$52k cash-out refi (75% LTV) — recoverable capital for the next deal without selling this one.
Negotiation context
- It's been on market 138 days — a 12% lower offer ($348k) is reasonable based on typical stale-listing flexibility.
Risks & watch-outs
- Climate carrying-cost: moderate wind risk, 26% chance of damaging wind over 30y; major wildfire risk; extreme-heat days projected 7→22/yr by 2055 (HVAC capex compounding) — expect insurance premiums to compound above CPI over the hold.
Questions for the listing agent
- What do current leases actually rent for vs. the listed asking? Can we see a recent rent roll and the last 12 months of T-12 income?
- It's been on market 138 days. Have you received any prior offers? Is the seller open to a 32% concession, seller financing, or rate buy-down credit?
- What does the HOA fee cover, when was the last increase, and are there any pending special assessments or reserve-fund shortfalls?
- Why hasn't it sold? Are there any deal-killer items the seller is aware of (foundation, flood, title, zoning, code violations)?
- Is there a deadline driving the sale (1031 exchange, divorce, estate, relocation)? That informs how much negotiation room exists.
- The area grade is low — what's the realistic commute time and amenity access for the typical tenant pool here? Any planned neighborhood developments (good or bad) we should know about?
- What's the average days-on-market for RENTAL listings here right now (not sales)? A rising rental-DOM trend means longer vacancies and softer asking-rent achievability than the comps imply.
- What's the recent tenant-quality profile in this submarket — average credit score on applications, eviction rate, late-payment / NSF rate, and stable-employment percentage? A property-management company in the area should have these aggregated.
- How much new for-sale + rental construction is in the pipeline within 1–3 miles? Heavy new supply typically softens prices + rents 12–24 months out; constrained supply supports both.
Investment metrics
- 1% rule
- 0.68% ✗
- Cap rate
- 4.40%
- Cash-on-cash
- -6.75%
- DSCR
- 0.70
- GRM
- 12.2
CMA / ARV
- ARV (median comp)
- $393,097
- List price
- $395,000
- Delta
- 0.48%
- Verdict
- FAIR
- Comps
- 20 within 1.0 mi
Show comp detail 12 sales within ~0.75 mi
| Address | Dist | Beds/Ba | Sqft | Sold | Price | $/sf | Match |
|---|---|---|---|---|---|---|---|
| 615 N Lamar St | 0.08mi | 3/2.0 | 1,740 (-0%) | 3mo | $400,000 | $230 | 94 |
| 1207 Mary Ann Ct | 0.37mi | 3/2.0 | 1,762 (+1%) | 2mo | $349,000 | $198 | 79 |
| 304 Bradley St | 0.34mi | 3/2.0 | 1,790 (+3%) | 2mo | $390,000 | $218 | 78 |
| 603 Mohawk Dr | 0.28mi | 3/2.0 | 1,674 (-4%) | 7mo | $445,000 | $266 | 74 |
| 713 Arapaho Dr | 0.38mi | 3/2.0 | 1,667 (-4%) | 2mo | $275,000 | $165 | 74 |
| 616 Kyle Dr | 0.02mi | 3/2.0 | 1,994 (+14%) | 2mo | $420,000 | $211 | 73 |
| 714 Mohawk Dr | 0.46mi | 3/2.0 | 1,712 (-2%) | 8mo | $439,900 | $257 | 69 |
| 404 N Florence St | 0.25mi | 3/2.0 | 1,535 (-12%) | 0mo | $342,500 | $223 | 68 |
| 504 N Texas St | 0.36mi | 2/1.0 (-1) | 1,661 (-5%) | 1mo | $525,000 | $316 | 66 |
| 1206 Cutler St | 0.45mi | 3/2.0 | 1,885 (+8%) | 6mo | $345,000 | $183 | 60 |
| 402 E Main St | 0.48mi | 3/2.5 | 1,529 (-12%) | 1mo | $299,999 | $196 | 54 |
| 1008 N Main St | 0.56mi | 3/2.0 | 1,605 (-8%) | 8mo | $349,900 | $218 | 54 |
Match score weights: distance 35% · size 25% · config 20% · recency 20%. Top-matched comps best support the ARV.
Projected returns pro-forma
7.47% appreciation · 3.0% rent growth · sell at horizon
- IRR
- 13.6%
- Equity multiple
- 1.99×
- Total profit
- $109,867
- Equity at exit
- $285,936
- IRR
- 13.8%
- Equity multiple
- 4.15×
- Total profit
- $348,275
- Equity at exit
- $554,587
Cash invested: $110,600 (down + closing). Projections, not guarantees.
Landlord ↔ Tenant lean methodology
- Overall (STATE)
- 87 Strongly Landlord-Friendly
- State Texas
- 87 Strongly Landlord-Friendly · R+5
- County
- — inherits STATE
- City
- — inherits STATE
ZIP-level market 76271
- Home prices YoY
- 2.6%
- Active inventory
- 85
- Price-to-rent
- 12.2×
Monthly cashflow live
- Estimated rent
- $2,700 medium interval (Pro) →
- Mortgage (P&I)
- −$2,071
- Tax est. 1.5%
- −$494 /mo · $5,925/yr
- Insurance
- −$165
- HOA
- −$25
- Vacancy / Maint / Mgmt
- −$567
- Net cashflow
- $-622
Break-even live
Sensitivity live
| Price | -10% $-349 | -5% $-485 | +0% $-622 | +5% $-758 | +10% $-895 |
|---|---|---|---|---|---|
| Rent | -10% $-835 | -5% $-728 | +0% $-622 | +5% $-515 | +10% $-408 |
| Rate | -1.0pp $-423 | -0.5pp $-521 | base $-622 | +0.5pp $-724 | +1.0pp $-828 |
UW: 25.0% down · 7.5% · 30yr · 1.5% tax · 5.0% vac · 8.0% maint · 8.0% mgmt
Financing live
Cash to close
- Down payment
- $98,750
- Closing costs
- $11,850
- Reserves months
- —
- Total cash needed
- —
Loan-product check · same deal, 3 products live
Conventional
25% down · 7.5% · 30yr
- Down + closing
- —
- Monthly P&I
- —
- Monthly cashflow
- —
- DSCR
- —
- Eligible?
- —
Personal DTI + credit; lowest rate.
DSCR
20% down · 8.5% · 30yr
- Down + closing
- —
- Monthly P&I
- —
- Monthly cashflow
- —
- DSCR
- —
- Eligible?
- —
No personal income docs; deal must DSCR.
Hard money
10% down · 12.0% · 12mo
- Down + closing
- —
- Monthly P&I
- —
- Monthly cashflow
- —
- DSCR
- —
- Eligible?
- —
Short-term bridge; refi at stabilization.
Rent comps 1 comps
| Address | Beds | Baths | Sqft | Rent | $/sqft | DOM | Units | Dist |
|---|---|---|---|---|---|---|---|---|
| 618 Kyle Dr Tioga, TX | 4.0 | 2.0 | 1741 | $2,700 | $1.55 | 46d | 1 | 0.04mi |
HOA detail
- Monthly dues
- $25 · $300/yr
Listing history 19 events
-
2026-06-22days on market $395,000 Active 138 DOM
-
2026-06-21days on market $395,000 Active 137 DOM
-
2026-06-21days on market $395,000 Active 136 DOM
-
2026-06-18days on market $395,000 Active 134 DOM
-
2026-06-17days on market $395,000 Active 133 DOM
-
2026-06-16days on market $395,000 Active 132 DOM
-
2026-06-15days on market $395,000 Active 131 DOM
-
2026-06-15days on market $395,000 Active 130 DOM
-
2026-06-13days on market $395,000 Active 129 DOM
-
2026-06-12days on market $395,000 Active 128 DOM
-
2026-06-09days on market $395,000 Active 125 DOM
-
2026-06-08days on market $395,000 Active 124 DOM
-
2026-06-08days on market $395,000 Active 123 DOM
-
2026-06-05days on market $395,000 Active 121 DOM
-
2026-06-03days on market $395,000 Active 119 DOM
-
2026-06-02days on market $395,000 Active 118 DOM
-
2026-06-01days on market $395,000 Active 117 DOM
-
2026-05-31days on market $395,000 Active 116 DOM
-
2026-02-04$395,000 Active 744-char remark
Show marketing remark (744 chars)
Step into a home that blends comfort, style, and smart design. The flexible front room can be configured as a private study instead of formal dining, giving you the perfect space to work, create, or unwind. Warm evenings are better by the stone-to-mantle fireplace, while the extended covered patio invites year-round outdoor living. The kitchen is truly the heart of this home, featuring upgraded built-in appliances, gleaming quartz countertops, and rich wood-look tile that flows through the main living areas. Need room for toys or tools? The optional 3-car garagedelivers the extra space you’ve been looking for. Every detail has been chosen to offer both beauty and function—this is a home you’ll love coming back to.
ⓘ Source: listings_history table (triggers on properties + properties_extension) + one-shot
backfill from property_details.listing_events for pre-trigger history.
Climate risk First Street
- Flood 3/10 Moderate FEMA zone X (unshaded) · 20% chance over 30 yrs
- Wildfire 6/10 Major
- Heat 7/10 Severe 7 d/yr ≥109°F today · 22 d/yr by 30 yrs out
- Wind 5/10 Major 26% chance of damaging wind over 30 yrs
- Air quality 3/10 Moderate 3 unhealthy d/yr today · 4 by 30 yrs out
Nearby sold comps map
Loading sold comps map…
Walkable amenities ~0.75 mi
Loading nearby amenities…
Taxation est. · year 1
- Rental income
- $32,400
- − Mortgage interest
- −$22,126
- − Property taxes
- −$5,925
- − Insurance
- −$1,975
- − Repairs & maintenance
- −$2,592
- − Management
- −$2,592
- − HOA
- −$300
- − Depreciation
- −$11,491
- Taxable loss
- −$14,601
- Est. tax savings @ 24.0%
- +$3,504
- After-tax cash flow
- $-3,957/yr
For passive investors: Depreciation is non-cash, so a rental often shows a tax loss while cash-flowing — sheltering income. Rental losses are passive: they offset passive income freely, and up to $25,000/yr can offset ordinary (W-2) income if you actively participate and your MAGI is under $100k (phasing out to $0 by $150k); unused losses carry forward. On sale, claimed depreciation is recaptured at up to 25%, and gains may owe capital-gains tax (a 1031 exchange can defer both). Figures are a year-1 estimate at your 24.0% rate — not tax advice; consult a CPA.
Schools (NCES district)
- District
- Tioga ISD
- NCES district ID
- 4842870
- Math proficiency
- 44% ▼ -12.00%
- Reading proficiency
- 50% ▼ -5.00%
- Median HH income
- $51,096
- Composite
- 40.38/100
- National rank
- #3735
- State rank
- #226 of 826 in TX
Livability — Tioga
- Score
- 66/100
- State rank
- #656
- US rank
- #12339
Category grades
Schools grade is shown separately in the Schools card above.
Census & demographics
- Census place
- Tioga, TX
- City population
- 1,864
- Population (ZIP)
- 1,864
Population outlook (Grayson County) Hauer SSP2
- Today (2025)
- 134,540 people
- By 2030
- 138,653 · +3.1%
- By 2040
- 145,958 · +8.5%
- By 2050
- 151,218 · +12.4%
- By 2075
- 161,802 · +20.3%
- By 2100
- 159,036 · +18.2%
Race, ethnicity, and origin ACS 2023
- Neighborhood character
- Predominantly White (91%)
- Race & ethnicity
- White 91% Hispanic / Latino 7% Two or more races 4% Native American 1%
- Hispanic origin (detail)
- Mexican 5%
- Common ancestry
- Slovak 2% Serbian 1% Romanian 1%
- Foreign-born
- 4% · Canada
- Languages at home
- 96% English-only · Spanish 4%
Political lean MEDSL · Grayson
- 2024 margin
- Solid R (+54.3) · D 22.5% · R 76.7%
- 2008→2024 swing
- -16.4pp toward R · 2008: -37.9pp · 2024: -54.3pp
- All cycles
- 2024: R+54.3 2020: R+49.9 2016: R+53.1 2012: R+48.0 2008: R+37.9
Not yet ingested
- Civics
- —
Market trends
- HPI YoY
- ▲ 7.47%
- Current HPI
- 297.1567
- Rent YoY
- —
- Metro
- —
- State GDP YoY
- ▲ 3.95%
- F500 in state
- 110
Industry mix (Fortune 500 HQ in TX)
| Industry | F500 HQs | Revenue |
|---|---|---|
| Energy | 16 | $1,198B |
|
||
| Technology | 5 | $198B |
|
||
| Engineering / Construction | 4 | $72B |
|
||
| Energy Services | 3 | $60B |
|
||
| Utilities | 3 | $41B |
|
||
| Healthcare | 2 | $330B |
|
||
Price history
1 event — show timeline
- 2026-02-04 Listed $395,000 NTREIS
Cash-flow waterfall
monthlySold comps — $/sqft
last 12 mo · ≤1 miLoading sold comps…