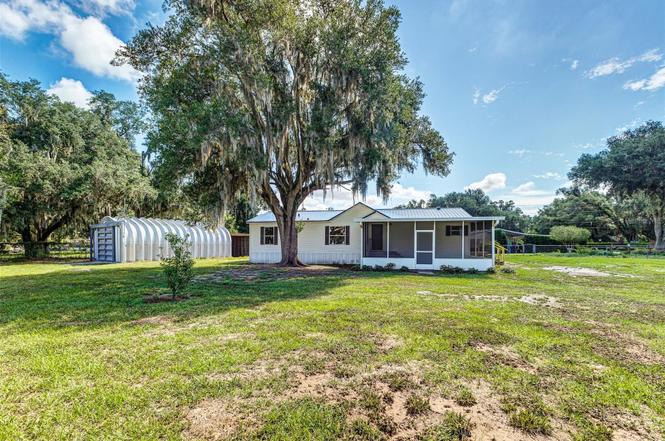
8905 Carrolwood Dr · Kathleen, FL
Flood risk 1/10 · Minimal
- FEMA flood zone
- X (unshaded)
- Chance of flooding over 30 yrs
- 0.0%
- Est. flood insurance / yr
- $507 – $1,088
Fire risk 4/10 · Minor
- Est. fire insurance / yr
- $947 – $1,759
Heat risk 8/10 · Major
- Hot days now (above 108°F)
- 7 days/yr
- Hot days in 30 yrs
- 23 days/yr
Wind risk 9/10 · Severe
- Chance of severe wind over 30 yrs
- 99.0%
Air-quality risk 2/10 · Minimal
- Unhealthy air days now
- 1 days/yr
- Unhealthy air days in 30 yrs
- 1 days/yr
Risk factors via First Street. Map © Google.
Why this score? — see what drove the D- grade
The composite is a weighted blend of 9 inputs, each scored 0–100. Each bar is that input's sub-score; the figure is the points it added to the 100-point composite (weight × sub-score).
- Cash flow +12.5/30.0
- ARV discount +7.5/15.0
- DSCR +3.7/10.0
- Schools +3.5/10.0
- Rent growth +3.2/5.0
- Livability +3.1/5.0
- 1% rule +3.0/10.0
- Condition / age +2.5/5.0
- Appreciation +0.0/10.0
$279,950
🖨 Deal sheet (PDF) 📄 Offer letter ✓ Due diligence
Listing remarks MLS
3BD/ 2BA ON OVER A 1/2 ACRE OF PROPERTY. OWNER WILL CONSIDER FINANCING PLEASE CALL OR EMAIL FOR TERMS.
Key facts
- Screened front porch
- Renovated kitchen
- Fully fenced yard
Tags
Property features AI
Finance
- Other: Lot approximately 0.55 acre (dimensions about 150 x 160); Living area reported as 1,440 sq ft; total building area reported as 1,792 sq ft; Property zoned RE-2; Unfurnished
Exterior
- Parking: Asphalt road access
- Utilities: Well water; Septic tank; Electricity connected
- Home design: Manufactured double-wide home; One story; Southwest facing
- Construction: Frame construction; Metal roof; Crawlspace foundation; Built as double wide
- Exterior features: Covered front porch; Screened porch; Porch; Storage shed/workshop; Other exterior storage; Chain link fencing; Mature landscaping with trees
Interior
- Kitchen: Dishwasher; Microwave; Range; Refrigerator; Electric water heater
- Bedrooms: 3 bedrooms
- Flooring: Carpet
- Bathrooms: 2 full bathrooms
- Heating & cooling: Central heating; Central air conditioning
- Interior features: Ceiling fans; Split-bedroom floor plan; Vaulted ceilings
- Laundry & utility: Laundry inside
Neighborhood map
What this means for you Summary
Snapshot
- This is a 3-bed/2.0-bath manufactured listed at $280k.
Deal economics
- At list price, monthly cash flow is $-42 ($-508/yr) — negative.
- To cash-flow at today's rent, offer at most $272k (2.7% below list).
- To meet the 1% rule (rent ≥ 1% of price), the offer needs to be $224k (20.0% below list).
- Recommended offer: $224k (20.0% below list) — sets the bar for 1% rule.
Location & tenants
- Location reads 62/100 on livability (#752 in FL) — a middle-class / working-renter tenant base. Strengths: cost of living A+, housing A+; Watch: employment D+, schools F, amenities F.
- Polk (suburban): math 39% / reading 43% proficiency, ranked #62 of 73 in FL (top 85%) — families likely to look elsewhere, expect single-tenant / working-renter base with shorter leases.
- Market conditions: Rents rising (+2.8%/yr); 504 active listings in the ZIP; 9 comparable units currently listed for rent nearby; rentals leasing fast (median 12d on market — plan ~1-2 weeks tenant-placement turnaround); 10,384 units permitted in Polk County in 2024 (1,716 in 5+ unit buildings).
- This rent runs 38% of the median local income ($70k/yr) — at the standard rent-burdened threshold; future hikes will face affordability resistance.
Forward outlook
- Local home prices are declining (-3.0%/yr); year-one equity from $2k of loan paydown is wiped out by about $8k of value loss. Plan a longer hold.
- Polk County population projected at +33% by 2050 — long-run rental-demand tailwind backs the buy-and-hold thesis.
Negotiation context
- Only 1 days on market — expect competitive offers; lowballing is unlikely to land.
- 2 sale attempts since 16y ago with the ask held roughly flat each time — persistent listings suggest the price (not the market) is what's stuck; bring a comps-based counter.
- Current owner paid $96k; list at $280k implies a 192% gain — meaningful room to come down on a strong offer.
Risks & watch-outs
- Climate carrying-cost: severe wind risk, 99% chance of damaging wind over 30y; extreme-heat days projected 7→23/yr by 2055 (HVAC capex compounding) — expect insurance premiums to compound above CPI over the hold.
Questions for the listing agent
- What do current leases actually rent for vs. the listed asking? Can we see a recent rent roll and the last 12 months of T-12 income?
- Is there a deadline driving the sale (1031 exchange, divorce, estate, relocation)? That informs how much negotiation room exists.
- Schools are F-rated, which usually means shorter tenancies and higher turnover. Who's the typical renter profile here, and what's been the actual vacancy rate?
- The area grade is low — what's the realistic commute time and amenity access for the typical tenant pool here? Any planned neighborhood developments (good or bad) we should know about?
- What's the average days-on-market for RENTAL listings here right now (not sales)? A rising rental-DOM trend means longer vacancies and softer asking-rent achievability than the comps imply.
- What's the recent tenant-quality profile in this submarket — average credit score on applications, eviction rate, late-payment / NSF rate, and stable-employment percentage? A property-management company in the area should have these aggregated.
- How much new for-sale + rental construction is in the pipeline within 1–3 miles? Heavy new supply typically softens prices + rents 12–24 months out; constrained supply supports both.
Investment metrics
- 1% rule
- 0.80% ✗
- Cap rate
- 6.11%
- Cash-on-cash
- -0.65%
- DSCR
- 0.97
- GRM
- 10.4
CMA / ARV
No comps found within radius.
Projected returns pro-forma
-3.0% appreciation · 2.78% rent growth · sell at horizon
- IRR
- -17.6%
- Equity multiple
- 0.38×
- Total profit
- $-48,596
- Equity at exit
- $41,741
- IRR
- -10.1%
- Equity multiple
- 0.39×
- Total profit
- $-47,978
- Equity at exit
- $24,205
Cash invested: $78,386 (down + closing). Projections, not guarantees.
Landlord ↔ Tenant lean methodology
- Overall (STATE)
- 87 Strongly Landlord-Friendly
- State Florida
- 87 Strongly Landlord-Friendly · R+3
- County
- — inherits STATE
- City
- — inherits STATE
ZIP-level market 33810
- Rents YoY
- 2.8%
- Active inventory
- 504
- Price-to-rent
- 10.4×
Monthly cashflow live
- Estimated rent
- $2,239 high interval (Pro) →
- Mortgage (P&I)
- −$1,468
- Tax from tax record
- −$227 /mo · $2,718/yr
- Insurance
- −$117
- HOA
- −$0
- Vacancy / Maint / Mgmt
- −$470
- Net cashflow
- $-42
Break-even live
Sensitivity live
| Price | -10% $116 | -5% $37 | +0% $-42 | +5% $-122 | +10% $-201 |
|---|---|---|---|---|---|
| Rent | -10% $-219 | -5% $-131 | +0% $-42 | +5% $46 | +10% $135 |
| Rate | -1.0pp $99 | -0.5pp $29 | base $-42 | +0.5pp $-115 | +1.0pp $-189 |
UW: 25.0% down · 7.5% · 30yr · 1.5% tax · 5.0% vac · 8.0% maint · 8.0% mgmt
Financing live
Cash to close
- Down payment
- $69,988
- Closing costs
- $8,398
- Reserves months
- —
- Total cash needed
- —
Loan-product check · same deal, 3 products live
Conventional
25% down · 7.5% · 30yr
- Down + closing
- —
- Monthly P&I
- —
- Monthly cashflow
- —
- DSCR
- —
- Eligible?
- —
Personal DTI + credit; lowest rate.
DSCR
20% down · 8.5% · 30yr
- Down + closing
- —
- Monthly P&I
- —
- Monthly cashflow
- —
- DSCR
- —
- Eligible?
- —
No personal income docs; deal must DSCR.
Hard money
10% down · 12.0% · 12mo
- Down + closing
- —
- Monthly P&I
- —
- Monthly cashflow
- —
- DSCR
- —
- Eligible?
- —
Short-term bridge; refi at stabilization.
Rent comps 9 comps
| Address | Beds | Baths | Sqft | Rent | $/sqft | DOM | Units | Dist |
|---|---|---|---|---|---|---|---|---|
| 3923 Ward Rd Lakeland, FL | 3.0 | 2.0 | 1344 | $2,595 | $1.93 | 11d | 1 | 0.34mi |
| 3616 Tom Bryan Ln Lakeland, FL | 2.0 | 2.0 | 1024 | $1,800 | $1.76 | 24d | 1 | 0.38mi |
| 3382 Winchester Estates Cir Lakeland, FL | 3.0 | 2.0 | 1488 | $1,999 | $1.34 | 4d | 1 | 0.64mi |
| 8755 Fort Socrum Village Way Lakeland, FL | 3.0 | 2.0 | 1510 | $2,000 | $1.32 | 11d | 1 | 0.91mi |
| 8426 Greystone Dr Lakeland, FL | 3.0 | 2.0 | 1555 | $2,350 | $1.51 | 24d | 1 | 1.00mi |
| 8179 Woodvine Cir Lakeland, FL | 3.0 | 2.0 | 1463 | $2,085 | $1.43 | 4d | 1 | 1.05mi |
| 3366 Mahogany Pointe Loop Lakeland, FL | 3.0 | 2.0 | 1566 | $2,125 | $1.36 | 4d | 1 | 1.06mi |
| 7823 Sugar Pine Blvd Lakeland, FL | 3.0 | 2.0 | 1559 | $1,875 | $1.20 | 4d | 1 | 1.34mi |
| 7943 Indian Heights Dr Lakeland, FL | 3.0 | 2.0 | 1305 | $1,975 | $1.51 | 15d | 1 | 1.48mi |
Listing history 2 events
-
2026-06-17remarks 699-char remark
-
2026-06-17$279,950 Active 1 DOM
ⓘ Source: listings_history table (triggers on properties + properties_extension) + one-shot
backfill from property_details.listing_events for pre-trigger history.
Tax reassessment forecast FL · Resets to sale price
- Current annual tax
- $2,718 · $227/mo
- Projected year-2 tax
- $2,718 · $227/mo
- Expected delta
- $0/yr ($0/mo · 0.0%)
ⓘ Screening estimate from a state-policy table — verify with the county assessor before closing.
Climate risk First Street
- Flood 1/10 Low FEMA zone X (unshaded) · 0% chance over 30 yrs
- Wildfire 4/10 Moderate
- Heat 8/10 Severe 7 d/yr ≥108°F today · 23 d/yr by 30 yrs out
- Wind 9/10 Extreme 99% chance of damaging wind over 30 yrs
- Air quality 2/10 Low 1 unhealthy d/yr today · 1 by 30 yrs out
Nearby sold comps map
Loading sold comps map…
Walkable amenities ~0.75 mi
Loading nearby amenities…
Taxation est. · year 1
- Rental income
- $26,870
- − Mortgage interest
- −$15,682
- − Property taxes
- −$2,718
- − Insurance
- −$1,400
- − Repairs & maintenance
- −$2,150
- − Management
- −$2,150
- − Depreciation
- −$8,144
- Taxable loss
- −$5,373
- Est. tax savings @ 24.0%
- +$1,289
- After-tax cash flow
- $782/yr
For passive investors: Depreciation is non-cash, so a rental often shows a tax loss while cash-flowing — sheltering income. Rental losses are passive: they offset passive income freely, and up to $25,000/yr can offset ordinary (W-2) income if you actively participate and your MAGI is under $100k (phasing out to $0 by $150k); unused losses carry forward. On sale, claimed depreciation is recaptured at up to 25%, and gains may owe capital-gains tax (a 1031 exchange can defer both). Figures are a year-1 estimate at your 24.0% rate — not tax advice; consult a CPA.
Schools (NCES district)
- District
- Polk
- NCES district ID
- 1201590
- Math proficiency
- 39% ▼ -11.00%
- Reading proficiency
- 43% ▼ -4.00%
- Median HH income
- $43,979
- Composite
- 34.74/100
- National rank
- #5132
- State rank
- #62 of 73 in FL
Livability — Kathleen
- Score
- 62/100
- State rank
- #752
- US rank
- #16450
Category grades
Schools grade is shown separately in the Schools card above.
Census & demographics
- County
- Polk County · 740,051 people
- City population
- 52,734
- Metro
- Lakeland-Winter Haven, FL
- Population (ZIP)
- 55,137
- Household income
- $69,986
- Rent vs Own
- Severe rent burden
- 1208.0
Population outlook (Polk County) Hauer SSP2
- Today (2025)
- 752,975 people
- By 2030
- 804,621 · +6.9%
- By 2040
- 906,117 · +20.3%
- By 2050
- 1,000,476 · +32.9%
- By 2075
- 1,197,520 · +59.0%
- By 2100
- 1,271,518 · +68.9%
Race, ethnicity, and origin ACS 2023
- Neighborhood character
- Diverse neighborhood (Simpson 0.58)
- Race & ethnicity
- White 59% Hispanic / Latino 23% Black 12% Two or more races 10% Asian 2%
- Hispanic origin (detail)
- Mexican 5% Puerto Rican 9% Cuban 5%
- Common ancestry
- Italian 2% Lithuanian 2% Slovak 1%
- Foreign-born
- 9% · Canada, Jamaica
- Languages at home
- 79% English-only · Spanish 17% French/Haitian/Cajun 1% Tagalog/Filipino 1%
Political lean MEDSL · Polk
- 2024 margin
- Strong R (+20.7) · D 39.2% · R 59.9%
- 2008→2024 swing
- -14.6pp toward R · 2008: -6.1pp · 2024: -20.7pp
- All cycles
- 2024: R+20.7 2020: R+14.4 2016: R+14.1 2012: R+6.8 2008: R+6.1
Not yet ingested
- Civics
- —
Market trends
- HPI YoY
- ▼ -194.94%
- Current HPI
- 320.7366
- Rent YoY
- ▲ 2.78%
- Metro
- Lakeland-Winter Haven, FL
- State GDP YoY
- ▲ 3.28%
- F500 in state
- 36
Industry mix (Fortune 500 HQ in FL)
| Industry | F500 HQs | Revenue |
|---|---|---|
| Industrial Technology | 2 | $29B |
|
||
| Insurance | 2 | $17B |
|
||
| Retail | 1 | $60B |
|
||
| Technology Distribution | 1 | $58B |
|
||
| Homebuilding | 1 | $35B |
|
||
| Technology Manufacturing | 1 | $35B |
|
||
Price history
+250.4% since first listed4 events — show timeline
- 2026-06-17 Listed $279,950 Stellar MLS as Distributed by MLS Grid
- 2026-04-06 Sold (Public Records) $96,000 Public Records
- 2010-09-07 Sold (MLS) $72,000 Stellar MLS as Distributed by MLS Grid
- 2010-07-28 Listed $79,900 Stellar MLS as Distributed by MLS Grid
Property tax history
+14.8%/yrLatest (2025): $2,718 · +9.6% YoY. Source: county tax records.
Cash-flow waterfall
monthlySold comps — $/sqft
last 12 mo · ≤1 miLoading sold comps…