3933 Arizona 260 #66 · Star Valley, AZ
Flood risk 10/10 · Severe
- FEMA flood zone
- D
- Chance of flooding over 30 yrs
- 0.99%
- Est. flood insurance / yr
- $544 – $1,084
Fire risk 9/10 · Severe
- Est. fire insurance / yr
- $610 – $1,132
Heat risk 4/10 · Minor
- Hot days now (above 97°F)
- 7 days/yr
- Hot days in 30 yrs
- 19 days/yr
Wind risk 1/10 · Minimal
- Chance of severe wind over 30 yrs
- —
Air-quality risk 1/10 · Minimal
- Unhealthy air days now
- 0 days/yr
- Unhealthy air days in 30 yrs
- 0 days/yr
Risk factors via First Street. Map © Google.
Why this score? — see what drove the B- grade
The composite is a weighted blend of 9 inputs, each scored 0–100. Each bar is that input's sub-score; the figure is the points it added to the 100-point composite (weight × sub-score).
- Cash flow +30.0/30.0
- DSCR +10.0/10.0
- 1% rule +9.6/10.0
- ARV discount +7.3/15.0
- Condition / age +2.8/5.0
- Rent growth +2.5/5.0
- Schools +2.2/10.0
- Livability +2.2/5.0
- Appreciation +0.0/10.0
$104,000
🖨 Deal sheet (PDF) 📄 Offer letter ✓ Due diligence
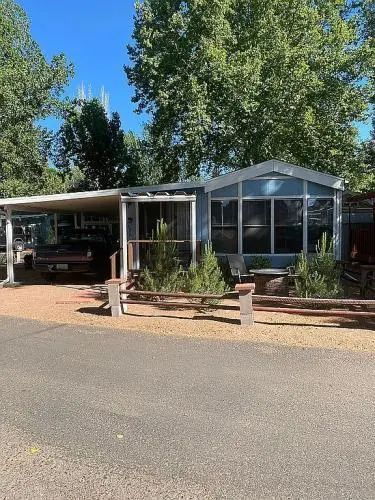
Listing remarks
1989 Park Model in Lamplighter RV Resort. New roof and instant hot water New exterior paint and windows in Az room. Quiet tree lined community. Laundry in 1/2 bath, furniture and appliances stay with home.
Key facts
- Laundry in 1/2 bath
- New exterior paint
- Instant hot water
Tags
Neighborhood map
What this means for you Summary
Snapshot
- This is a 2-bed/1.5-bath manufactured listed at $104k. Condition is rated average.
Deal economics
- At list price, monthly cash flow is $410 ($5k/yr) — positive.
- The deal already cash-flows at list — no discount required.
- Meets the 1% rule at list price ($2k rent vs $104k).
- Cap rate 11.8% vs local median 3.8% in Star Valley — top-decile yield for the area; either an underpriced asset or a hidden risk that comps aren't pricing in. Stress-test before assuming the spread holds.
Location & tenants
- Location reads 44/100 on livability (#380 in AZ) — a working-class tenant base; expect higher turnover. Strengths: cost of living A+, crime A; Watch: schools F, amenities F, commute F.
- Payson Unified District (4209) (town): math 20% / reading 32% proficiency, ranked #138 of 249 in AZ (top 55%) — low school quality limits family demand, transient renter base, plan for 1-2y turnover.
- Market conditions: 695 active listings in the ZIP; 217 units permitted in Gila County in 2024 (0 in 5+ unit buildings).
Forward outlook
- Local home prices are declining (-3.0%/yr); year-one equity from $719 of loan paydown is wiped out by about $3k of value loss. Plan a longer hold.
- Gila County population projected at -18% by 2050 — secular population decline; favor cash flow + early exit over multi-decade hold.
- At projected returns (-3.0% appreciation + 3.0% rent growth), your $29k cash investment doubles in ~8 years — after that, you're playing with house money.
Negotiation context
- Only 7 days on market — expect competitive offers; lowballing is unlikely to land.
Risks & watch-outs
- Watch-outs: flood insurance adds $68/mo.
- Climate carrying-cost: severe flood risk; severe wildfire risk — expect insurance premiums to compound above CPI over the hold.
Questions for the listing agent
- What's the actual annual flood-insurance premium (NFIP or private), and is the property in a SFHA with mandatory coverage?
- Is there a deadline driving the sale (1031 exchange, divorce, estate, relocation)? That informs how much negotiation room exists.
- Schools are F-rated, which usually means shorter tenancies and higher turnover. Who's the typical renter profile here, and what's been the actual vacancy rate?
- What's the average days-on-market for RENTAL listings here right now (not sales)? A rising rental-DOM trend means longer vacancies and softer asking-rent achievability than the comps imply.
- What's the recent tenant-quality profile in this submarket — average credit score on applications, eviction rate, late-payment / NSF rate, and stable-employment percentage? A property-management company in the area should have these aggregated.
- How much new for-sale + rental construction is in the pipeline within 1–3 miles? Heavy new supply typically softens prices + rents 12–24 months out; constrained supply supports both.
Investment metrics
- 1% rule
- 1.46% ✓
- Cap rate
- 11.81%
- Cash-on-cash
- 19.69%
- DSCR
- 1.88
- GRM
- 5.7
CMA / ARV
- ARV (on-the-fly)
- $103,600
- Comps found
- 11
Show comp detail 11 sales within ~0.75 mi
| Address | Dist | Beds/Ba | Sqft | Sold | Price | $/sf | Match |
|---|---|---|---|---|---|---|---|
| 3933 Lamplighter Rv #125 | 0.06mi | 1/1.0 (-1) | 660 (-6%) | 1mo | $111,000 | $168 | 79 |
| 3933 E Hwy Az-260 #116 | 0.00mi | 2/1.0 | 596 (-15%) | 4mo | $64,000 | $107 | 70 |
| 16 N Star Vale Rd Unit 114B | 0.34mi | 2/2.0 | 720 (+3%) | 13mo | $115,000 | $160 | 67 |
| 3933 E Hwy 260 -- #211 | 0.10mi | 1/1.0 (-1) | 660 (-6%) | 16mo | $82,900 | $126 | 65 |
| 190 N Cornerstone Way #42 | 0.42mi | 2/1.0 | 720 (+3%) | 14mo | $105,000 | $146 | 62 |
| 3680 W State Hwy 260 Hwy Unit C29 | 0.31mi | 1/1.0 (-1) | 685 (-2%) | 15mo | $54,500 | $80 | 62 |
| 16 N Star Vale Drive Dr Unit 121B | 0.34mi | 1/1.0 (-1) | 596 (-15%) | 2mo | $149,000 | $250 | 51 |
| 16 N Star Vale Drive Dr #44 | 0.34mi | 2/1.5 | 784 (+12%) | 16mo | $88,400 | $113 | 51 |
| 16 N Star Vale Drive Dr Unit 123A | 0.34mi | 1/1.0 (-1) | 616 (-12%) | 21mo | $91,000 | $148 | 40 |
| 93 N Sky Run Ln #4 | 0.70mi | 1/1.0 (-1) | 720 (+3%) | 23mo | $135,000 | $188 | 36 |
| 3616 E AZ Highway 260 Dr Unit 123A | 0.44mi | 1/1.0 (-1) | 616 (-12%) | 21mo | $91,000 | $148 | 35 |
Match score weights: distance 35% · size 25% · config 20% · recency 20%. Top-matched comps best support the ARV.
Projected returns pro-forma
-3.0% appreciation · 3.0% rent growth · sell at horizon
- IRR
- 8.2%
- Equity multiple
- 1.32×
- Total profit
- $9,328
- Equity at exit
- $15,507
- IRR
- 17.5%
- Equity multiple
- 2.44×
- Total profit
- $42,014
- Equity at exit
- $8,992
Cash invested: $29,120 (down + closing). Projections, not guarantees.
Landlord ↔ Tenant lean methodology
- Overall (STATE)
- 87 Strongly Landlord-Friendly
- State Arizona
- 87 Strongly Landlord-Friendly · R+3
- County
- — inherits STATE
- City
- — inherits STATE
ZIP-level market 85541
- Home prices YoY
- -6.6%
- Active inventory
- 695
- Price-to-rent
- 5.7×
Monthly cashflow live
- Estimated rent
- $1,515 medium interval (Pro) →
- Mortgage (P&I)
- −$545
- Tax est. 1.5%
- −$130 /mo · $1,560/yr
- Insurance
- −$43
- Flood insurance flood zone
- −$68 /mo · $814/yr
- HOA
- −$0
- Vacancy / Maint / Mgmt
- −$318
- Net cashflow
- $410
Break-even live
Sensitivity live
| Price | -10% $482 | -5% $446 | +0% $410 | +5% $374 | +10% $338 |
|---|---|---|---|---|---|
| Rent | -10% $290 | -5% $350 | +0% $410 | +5% $470 | +10% $530 |
| Rate | -1.0pp $462 | -0.5pp $437 | base $410 | +0.5pp $383 | +1.0pp $356 |
UW: 25.0% down · 7.5% · 30yr · 1.5% tax · 5.0% vac · 8.0% maint · 8.0% mgmt
Financing live
Cash to close
- Down payment
- $26,000
- Closing costs
- $3,120
- Reserves months
- —
- Total cash needed
- —
Loan-product check · same deal, 3 products live
Conventional
25% down · 7.5% · 30yr
- Down + closing
- —
- Monthly P&I
- —
- Monthly cashflow
- —
- DSCR
- —
- Eligible?
- —
Personal DTI + credit; lowest rate.
DSCR
20% down · 8.5% · 30yr
- Down + closing
- —
- Monthly P&I
- —
- Monthly cashflow
- —
- DSCR
- —
- Eligible?
- —
No personal income docs; deal must DSCR.
Hard money
10% down · 12.0% · 12mo
- Down + closing
- —
- Monthly P&I
- —
- Monthly cashflow
- —
- DSCR
- —
- Eligible?
- —
Short-term bridge; refi at stabilization.
Listing history 7 events
-
2026-06-19days on market $104,000 Active 7 DOM
-
2026-06-18days on market $104,000 Active 6 DOM
-
2026-06-17days on market $104,000 Active 5 DOM
-
2026-06-16days on market $104,000 Active 4 DOM
-
2026-06-15days on market $104,000 Active 3 DOM
-
2026-06-12remarks 205-char remark
-
2026-06-12$104,000 Active 1 DOM
ⓘ Source: listings_history table (triggers on properties + properties_extension) + one-shot
backfill from property_details.listing_events for pre-trigger history.
Climate risk First Street
- Flood 10/10 Extreme FEMA zone D · 99% chance over 30 yrs
- Wildfire 9/10 Extreme
- Heat 4/10 Moderate 7 d/yr ≥97°F today · 19 d/yr by 30 yrs out
- Wind 1/10 Low
- Air quality 1/10 Low 0 unhealthy d/yr today · 0 by 30 yrs out
Nearby sold comps map
Loading sold comps map…
Walkable amenities ~0.75 mi
Loading nearby amenities…
Taxation est. · year 1
- Rental income
- $18,176
- − Mortgage interest
- −$5,826
- − Property taxes
- −$1,560
- − Insurance
- −$1,334
- − Repairs & maintenance
- −$1,454
- − Management
- −$1,454
- − Depreciation
- −$3,025
- Taxable income
- $3,523
- Est. tax owed @ 24.0%
- −$846
- After-tax cash flow
- $4,075/yr
For passive investors: Depreciation is non-cash, so a rental often shows a tax loss while cash-flowing — sheltering income. Rental losses are passive: they offset passive income freely, and up to $25,000/yr can offset ordinary (W-2) income if you actively participate and your MAGI is under $100k (phasing out to $0 by $150k); unused losses carry forward. On sale, claimed depreciation is recaptured at up to 25%, and gains may owe capital-gains tax (a 1031 exchange can defer both). Figures are a year-1 estimate at your 24.0% rate — not tax advice; consult a CPA.
Condition & rehab AI · 12 photos
This park model has average condition with cosmetic repairs needed, particularly in the kitchen and bathroom. Painting and updating fixtures would significantly enhance its resale and rental value.
Repairs flagged
- Minor Kitchen cabinets — Worn appearance
- Minor Bathroom fixtures — Dated appearance
- Moderate Exterior paint — Faded appearance
Value-add opportunities
- Both Paint exterior and interior — Enhances curb appeal and interior appearance
- Both Replace worn kitchen cabinets — Improves functionality and aesthetics
- Both Replace dated bathroom fixtures — Enhances functionality and aesthetics
Renovation cost estimate screening
| Repair item | Severity | Est. cost |
|---|---|---|
| Kitchen cabinets · Worn appearance | Minor | $500–3,000 |
| Bathroom fixtures · Dated appearance | Minor | $500–3,000 |
| Exterior paint · Faded appearance | Moderate | $3,000–15,000 |
| Total estimated repair cost · 3 items | $4,000–21,000 |
Value-add ROI direction
- Both Paint exterior and interior — Enhances curb appeal and interior appearance ↑
- Both Replace worn kitchen cabinets — Improves functionality and aesthetics ↑
- Both Replace dated bathroom fixtures — Enhances functionality and aesthetics ↑
ⓘ Cost ranges are severity-bucket heuristics (US national rule-of-thumb). Get contractor quotes + a written scope before underwriting a rehab budget.
Schools (NCES district)
- District
- Payson Unified District (4209)
- NCES district ID
- 0406070
- Math proficiency
- 20% ▼ -21.00%
- Reading proficiency
- 32% ▼ -16.00%
- Median HH income
- $41,440
- Composite
- 22.03/100
- National rank
- #8200
- State rank
- #138 of 249 in AZ
Livability — Star Valley
- Score
- 44/100
- State rank
- #380
- US rank
- #26699
Category grades
Schools grade is shown separately in the Schools card above.
Census & demographics
- Census place
- Star Valley, AZ
- County
- Gila County · 23,382 people
- Metro
- Payson, AZ
- Population (ZIP)
- 23,382
- Household income
- $66,383
- Rent vs Own
- Severe rent burden
- 523.0
Population outlook (Gila County) Hauer SSP2
- Today (2025)
- 50,229 people
- By 2030
- 48,202 · -4.0%
- By 2040
- 44,101 · -12.2%
- By 2050
- 41,041 · -18.3%
- By 2075
- 37,536 · -25.3%
- By 2100
- 32,485 · -35.3%
Race, ethnicity, and origin ACS 2023
- Neighborhood character
- Predominantly White (84%)
- Race & ethnicity
- White 84% Hispanic / Latino 11% Two or more races 8% Native American 1%
- Hispanic origin (detail)
- Mexican 9%
- Common ancestry
- Portuguese 3% Lithuanian 2% Iranian 2%
- Foreign-born
- 3% · Canada
- Languages at home
- 93% English-only · Spanish 5% German/W. Germanic 1%
Political lean MEDSL · Gila
- 2024 margin
- Solid R (+37.6) · D 30.8% · R 68.4%
- 2008→2024 swing
- -9.8pp toward R · 2008: -27.8pp · 2024: -37.6pp
- All cycles
- 2024: R+37.6 2020: R+34.1 2016: R+32.4 2012: R+26.4 2008: R+27.8
Not yet ingested
- Civics
- —
Market trends
- HPI YoY
- ▼ -29.47%
- Current HPI
- 416.4005
- Rent YoY
- —
- Metro
- Payson, AZ
- State GDP YoY
- ▲ 4.54%
- F500 in state
- 20
Industry mix (Fortune 500 HQ in AZ)
| Industry | F500 HQs | Revenue |
|---|---|---|
| Technology | 2 | $13B |
|
||
| Mining / Metals | 1 | $23B |
|
||
| Environmental Services | 1 | $16B |
|
||
| Metals / Steel | 1 | $14B |
|
||
| Technology Distribution | 1 | $9B |
|
||
| Homebuilding | 1 | $8B |
|
||
Price history
1 event — show timeline
- 2026-06-11 Listed $104,000 Fizber.com
Cash-flow waterfall
monthlySold comps — $/sqft
last 12 mo · ≤1 miLoading sold comps…