11377 Township Road 266 #21 · Chippewa Park, OH
Flood risk 1/10 · Minimal
- FEMA flood zone
- X (unshaded)
- Chance of flooding over 30 yrs
- 0.0%
- Est. flood insurance / yr
- $507 – $1,088
Fire risk 1/10 · Minimal
- Est. fire insurance / yr
- $713 – $1,323
Heat risk 3/10 · Minor
- Hot days now (above 99°F)
- 7 days/yr
- Hot days in 30 yrs
- 18 days/yr
Wind risk 2/10 · Minimal
- Chance of severe wind over 30 yrs
- —
Air-quality risk 2/10 · Minimal
- Unhealthy air days now
- 1 days/yr
- Unhealthy air days in 30 yrs
- 2 days/yr
Risk factors via First Street. Map © Google.
Why this score? — see what drove the C+ grade
The composite is a weighted blend of 9 inputs, each scored 0–100. Each bar is that input's sub-score; the figure is the points it added to the 100-point composite (weight × sub-score).
- Cash flow +30.0/30.0
- 1% rule +10.0/10.0
- DSCR +10.0/10.0
- Schools +5.3/10.0
- Condition / age +3.8/5.0
- Rent growth +2.5/5.0
- Livability +2.5/5.0
- ARV discount +0.0/15.0
- Appreciation +0.0/10.0
$59,900
🖨 Deal sheet 📄 Offer letter ✓ Due diligence
Listing remarks MLS
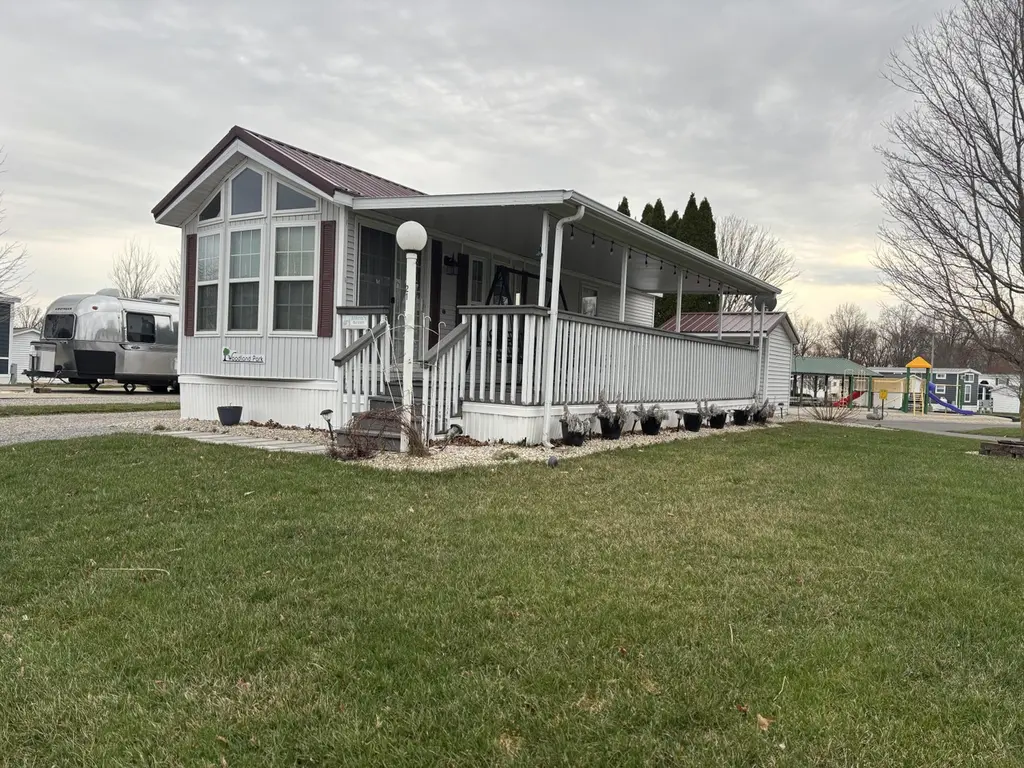
This 1999 Woodland Park mobile home has been very well taken care of, both inside and out. It is situated on one of the largest corner lots in the park. The floor plan is very open with the living room, kitchen and dining area all in one. The master bedroom is very spacious. Some updates include some replacement windows, newer roof, amazing composite covered porch and more. WASHER/DRYER HOOK-UP!!! Furnished, including porch furniture. Mower and golf cart are negotiable. Community features include ample parking lot located by front entrance, shelter house, inground pool, new asphalt roads, putt-putt and basketball area, swing set area and more! Close to boat and jet ski rentals and easily accessible to restaurants.
Key facts
- Open floor plan
- Newer roof
- Largest corner lots
Tags
Neighborhood map
What this means for you Summary
Snapshot
- This is a 1-bed/1.0-bath manufactured listed at $60k. Condition is rated good.
Deal economics
- At list price, monthly cash flow is $483 ($6k/yr) — positive.
- The deal already cash-flows at list — no discount required.
- Meets the 1% rule at list price ($1k rent vs $60k).
- Recommended offer: $55k (9.0% below list) — sets the bar for market timing.
- Cap rate 16.0% vs local median 5.5% in Chippewa Park — top-decile yield for the area; either an underpriced asset or a hidden risk that comps aren't pricing in. Stress-test before assuming the spread holds.
Location & tenants
- Location reads 49/100 on livability (#1,173 in OH) — a working-class tenant base; expect higher turnover. Strengths: cost of living A+, crime A; Watch: schools F, amenities F, commute F.
- Indian Lake Local (rural): math 59% / reading 66% proficiency, ranked #261 of 656 in OH (top 40%) — acceptable for families but not a draw, mixed tenant base, ~2y average lease.
- Market conditions: 112 active listings in the ZIP; 121 units permitted in Logan County in 2024 (0 in 5+ unit buildings).
Forward outlook
- Local home prices are declining (-3.0%/yr); year-one equity from $414 of loan paydown is wiped out by about $2k of value loss. Plan a longer hold.
- Logan County population projected at -15% by 2050 — secular population decline; favor cash flow + early exit over multi-decade hold.
- At projected returns (-3.0% appreciation + 3.0% rent growth), your $17k cash investment doubles in ~4 years — after that, you're playing with house money.
Negotiation context
- It's been on market 96 days — a 9% lower offer ($55k) is reasonable based on typical stale-listing flexibility.
Questions for the listing agent
- It's been on market 96 days. Have you received any prior offers? Is the seller open to a 9% concession, seller financing, or rate buy-down credit?
- Why hasn't it sold? Are there any deal-killer items the seller is aware of (foundation, flood, title, zoning, code violations)?
- Is there a deadline driving the sale (1031 exchange, divorce, estate, relocation)? That informs how much negotiation room exists.
- Schools are F-rated, which usually means shorter tenancies and higher turnover. Who's the typical renter profile here, and what's been the actual vacancy rate?
- What's the average days-on-market for RENTAL listings here right now (not sales)? A rising rental-DOM trend means longer vacancies and softer asking-rent achievability than the comps imply.
- What's the recent tenant-quality profile in this submarket — average credit score on applications, eviction rate, late-payment / NSF rate, and stable-employment percentage? A property-management company in the area should have these aggregated.
- How much new for-sale + rental construction is in the pipeline within 1–3 miles? Heavy new supply typically softens prices + rents 12–24 months out; constrained supply supports both.
Investment metrics
- 1% rule
- 1.90% ✓
- Cap rate
- 15.98%
- Cash-on-cash
- 34.59%
- DSCR
- 2.54
- GRM
- 4.4
CMA / ARV
- ARV (median comp)
- $48,078
- List price
- $59,900
- Delta
- 24.59%
- Verdict
- OVERPRICED
- Comps
- 14 within 1.0 mi
Show comp detail 12 sales within ~0.75 mi
| Address | Dist | Beds/Ba | Sqft | Sold | Price | $/sf | Match |
|---|---|---|---|---|---|---|---|
| 11377 Township Road 266 #28 | 0.06mi | 1/1.0 | 396 (-1%) | 1mo | $77,500 | $196 | 94 |
| 11377 Township Road 266 #3 | 0.06mi | 1/1.0 | 396 (-1%) | 7mo | $45,500 | $115 | 90 |
| 11377 Township Rd 266 #66 | 0.06mi | 2/1.0 (+1) | 396 (-1%) | 2mo | $75,000 | $189 | 88 |
| 11377 Township Road 266 #98 | 0.00mi | 2/1.0 (+1) | 396 (-1%) | 7mo | $102,000 | $258 | 88 |
| 11377 Township Road 266 #57 | 0.00mi | 2/1.0 (+1) | 396 (-1%) | 8mo | $45,000 | $114 | 87 |
| 11377 Township Road 266 #30 | 0.06mi | 2/1.0 (+1) | 396 (-1%) | 5mo | $40,000 | $101 | 86 |
| 11377 Township Road 266 #75 | 0.06mi | 2/1.0 (+1) | 396 (-1%) | 7mo | $79,000 | $199 | 84 |
| 11377 Township Road 266 #70 | 0.06mi | 2/1.0 (+1) | 396 (-1%) | 9mo | $97,500 | $246 | 83 |
| 11377 Township Road 266 #77 | 0.06mi | 1/1.0 | 432 (+8%) | 8mo | $57,000 | $132 | 78 |
| 11377 Township Road 266 #61 | 0.06mi | 1/1.0 | 432 (+8%) | 9mo | $56,000 | $130 | 76 |
| 11377 Township Road 266 #15 | 0.06mi | 1/1.0 | 432 (+8%) | 9mo | $45,000 | $104 | 76 |
| 11377 TR 266 | 0.06mi | 1/1.0 | 367 (-8%) | 9mo | $60,000 | $163 | 76 |
Match score weights: distance 35% · size 25% · config 20% · recency 20%. Top-matched comps best support the ARV.
Projected returns pro-forma
-3.0% appreciation · 3.0% rent growth · sell at horizon
- IRR
- 30.1%
- Equity multiple
- 2.26×
- Total profit
- $21,103
- Equity at exit
- $8,931
- IRR
- 37.3%
- Equity multiple
- 4.46×
- Total profit
- $58,096
- Equity at exit
- $5,179
Cash invested: $16,772 (down + closing). Projections, not guarantees.
Landlord ↔ Tenant lean methodology
- Overall (STATE)
- 73 Landlord-Friendly
- State Ohio
- 73 Landlord-Friendly · R+6
- County
- — inherits STATE
- City
- — inherits STATE
ZIP-level market 43331
- Home prices YoY
- -30.0%
- Active inventory
- 112
- Price-to-rent
- 4.4×
Monthly cashflow live
- Estimated rent
- $1,136 medium interval (Pro) →
- Mortgage (P&I)
- −$314
- Tax est. 1.5%
- −$75 /mo · $898/yr
- Insurance
- −$25
- HOA
- −$0
- Vacancy / Maint / Mgmt
- −$239
- Net cashflow
- $483
Break-even live
UW: 25.0% down · 7.5% · 30yr · 1.5% tax · 5.0% vac · 8.0% maint · 8.0% mgmt
Financing live
Cash to close
- Down payment
- $14,975
- Closing costs
- $1,797
- Reserves months
- —
- Total cash needed
- —
Loan-product check · same deal, 3 products live
Conventional
25% down · 7.5% · 30yr
- Down + closing
- —
- Monthly P&I
- —
- Monthly cashflow
- —
- DSCR
- —
- Eligible?
- —
Personal DTI + credit; lowest rate.
DSCR
20% down · 8.5% · 30yr
- Down + closing
- —
- Monthly P&I
- —
- Monthly cashflow
- —
- DSCR
- —
- Eligible?
- —
No personal income docs; deal must DSCR.
Hard money
10% down · 12.0% · 12mo
- Down + closing
- —
- Monthly P&I
- —
- Monthly cashflow
- —
- DSCR
- —
- Eligible?
- —
Short-term bridge; refi at stabilization.
Listing history 15 events
-
2026-06-18days on market $59,900 Active 96 DOM
-
2026-06-17days on market $59,900 Active 95 DOM
-
2026-06-16days on market $59,900 Active 94 DOM
-
2026-06-15days on market $59,900 Active 93 DOM
-
2026-06-13days on market $59,900 Active 91 DOM
-
2026-06-12days on market $59,900 Active 90 DOM
-
2026-06-09days on market $59,900 Active 87 DOM
-
2026-06-08days on market $59,900 Active 86 DOM
-
2026-06-08days on market $59,900 Active 85 DOM
-
2026-06-07days on market $59,900 Active 84 DOM
-
2026-06-04days on market $59,900 Active 81 DOM
-
2026-06-02days on market $59,900 Active 80 DOM
-
2026-06-01days on market $59,900 Active 79 DOM
-
2026-05-31days on market $59,900 Active 78 DOM
-
2026-03-14$59,900 Active 732-char remark
Show marketing remark (732 chars)
This 1999 Woodland Park mobile home has been very well taken care of, both inside and out. It is situated on one of the largest corner lots in the park. The floor plan is very open with the living room, kitchen and dining area all in one. The master bedroom is very spacious. Some updates include some replacement windows, newer roof, amazing composite covered porch and more. WASHER/DRYER HOOK-UP!!! Furnished, including porch furniture. Mower and golf cart are negotiable. Community features include ample parking lot located by front entrance, shelter house, inground pool, new asphalt roads, putt-putt and basketball area, swing set area and more! Close to boat and jet ski rentals and easily accessible to restaurants.
ⓘ Source: listings_history table (triggers on properties + properties_extension) + one-shot
backfill from property_details.listing_events for pre-trigger history.
Climate risk First Street
- Flood 1/10 Low FEMA zone X (unshaded) · 0% chance over 30 yrs
- Wildfire 1/10 Low
- Heat 3/10 Moderate 7 d/yr ≥99°F today · 18 d/yr by 30 yrs out
- Wind 2/10 Low
- Air quality 2/10 Low 1 unhealthy d/yr today · 2 by 30 yrs out
Nearby sold comps map
Loading sold comps map…
Walkable amenities ~0.75 mi
Loading nearby amenities…
Taxation est. · year 1
- Rental income
- $13,632
- − Mortgage interest
- −$3,355
- − Property taxes
- −$898
- − Insurance
- −$300
- − Repairs & maintenance
- −$1,091
- − Management
- −$1,091
- − Depreciation
- −$1,743
- Taxable income
- $5,155
- Est. tax owed @ 24.0%
- −$1,237
- After-tax cash flow
- $4,564/yr
For passive investors: Depreciation is non-cash, so a rental often shows a tax loss while cash-flowing — sheltering income. Rental losses are passive: they offset passive income freely, and up to $25,000/yr can offset ordinary (W-2) income if you actively participate and your MAGI is under $100k (phasing out to $0 by $150k); unused losses carry forward. On sale, claimed depreciation is recaptured at up to 25%, and gains may owe capital-gains tax (a 1031 exchange can defer both). Figures are a year-1 estimate at your 24.0% rate — not tax advice; consult a CPA.
Condition & rehab AI · 13 photos
This 1999 Woodland Park mobile home is in good condition with some cosmetic updates needed. It offers a spacious floor plan and is situated on a corner lot with community amenities.
Repairs flagged
- Minor Kitchen cabinets — Worn appearance
- Minor Bathroom vanity — Needs fresh paint
Value-add opportunities
- Resale Paint kitchen cabinets — Fresh paint enhances curb appeal
- Resale Paint bathroom vanity — Fresh paint enhances curb appeal
- Resale Replace worn kitchen cabinets — New cabinets improve functionality and aesthetics
- Resale Replace worn bathroom vanity — New vanity enhances functionality and aesthetics
Renovation cost estimate screening
| Repair item | Severity | Est. cost |
|---|---|---|
| Kitchen cabinets · Worn appearance | Minor | $500–3,000 |
| Bathroom vanity · Needs fresh paint | Minor | $500–3,000 |
| Total estimated repair cost · 2 items | $1,000–6,000 |
Value-add ROI direction
- Resale Paint kitchen cabinets — Fresh paint enhances curb appeal ↑
- Resale Paint bathroom vanity — Fresh paint enhances curb appeal ↑
- Resale Replace worn kitchen cabinets — New cabinets improve functionality and aesthetics ↑
- Resale Replace worn bathroom vanity — New vanity enhances functionality and aesthetics ↑
ⓘ Cost ranges are severity-bucket heuristics (US national rule-of-thumb). Get contractor quotes + a written scope before underwriting a rehab budget.
Schools (NCES district)
- District
- Indian Lake Local
- NCES district ID
- 3904808
- Math proficiency
- 59% ▼ -14.00%
- Reading proficiency
- 66% ▼ -4.00%
- Median HH income
- $44,496
- Composite
- 52.6/100
- National rank
- #1559
- State rank
- #261 of 656 in OH
Livability — Chippewa Park
- Score
- 49/100
- State rank
- #1173
- US rank
- #25758
Category grades
Schools grade is shown separately in the Schools card above.
Census & demographics
- County
- Logan · 47,256 people
- Population (ZIP)
- 4,012
- Household income
- $60,159
- Rent vs Own
- Severe rent burden
- 16.1
Population outlook (Logan County) Hauer SSP2
- Today (2025)
- 44,240 people
- By 2030
- 43,166 · -2.4%
- By 2040
- 40,495 · -8.5%
- By 2050
- 37,511 · -15.2%
- By 2075
- 30,453 · -31.2%
- By 2100
- 23,081 · -47.8%
Race, ethnicity, and origin ACS 2023
- Neighborhood character
- Predominantly White (94%)
- Race & ethnicity
- White 94% Hispanic / Latino 4% Two or more races 2% Black 1%
- Common ancestry
- Lithuanian 2% Slovak 2% Iranian 1%
- Foreign-born
- 2% · Canada
- Languages at home
- 96% English-only · Spanish 4%
Political lean MEDSL · Logan
- 2024 margin
- Solid R (+56.2) · D 21.5% · R 77.7%
- 2008→2024 swing
- -29.6pp toward R · 2008: -26.6pp · 2024: -56.2pp
- All cycles
- 2024: R+56.2 2020: R+55.2 2016: R+52.6 2012: R+31.8 2008: R+26.6
Not yet ingested
- Civics
- —
Market trends
- HPI YoY
- ▼ -109.75%
- Current HPI
- 256.2406
- Rent YoY
- —
- Metro
- —
- State GDP YoY
- ▲ 1.98%
- F500 in state
- 48
Industry mix (Fortune 500 HQ in OH)
| Industry | F500 HQs | Revenue |
|---|---|---|
| Insurance | 3 | $145B |
|
||
| Industrial Machinery | 3 | $49B |
|
||
| Financial Services | 3 | $24B |
|
||
| Consumer Goods | 2 | $93B |
|
||
| Aerospace / Defense | 2 | $47B |
|
||
| Utilities | 2 | $33B |
|
||
Price history
1 event — show timeline
- 2026-03-14 Listed $59,900 WRIST
Cash-flow waterfall
monthlySold comps — $/sqft
last 12 mo · ≤1 miLoading sold comps…