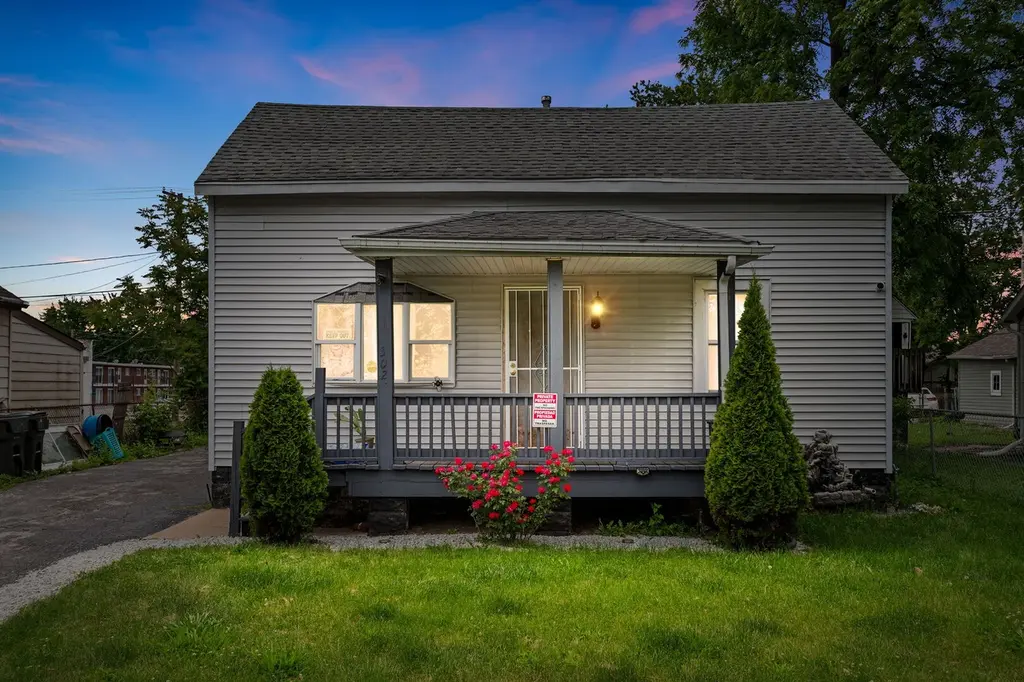
3022 Commercial Ave · South Chicago Heights, IL
Flood risk 1/10 · Minimal
- FEMA flood zone
- X (unshaded)
- Chance of flooding over 30 yrs
- 0.0%
- Est. flood insurance / yr
- $507 – $1,088
Fire risk 1/10 · Minimal
- Est. fire insurance / yr
- $804 – $1,492
Heat risk 3/10 · Minor
- Hot days now (above 101°F)
- 7 days/yr
- Hot days in 30 yrs
- 16 days/yr
Wind risk 2/10 · Minimal
- Chance of severe wind over 30 yrs
- —
Air-quality risk 2/10 · Minimal
- Unhealthy air days now
- 2 days/yr
- Unhealthy air days in 30 yrs
- 2 days/yr
Risk factors via First Street. Map © Google.
Why this score? — see what drove the C- grade
The composite is a weighted blend of 9 inputs, each scored 0–100. Each bar is that input's sub-score; the figure is the points it added to the 100-point composite (weight × sub-score).
- Cash flow +19.4/30.0
- ARV discount +7.5/15.0
- DSCR +6.1/10.0
- 1% rule +5.9/10.0
- Rent growth +4.1/5.0
- Livability +3.8/5.0
- Condition / age +2.5/5.0
- Schools +0.7/10.0
- Appreciation +0.0/10.0
$160,000
🖨 Deal sheet 📄 Offer letter ✓ Due diligence
Listing remarks
Welcome to 3022 Commercial Ave. Beautifully updated and move-in ready Cape Cod located in the heart of South Chicago Heights! This charming home offers the perfect blend of classic character and modern updates featuring 3 spacious bedrooms, 1.5 bathrooms, and a warm, inviting layout designed for comfortable living. Step inside to a bright and airy living room filled with natural light, updated flooring, fresh paint, and stylish finishes throughout. The remodeled kitchen features beautiful white cabinetry, ample counter space, and stainless steel appliances, making it ideal for both everyday living and entertaining. The main level includes a convenient first-floor bedroom and updated full ba
Key facts
- Spacious backyard
- Full basement
- Updated kitchen
Tags
Property features AI
Finance
- Other: Accessible to school bus service, commuter bus and train, and interstate
- HOA & community: No master association fee required
Exterior
- Parking: Detached garage (about 2.5 garage/parking spaces total)
- Utilities: Lake Michigan water source; Public sewer
- Home design: Detached single-family home; 1.5-story design; Fee simple ownership; Rehab completed in 2021
- Construction: Vinyl siding exterior; Property age approximately 71–80 years; Built before 1978
- Exterior features: Lot dimensions approximately 50 x 124; Less than 0.25 acre lot
Interior
- Kitchen: Kitchen on main level (18 x 11)
- Bedrooms: 3 bedrooms (Master on main level); Two additional bedrooms on second level (one 16 x 12, one 16 x 11)
- Flooring: Wood laminate in living and dining areas; Vinyl flooring in kitchen, master bedroom, and laundry; Carpet in two upstairs bedrooms
- Bathrooms: 1 full bathroom; 1 half bathroom
- Heating & cooling: Natural gas heating; Central air conditioning
- Interior features: 6 total rooms; Unfinished full basement
- Laundry & utility: Main-level laundry room (14 x 7)
Neighborhood map
What this means for you Summary
Snapshot
- This is a 3-bed/1.5-bath single-family listed at $160k.
Deal economics
- At list price, monthly cash flow is $180 ($2k/yr) — positive.
- The deal already cash-flows at list — no discount required.
- Meets the 1% rule at list price ($2k rent vs $160k).
- Recommended offer: $158k (1.5% below list) — sets the bar for market timing.
Location & tenants
- Location reads 76/100 on livability (#173 in IL, #3,304 nationally) — a middle-class / working-renter tenant base. Strengths: commute A+, cost of living A+, housing A+; Watch: amenities C-, crime D+, employment D+.
- Bloom Twp Hsd 206 (suburban): math 8% / reading 9% proficiency, ranked #591 of 620 in IL (top 95%) — low school quality limits family demand, transient renter base, plan for 1-2y turnover.
- Market conditions: Rents rising fast (+6.5%/yr); 222 active listings in the ZIP; 2 comparable units currently listed for rent nearby; 6,272 units permitted in Cook County in 2024 (4,658 in 5+ unit buildings).
- This rent runs 34% of the median local income ($62k/yr) — at the standard rent-burdened threshold; future hikes will face affordability resistance.
Forward outlook
- Local home prices are declining (-3.0%/yr); year-one equity from $1k of loan paydown is wiped out by about $5k of value loss. Plan a longer hold.
- At projected returns (-3.0% appreciation + 6.5% rent growth), your $45k cash investment doubles in ~10 years — after that, you're playing with house money.
Negotiation context
- It's been on market 15 days — a 2% lower offer ($158k) is reasonable based on typical stale-listing flexibility.
- 8 sale attempts since 6y ago; this cycle's ask is 60% above the opening price — seller raised mid-cycle; expect resistance to lowballs.
- Current owner paid $115k; 39% above their basis — modest negotiation headroom, anchor on the comps not their cost.
Risks & watch-outs
- Watch-outs: built in 1952 — expect roof / HVAC / electrical / plumbing capex.
Questions for the listing agent
- Built in 1952 — when were the roof, HVAC, electrical panel, plumbing, and water heater last replaced?
- Is there a deadline driving the sale (1031 exchange, divorce, estate, relocation)? That informs how much negotiation room exists.
- Schools are F-rated, which usually means shorter tenancies and higher turnover. Who's the typical renter profile here, and what's been the actual vacancy rate?
- Crime grade is D in this area — have there been break-ins, vandalism, or insurance claims at this property in the last 3 years? What carrier currently insures it and at what premium?
- What's the average days-on-market for RENTAL listings here right now (not sales)? A rising rental-DOM trend means longer vacancies and softer asking-rent achievability than the comps imply.
- What's the recent tenant-quality profile in this submarket — average credit score on applications, eviction rate, late-payment / NSF rate, and stable-employment percentage? A property-management company in the area should have these aggregated.
- How much new for-sale + rental construction is in the pipeline within 1–3 miles? Heavy new supply typically softens prices + rents 12–24 months out; constrained supply supports both.
Investment metrics
- 1% rule
- 1.09% ✓
- Cap rate
- 7.64%
- Cash-on-cash
- 4.82%
- DSCR
- 1.21
- GRM
- 7.6
CMA / ARV
- ARV (on-the-fly)
- $74,400
- Comps found
- 1
Show comp detail 1 sale within ~0.75 mi
| Address | Dist | Beds/Ba | Sqft | Sold | Price | $/sf | Match |
|---|---|---|---|---|---|---|---|
| 3013 Peoria St | 0.52mi | 2/1.0 (-1) | 615 (+2%) | 20mo | $76,125 | $124 | 48 |
Match score weights: distance 35% · size 25% · config 20% · recency 20%. Top-matched comps best support the ARV.
Projected returns pro-forma
-3.0% appreciation · 6.48% rent growth · sell at horizon
- IRR
- -4.6%
- Equity multiple
- 0.82×
- Total profit
- $-8,062
- Equity at exit
- $23,857
- IRR
- 8.9%
- Equity multiple
- 1.80×
- Total profit
- $35,955
- Equity at exit
- $13,834
Cash invested: $44,800 (down + closing). Projections, not guarantees.
Landlord ↔ Tenant lean methodology
- Overall (STATE)
- 43 Moderately Tenant-Leaning
- State Illinois
- 43 Moderately Tenant-Leaning · D+7
- County
- — inherits STATE
- City
- — inherits STATE
ZIP-level market 60411
- Home prices YoY
- -33.9%
- Rents YoY
- 6.5%
- Active inventory
- 222
- Price-to-rent
- 7.6×
Monthly cashflow live
- Estimated rent
- $1,746 medium interval (Pro) →
- Mortgage (P&I)
- −$839
- Tax from tax record
- −$293 /mo · $3,521/yr
- Insurance
- −$67
- HOA
- −$0
- Vacancy / Maint / Mgmt
- −$367
- Net cashflow
- $180
Break-even live
UW: 25.0% down · 7.5% · 30yr · 1.5% tax · 5.0% vac · 8.0% maint · 8.0% mgmt
Financing live
Cash to close
- Down payment
- $40,000
- Closing costs
- $4,800
- Reserves months
- —
- Total cash needed
- —
Loan-product check · same deal, 3 products live
Conventional
25% down · 7.5% · 30yr
- Down + closing
- —
- Monthly P&I
- —
- Monthly cashflow
- —
- DSCR
- —
- Eligible?
- —
Personal DTI + credit; lowest rate.
DSCR
20% down · 8.5% · 30yr
- Down + closing
- —
- Monthly P&I
- —
- Monthly cashflow
- —
- DSCR
- —
- Eligible?
- —
No personal income docs; deal must DSCR.
Hard money
10% down · 12.0% · 12mo
- Down + closing
- —
- Monthly P&I
- —
- Monthly cashflow
- —
- DSCR
- —
- Eligible?
- —
Short-term bridge; refi at stabilization.
Rent comps 2 comps
| Address | Beds | Baths | Sqft | Rent | $/sqft | DOM | Units | Dist |
|---|---|---|---|---|---|---|---|---|
| 22 E 35th St Steger, IL | 2.0 | 1.0 | 740 | $1,250 | $1.69 | 24d | 1 | 1.07mi |
| 316 W 34th St Steger, IL | 3.0 | 1.0–1.5 | 720 | $1,715 | $2.38 | 1d | 5 | 1.17mi |
Listing history 7 events
-
2026-06-17status $160,000 Pending 15 DOM
-
2026-06-17days on market $160,000 Active 15 DOM
-
2026-06-16days on market $160,000 Active 14 DOM
-
2026-06-15days on market $160,000 Active 13 DOM
-
2026-06-13days on market $160,000 Active 11 DOM
-
2026-06-13remarks 699-char remark
-
2026-06-13$160,000 Active 10 DOM
ⓘ Source: listings_history table (triggers on properties + properties_extension) + one-shot
backfill from property_details.listing_events for pre-trigger history.
Tax reassessment forecast IL · Partial reset (capped growth)
- Current annual tax
- $3,521 · $293/mo
- Projected year-2 tax
- $3,576 · $298/mo
- Expected delta
- +$56/yr (+$5/mo · 1.6%)
ⓘ Screening estimate from a state-policy table — verify with the county assessor before closing.
Climate risk First Street
- Flood 1/10 Low FEMA zone X (unshaded) · 0% chance over 30 yrs
- Wildfire 1/10 Low
- Heat 3/10 Moderate 7 d/yr ≥101°F today · 16 d/yr by 30 yrs out
- Wind 2/10 Low
- Air quality 2/10 Low 2 unhealthy d/yr today · 2 by 30 yrs out
Nearby sold comps map
Loading sold comps map…
Walkable amenities ~0.75 mi
Loading nearby amenities…
Taxation est. · year 1
- Rental income
- $20,947
- − Mortgage interest
- −$8,962
- − Property taxes
- −$3,521
- − Insurance
- −$800
- − Repairs & maintenance
- −$1,676
- − Management
- −$1,676
- − Depreciation
- −$4,655
- Taxable loss
- −$343
- Est. tax savings @ 24.0%
- +$82
- After-tax cash flow
- $2,241/yr
For passive investors: Depreciation is non-cash, so a rental often shows a tax loss while cash-flowing — sheltering income. Rental losses are passive: they offset passive income freely, and up to $25,000/yr can offset ordinary (W-2) income if you actively participate and your MAGI is under $100k (phasing out to $0 by $150k); unused losses carry forward. On sale, claimed depreciation is recaptured at up to 25%, and gains may owe capital-gains tax (a 1031 exchange can defer both). Figures are a year-1 estimate at your 24.0% rate — not tax advice; consult a CPA.
Schools (NCES district)
- District
- Bloom Twp Hsd 206
- NCES district ID
- 1706420
- Math proficiency
- 8% ▼ -3.00%
- Reading proficiency
- 9% ▼ -8.00%
- Median HH income
- $39,795
- Composite
- 7.4/100
- National rank
- #9952
- State rank
- #591 of 620 in IL
Livability — South Chicago Heights
- Score
- 76/100
- State rank
- #173
- US rank
- #3304
Category grades
Schools grade is shown separately in the Schools card above.
Census & demographics
- Census place
- South Chicago Heights, IL
- County
- Cook County · 4,486,803 people
- Metro
- Chicago-Naperville-Elgin, IL-IN-WI
- Population (ZIP)
- 52,175
- Household income
- $62,073
- Rent vs Own
- Severe rent burden
- 1714.0
Population outlook (Cook County) Hauer SSP2
- Today (2025)
- 5,347,519 people
- By 2030
- 5,357,703 · +0.2%
- By 2040
- 5,324,924 · -0.4%
- By 2050
- 5,230,762 · -2.2%
- By 2075
- 4,785,735 · -10.5%
- By 2100
- 4,188,836 · -21.7%
Race, ethnicity, and origin ACS 2023
- Neighborhood character
- Diverse neighborhood (Simpson 0.66)
- Race & ethnicity
- Black 49% Hispanic / Latino 26% White 19% Two or more races 11%
- Hispanic origin (detail)
- Mexican 22% Puerto Rican 2%
- Common ancestry
- Romanian 4% Portuguese 1% Lithuanian 1%
- Foreign-born
- 12% · Canada
- Languages at home
- 76% English-only · Spanish 21% Russian/Polish/Slavic 1% Other Indo-European 1%
Political lean MEDSL · Cook
- 2024 margin
- Solid D (+42.0) · D 70.4% · R 28.4% · Other 1.2%
- 2008→2024 swing
- -11.4pp toward R · 2008: 53.4pp · 2024: 42.0pp
- All cycles
- 2024: D+42.0 2020: D+50.3 2016: D+53.0 2012: D+49.4 2008: D+53.4
Not yet ingested
- Civics
- —
Market trends
- HPI YoY
- ▼ -108.75%
- Current HPI
- 212.4058
- Rent YoY
- ▲ 6.48%
- Metro
- Chicago-Naperville-Elgin, IL-IN-WI
- State GDP YoY
- ▲ 1.59%
- F500 in state
- 60
Industry mix (Fortune 500 HQ in IL)
| Industry | F500 HQs | Revenue |
|---|---|---|
| Insurance | 4 | $201B |
|
||
| Consumer Goods | 4 | $87B |
|
||
| Industrial Machinery | 3 | $64B |
|
||
| Healthcare | 2 | $55B |
|
||
| Retail / Pharmacy | 1 | $148B |
|
||
| Agriculture / Food | 1 | $86B |
|
||
Price history
+721.4% since first listed31 events — show timeline
- 2026-05-26 Listing Removed — MRED as Distributed by MLS Grid
- 2026-02-03 Listing Removed — MRED as Distributed by MLS Grid
- 2024-07-04 Listing Removed — MRED as Distributed by MLS Grid
- 2024-06-21 Relisted — MRED as Distributed by MLS Grid
- 2024-06-21 Price Changed — MRED as Distributed by MLS Grid
- 2024-04-15 Contingent — MRED as Distributed by MLS Grid
- 2024-04-11 Price Changed — MRED as Distributed by MLS Grid
- 2024-03-14 Price Changed — MRED as Distributed by MLS Grid
- 2024-02-26 Relisted — MRED as Distributed by MLS Grid
- 2024-02-19 Contingent — MRED as Distributed by MLS Grid
- 2024-02-15 Price Changed — MRED as Distributed by MLS Grid
- 2024-02-01 Price Changed — MRED as Distributed by MLS Grid
- 2024-01-25 Listed — MRED as Distributed by MLS Grid
- 2023-07-26 Listing Removed — MRED as Distributed by MLS Grid
- 2023-07-26 Relisted — MRED as Distributed by MLS Grid
- 2023-01-31 Listing Removed — MRED as Distributed by MLS Grid
- 2023-01-19 Listed — MRED as Distributed by MLS Grid
- 2021-07-29 Sold (Public Records) $115,000 Public Records
- 2021-07-08 Sold (MLS) $115,000 MRED as Distributed by MLS Grid
- 2021-05-19 Pending — MRED as Distributed by MLS Grid
- 2021-05-14 Relisted — MRED as Distributed by MLS Grid
- 2021-05-03 Pending — MRED as Distributed by MLS Grid
- 2021-04-29 Listed $100,000 MRED as Distributed by MLS Grid
- 2020-05-13 Sold (MLS) $25,000 MRED as Distributed by MLS Grid
- 2020-04-28 Pending — MRED as Distributed by MLS Grid
- 2020-04-27 Pending — MRED as Distributed by MLS Grid
- 2020-04-15 Price Changed $31,950 MRED as Distributed by MLS Grid
- 2020-03-23 Listed $29,950 MRED as Distributed by MLS Grid
- 2007-02-05 Sold (Public Records) $125,000 Public Records
- 1995-12-05 Sold (Public Records) $7,000 Public Records
- 1995-12-05 Sold (Public Records) $14,000 Public Records
Property tax history
+3.2%/yrLatest (2023): $3,521 · +33.2% YoY. Source: county tax records.
Cash-flow waterfall
monthlySold comps — $/sqft
last 12 mo · ≤1 miLoading sold comps…