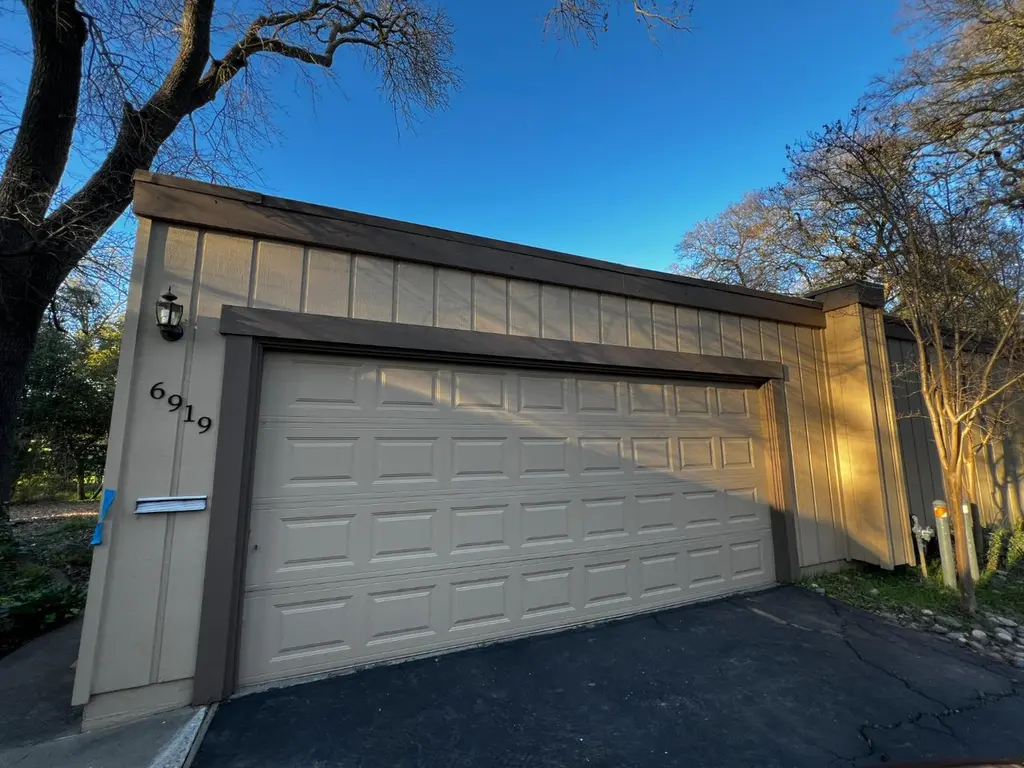
6919 Vera Cruz · Citrus Heights, CA
Flood risk 7/10 · Major
- FEMA flood zone
- X (shaded)
- Chance of flooding over 30 yrs
- 0.76%
- Est. flood insurance / yr
- $507 – $1,088
Fire risk 1/10 · Minimal
- Est. fire insurance / yr
- $659 – $1,223
Heat risk 7/10 · Major
- Hot days now (above 103°F)
- 6 days/yr
- Hot days in 30 yrs
- 14 days/yr
Wind risk 1/10 · Minimal
- Chance of severe wind over 30 yrs
- —
Air-quality risk 10/10 · Severe
- Unhealthy air days now
- 34 days/yr
- Unhealthy air days in 30 yrs
- 36 days/yr
Risk factors via First Street. Map © Google.
Why this score? — see what drove the D grade
The composite is a weighted blend of 9 inputs, each scored 0–100. Each bar is that input's sub-score; the figure is the points it added to the 100-point composite (weight × sub-score).
- Cash flow +11.6/30.0
- ARV discount +7.5/15.0
- 1% rule +7.2/10.0
- Schools +4.4/10.0
- DSCR +3.4/10.0
- Rent growth +3.0/5.0
- Livability +3.0/5.0
- Condition / age +2.5/5.0
- Appreciation +0.0/10.0
$225,000
🖨 Deal sheet 📄 Offer letter ✓ Due diligence
Listing remarks
Opportunity knocks in Citrus Heights! Welcome to 6919 Vera Cruz Ct, a property with great potential tucked away on a quiet cul-de-sac. This home offers a functional layout with generous living space and a sizable lot, providing a solid foundation for customization and improvement. Perfect for buyers looking to add their personal touch, this property presents an excellent chance to create value and make it your own. Conveniently located near shopping, dining, schools, and easy freeway access, the location adds to the home's long-term appeal. Whether you're an investor or a homeowner ready to bring your vision to life, this is a fantastic opportunity you won't want to miss.
Key facts
- 2,613 sq ft lot
- 2 garage spots
- Community pool
Neighborhood map
What this means for you Summary
Snapshot
- This is a 4-bed/2.5-bath condo listed at $225k.
Deal economics
- At list price, monthly cash flow is $-136 ($-2k/yr) — negative.
- To cash-flow at today's rent, offer at most $201k (10.7% below list).
- Meets the 1% rule at list price ($3k rent vs $225k).
- Recommended offer: $201k (10.7% below list) — sets the bar for cash-flow.
- Cap rate 5.9% vs local median 3.4% in Citrus Heights — top-decile yield for the area; either an underpriced asset or a hidden risk that comps aren't pricing in. Stress-test before assuming the spread holds.
Location & tenants
- Location reads 60/100 on livability (#614 in CA) — a middle-class / working-renter tenant base. Strengths: housing A+; Watch: schools D, crime D-, amenities F.
- San Juan Unified (suburban): math 40% / reading 62% proficiency, ranked #138 of 517 in CA (top 27%) — acceptable for families but not a draw, mixed tenant base, ~2y average lease.
- Market conditions: Rents rising (+1.9%/yr); 210 active listings in the ZIP; 17 comparable units currently listed for rent nearby; rentals at typical pace (median 24d on market — plan ~3-4 weeks tenant-placement turnaround); 41% of comp listings sitting > 30 days — soft ceiling on asking rent; solid renter incomes; 6,825 units permitted in Sacramento County in 2024 (1,752 in 5+ unit buildings).
- This rent runs 41% of the median local income ($81k/yr) — at the standard rent-burdened threshold; future hikes will face affordability resistance.
Forward outlook
- Local home prices are declining (-3.0%/yr); year-one equity from $2k of loan paydown is wiped out by about $7k of value loss. Plan a longer hold.
- Sacramento County population projected at +17% by 2050 — long-run rental-demand tailwind backs the buy-and-hold thesis.
Negotiation context
- Only 1 days on market — expect competitive offers; lowballing is unlikely to land.
Risks & watch-outs
- Watch-outs: flood insurance adds $66/mo.
- Climate carrying-cost: major flood risk; extreme-heat days projected 6→14/yr by 2055 (HVAC capex compounding) — expect insurance premiums to compound above CPI over the hold.
Questions for the listing agent
- What do current leases actually rent for vs. the listed asking? Can we see a recent rent roll and the last 12 months of T-12 income?
- Built in 1973 — when were the roof, HVAC, electrical panel, plumbing, and water heater last replaced?
- What's the actual annual flood-insurance premium (NFIP or private), and is the property in a SFHA with mandatory coverage?
- What does the HOA fee cover, when was the last increase, and are there any pending special assessments or reserve-fund shortfalls?
- Any open or pending special assessments — roof, HVAC, plumbing, elevator, façade? What's the per-unit balance and payoff schedule, and is the seller paying it off at close or rolling it to the buyer?
- Is there a deadline driving the sale (1031 exchange, divorce, estate, relocation)? That informs how much negotiation room exists.
- Schools are D-rated, which usually means shorter tenancies and higher turnover. Who's the typical renter profile here, and what's been the actual vacancy rate?
- Crime grade is D in this area — have there been break-ins, vandalism, or insurance claims at this property in the last 3 years? What carrier currently insures it and at what premium?
- The area grade is low — what's the realistic commute time and amenity access for the typical tenant pool here? Any planned neighborhood developments (good or bad) we should know about?
- What's the average days-on-market for RENTAL listings here right now (not sales)? A rising rental-DOM trend means longer vacancies and softer asking-rent achievability than the comps imply.
- What's the recent tenant-quality profile in this submarket — average credit score on applications, eviction rate, late-payment / NSF rate, and stable-employment percentage? A property-management company in the area should have these aggregated.
- How much new apartment / multifamily construction is in the pipeline within 1–3 miles? Heavy new supply (>2% of stock underway) typically softens rents 12–24 months out; light construction supports rent growth.
Investment metrics
- 1% rule
- 1.22% ✓
- Cap rate
- 5.92%
- Cash-on-cash
- -1.32%
- DSCR
- 0.94
- GRM
- 6.8
CMA / ARV
No comps found within radius.
Projected returns pro-forma
-3.0% appreciation · 1.9% rent growth · sell at horizon
- IRR
- -22.2%
- Equity multiple
- 0.24×
- Total profit
- $-47,614
- Equity at exit
- $33,548
- IRR
- -20.1%
- Equity multiple
- 0.01×
- Total profit
- $-62,628
- Equity at exit
- $19,454
Cash invested: $63,000 (down + closing). Projections, not guarantees.
Landlord ↔ Tenant lean methodology
- Overall (STATE)
- 18 Strongly Tenant-Friendly
- State California
- 18 Strongly Tenant-Friendly · D+13
- County
- — inherits STATE
- City
- — inherits STATE
ZIP-level market 95621
- Rents YoY
- 1.9%
- Active inventory
- 210
- Price-to-rent
- 6.8×
Monthly cashflow live
- Estimated rent
- $2,748 high interval (Pro) →
- Mortgage (P&I)
- −$1,180
- Tax from tax record
- −$449 /mo · $5,387/yr
- Insurance
- −$94
- Flood insurance flood zone
- −$66 /mo · $798/yr
- HOA
- −$518
- Vacancy / Maint / Mgmt
- −$577
- Net cashflow
- $-136
Break-even live
UW: 25.0% down · 7.5% · 30yr · 1.5% tax · 5.0% vac · 8.0% maint · 8.0% mgmt
Financing live
Cash to close
- Down payment
- $56,250
- Closing costs
- $6,750
- Reserves months
- —
- Total cash needed
- —
Loan-product check · same deal, 3 products live
Conventional
25% down · 7.5% · 30yr
- Down + closing
- —
- Monthly P&I
- —
- Monthly cashflow
- —
- DSCR
- —
- Eligible?
- —
Personal DTI + credit; lowest rate.
DSCR
20% down · 8.5% · 30yr
- Down + closing
- —
- Monthly P&I
- —
- Monthly cashflow
- —
- DSCR
- —
- Eligible?
- —
No personal income docs; deal must DSCR.
Hard money
10% down · 12.0% · 12mo
- Down + closing
- —
- Monthly P&I
- —
- Monthly cashflow
- —
- DSCR
- —
- Eligible?
- —
Short-term bridge; refi at stabilization.
Rent comps 17 comps
| Address | Beds | Baths | Sqft | Rent | $/sqft | DOM | Units | Dist |
|---|---|---|---|---|---|---|---|---|
| 6805 Castillo Ct Citrus Heights, CA | 4.0 | 3.0 | 1948 | $2,795 | $1.43 | 23d | 1 | 0.16mi |
| 6940 Trailride Way Citrus Heights, CA | 3.0 | 2.0 | 1527 | $2,695 | $1.76 | 43d | 1 | 0.38mi |
| 6948 Trailride Way Citrus Heights, CA | 4.0 | 3.0 | 1980 | $2,850 | $1.44 | 17d | 1 | 0.39mi |
| 7120 Van Maren Ln Citrus Heights, CA | 3.0 | 2.0 | 1292 | $2,495 | $1.93 | 17d | 1 | 0.57mi |
| 6687 Greenback Ln Citrus Heights, CA | 3.0 | 2.0 | 1323 | $2,495 | $1.89 | 17d | 1 | 0.69mi |
| 6948 Sunburst Way Citrus Heights, CA | 4.0 | 2.5 | 1673 | $3,000 | $1.79 | 43d | 1 | 0.72mi |
| 6319 Misty Wood Way Citrus Heights, CA | 3.0 | 2.0 | 1454 | $2,500 | $1.72 | 43d | 1 | 0.77mi |
| 6034 Centurion Cir Citrus Heights, CA | 4.0 | 2.0 | 1726 | $3,100 | $1.80 | 43d | 1 | 0.80mi |
| 6025 Dewey Dr Citrus Heights, CA | 3.0 | 2.0 | 1847 | $2,500 | $1.35 | 23d | 1 | 0.89mi |
| 6931 Cobblestone Way Citrus Heights, CA | 5.0 | 2.5 | 2409 | $3,500 | $1.45 | 7d | 1 | 0.92mi |
| 6219 Oak Valley Ln Citrus Heights, CA | 3.0 | 3.0 | 1304 | $2,295 | $1.76 | 17d | 1 | 0.97mi |
| 6219 Oak Valley Ln Citrus Heights, CA | 3.0 | 2.5 | 1304 | $2,295 | $1.76 | 43d | 1 | 0.97mi |
| 6203 Ackland Ct Citrus Heights, CA | 3.0 | 1.5 | 1322 | $2,500 | $1.89 | 23d | 1 | 0.99mi |
| 6558 Meadowcreek Way Citrus Heights, CA | 3.0 | 2.0 | 1304 | $2,500 | $1.92 | 43d | 1 | 1.00mi |
| 7632 Van Maren Ln Unit 1 Citrus Heights, CA | 4.0 | 2.0 | 1300 | $2,495 | $1.92 | 14d | 1 | 1.19mi |
| 6333 Aslin Way Carmichael, CA | 4.0 | 2.0 | 1257 | $2,750 | $2.19 | 43d | 1 | 1.44mi |
| 7711 Greenback Ln Citrus Heights, CA | 1.0–3.0 | 1.0–2.0 | 1016 | $2,644 | $2.60 | 1d | 15 | 1.45mi |
HOA detail condo
- Monthly dues
- $518 · $6,216/yr
- Assessments
- None detected in remarks — confirm with the listing agent.
Listing history 4 events
-
2026-06-10days on market $225,000 Pending 1 DOM
-
2026-04-14historical
-
2026-03-24$225,000
-
2023-08-25soldstatus $410,000
ⓘ Source: listings_history table (triggers on properties + properties_extension) + one-shot
backfill from property_details.listing_events for pre-trigger history.
Tax reassessment forecast CA · Resets to sale price
- Current annual tax
- $5,387 · $449/mo
- Projected year-2 tax
- $5,387 · $449/mo
- Expected delta
- $0/yr ($0/mo · 0.0%)
ⓘ Screening estimate from a state-policy table — verify with the county assessor before closing.
Climate risk First Street
- Flood 7/10 Severe FEMA zone X (shaded) · 76% chance over 30 yrs
- Wildfire 1/10 Low
- Heat 7/10 Severe 6 d/yr ≥103°F today · 14 d/yr by 30 yrs out
- Wind 1/10 Low
- Air quality 10/10 Extreme 34 unhealthy d/yr today · 36 by 30 yrs out
Nearby sold comps map
Loading sold comps map…
Walkable amenities ~0.75 mi
Loading nearby amenities…
Taxation est. · year 1
- Rental income
- $32,981
- − Mortgage interest
- −$12,603
- − Property taxes
- −$5,387
- − Insurance
- −$1,922
- − Repairs & maintenance
- −$2,638
- − Management
- −$2,638
- − HOA
- −$6,216
- − Depreciation
- −$6,545
- Taxable loss
- −$4,970
- Est. tax savings @ 24.0%
- +$1,193
- After-tax cash flow
- $-437/yr
For passive investors: Depreciation is non-cash, so a rental often shows a tax loss while cash-flowing — sheltering income. Rental losses are passive: they offset passive income freely, and up to $25,000/yr can offset ordinary (W-2) income if you actively participate and your MAGI is under $100k (phasing out to $0 by $150k); unused losses carry forward. On sale, claimed depreciation is recaptured at up to 25%, and gains may owe capital-gains tax (a 1031 exchange can defer both). Figures are a year-1 estimate at your 24.0% rate — not tax advice; consult a CPA.
Schools (NCES district)
- District
- San Juan Unified
- NCES district ID
- 0634620
- Math proficiency
- 40% ▲ 3.00%
- Reading proficiency
- 62% ▲ 16.00%
- Median HH income
- $55,655
- Composite
- 44.07/100
- National rank
- #2878
- State rank
- #138 of 517 in CA
Livability — Citrus Heights
- Score
- 60/100
- State rank
- #614
- US rank
- #19580
Category grades
Schools grade is shown separately in the Schools card above.
Census & demographics
- Census place
- Citrus Heights, CA
- County
- Sacramento County · 1,539,646 people
- City population
- 89,370
- Metro
- Sacramento-Roseville-Folsom, CA
- Population (ZIP)
- 42,442
- Household income
- $80,901
- Rent vs Own
- Severe rent burden
- 1854.0
Population outlook (Sacramento County) Hauer SSP2
- Today (2025)
- 1,660,763 people
- By 2030
- 1,732,990 · +4.3%
- By 2040
- 1,855,755 · +11.7%
- By 2050
- 1,941,335 · +16.9%
- By 2075
- 2,046,162 · +23.2%
- By 2100
- 1,961,444 · +18.1%
Race, ethnicity, and origin ACS 2023
- Neighborhood character
- Predominantly White (66%)
- Race & ethnicity
- White 66% Hispanic / Latino 19% Two or more races 11% Asian 6% Black 2%
- Hispanic origin (detail)
- Mexican 16%
- Common ancestry
- Subsaharan African 3% Lithuanian 3% Scotch-Irish 2%
- Foreign-born
- 15% · Canada, Vietnam
- Languages at home
- 78% English-only · Spanish 10% Russian/Polish/Slavic 6% Other Indo-European 3%
Political lean MEDSL · Sacramento
- 2024 margin
- D (+19.7) · D 58.1% · R 38.4% · Other 3.5%
- 2008→2024 swing
- +0.7pp no change · 2008: 19.0pp · 2024: 19.7pp
- All cycles
- 2024: D+19.7 2020: D+25.3 2016: D+23.7 2012: D+16.3 2008: D+19.0
Not yet ingested
- Civics
- —
Market trends
- HPI YoY
- ▼ -408.14%
- Current HPI
- 351.9333
- Rent YoY
- ▲ 1.90%
- Metro
- Sacramento-Roseville-Folsom, CA
- State GDP YoY
- ▲ 3.21%
- F500 in state
- 116
Industry mix (Fortune 500 HQ in CA)
| Industry | F500 HQs | Revenue |
|---|---|---|
| Technology | 27 | $1,492B |
|
||
| Financial Services | 3 | $174B |
|
||
| Retail | 3 | $44B |
|
||
| Insurance | 3 | $26B |
|
||
| Media / Entertainment | 2 | $115B |
|
||
| Pharmaceuticals / Biotech | 2 | $62B |
|
||
Price history
-45.1% since first listed3 events — show timeline
- 2026-04-14 Delisted — FRESNOMLS
- 2026-03-24 Listed $225,000 FRESNOMLS
- 2023-08-25 Sold (Public Records) $410,000 Public Records
Property tax history
+11.0%/yrLatest (2025): $5,387 · +9.2% YoY. Source: county tax records.
Cash-flow waterfall
monthlySold comps — $/sqft
last 12 mo · ≤1 miLoading sold comps…