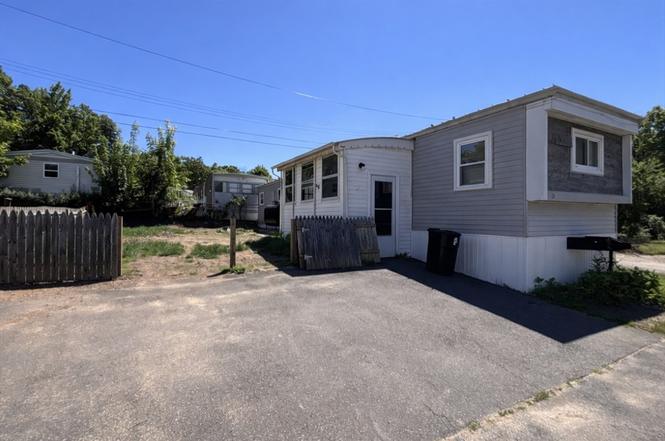
229 Miller St Unit C9 · Ludlow, MA
Flood risk 1/10 · Minimal
- FEMA flood zone
- X (unshaded)
- Chance of flooding over 30 yrs
- 0.0%
- Est. flood insurance / yr
- $507 – $1,088
Fire risk 3/10 · Minor
- Est. fire insurance / yr
- $915 – $1,699
Heat risk 4/10 · Minor
- Hot days now (above 96°F)
- 7 days/yr
- Hot days in 30 yrs
- 17 days/yr
Wind risk 5/10 · Moderate
- Chance of severe wind over 30 yrs
- 26.0%
Air-quality risk 3/10 · Minor
- Unhealthy air days now
- 2 days/yr
- Unhealthy air days in 30 yrs
- 4 days/yr
Risk factors via First Street. Map © Google.
Why this score? — see what drove the C- grade
The composite is a weighted blend of 9 inputs, each scored 0–100. Each bar is that input's sub-score; the figure is the points it added to the 100-point composite (weight × sub-score).
- Cash flow +23.9/30.0
- 1% rule +9.8/10.0
- DSCR +7.7/10.0
- Condition / age +4.0/5.0
- Schools +3.2/10.0
- Rent growth +2.5/5.0
- Livability +2.5/5.0
- ARV discount +0.0/15.0
- Appreciation +0.0/10.0
$134,900
🖨 Deal sheet (PDF) 📄 Offer letter ✓ Due diligence
Listing remarks
MUST SEE: Beautiful, spacious and newly renovated 2-bedroom, 1 bathroom home. Located in sought-after Hillside Valley Mobile Home Park, an all age community. Large kitchen, tons of cabinets, butcherblock counters and brand new stainless steel appliances. Brand new furnace, freshly painted with brand new hardwood flooring throughout one-level living. Small pets welcomed. New mail center and upgraded homes throughout the park. Low Monthly (HOA) Fee only $386 / month includes: water, sewer, all taxes, plowing and trash removal. Convenient and easy access to major routes, shopping, dining and entertainment. Vacant, on lockbox, very easy to show and no appointment needed. Move in ready & s
Key facts
- Hardwood flooring
- Large kitchen
- New mail center
Tags
Property features AI
Finance
- Other: Lot on a privately maintained paved road; Lot size approximately 0.07 acres; Located in Hillside Valley Mobile Home Park
- HOA & community: Homeowners association membership required; Association fee of $386; Community features include public transportation, shopping, highway access, and public school access; Not a senior community
Exterior
- Parking: Assigned paved parking; Exclusive open parking (2 spaces total)
- Utilities: Public water; Public sewer; Electric with circuit breakers and 100 Amp service; Gas connections available for range and oven
- Home design: Mobile home; Entry level: First floor; Gray exterior color
- Construction: Block foundation; Rubber roof; Year built: Unknown/Mixed (year source: owner)
- Exterior features: Covered patio/deck; Covered porch; Garden; Screens
Interior
- Kitchen: Range; Refrigerator; Freezer
- Bedrooms: Primary bedroom on the first floor; Second bedroom on the first floor
- Flooring: Vinyl flooring; Laminate flooring
- Bathrooms: 1 full bathroom on the first floor
- Heating & cooling: Central heating; Forced air; Oil-fired heating
- Interior features: Sun room; Insulated windows; Window screens; Total of 5 rooms
- Laundry & utility: Washer hookup
Neighborhood map
What this means for you Summary
Snapshot
- This is a 2-bed/1.0-bath manufactured listed at $135k. Condition is rated good.
Deal economics
- At list price, monthly cash flow is $262 ($3k/yr) — positive.
- The deal already cash-flows at list — no discount required.
- Meets the 1% rule at list price ($2k rent vs $135k).
Location & tenants
- Location reads: area grade C — affects rentability + tenant quality, not the cash-flow math above.
- Ludlow (suburban): math 30% / reading 40% proficiency, ranked #228 of 302 in MA (top 76%) — families likely to look elsewhere, expect single-tenant / working-renter base with shorter leases.
- Market conditions: 38 active listings in the ZIP; 1 comparable units currently listed for rent nearby; 453 units permitted in Hampden County in 2024 (116 in 5+ unit buildings).
Forward outlook
- Local home prices are declining (-3.0%/yr); year-one equity from $933 of loan paydown is wiped out by about $4k of value loss. Plan a longer hold.
- Hampden County population projected at +5% by 2050 — modest demand growth; plan on rents tracking national, not racing it.
Negotiation context
- Only 10 days on market — expect competitive offers; lowballing is unlikely to land.
Risks & watch-outs
- Climate carrying-cost: moderate wind risk, 26% chance of damaging wind over 30y — expect insurance premiums to compound above CPI over the hold.
Questions for the listing agent
- Built in 1972 — when were the roof, HVAC, electrical panel, plumbing, and water heater last replaced?
- What does the HOA fee cover, when was the last increase, and are there any pending special assessments or reserve-fund shortfalls?
- Is there a deadline driving the sale (1031 exchange, divorce, estate, relocation)? That informs how much negotiation room exists.
- What's the average days-on-market for RENTAL listings here right now (not sales)? A rising rental-DOM trend means longer vacancies and softer asking-rent achievability than the comps imply.
- What's the recent tenant-quality profile in this submarket — average credit score on applications, eviction rate, late-payment / NSF rate, and stable-employment percentage? A property-management company in the area should have these aggregated.
- How much new for-sale + rental construction is in the pipeline within 1–3 miles? Heavy new supply typically softens prices + rents 12–24 months out; constrained supply supports both.
Investment metrics
- 1% rule
- 1.48% ✓
- Cap rate
- 8.62%
- Cash-on-cash
- 8.32%
- DSCR
- 1.37
- GRM
- 5.6
CMA / ARV
- ARV (on-the-fly)
- $115,600
- Comps found
- 11
Show comp detail 11 sales within ~0.75 mi
| Address | Dist | Beds/Ba | Sqft | Sold | Price | $/sf | Match |
|---|---|---|---|---|---|---|---|
| 229 Miller St Unit 3 G | 0.06mi | 2/1.0 | 850 (0%) | 3mo | $116,000 | $136 | 95 |
| 229 Miller St Unit B-2 | 0.06mi | 2/1.0 | 850 (0%) | 5mo | $109,900 | $129 | 93 |
| 229 Miller St Unit D-13 | 0.03mi | 3/1.0 (+1) | 868 (+2%) | 9mo | $115,000 | $132 | 82 |
| 229 Miller Unit B-13 | 0.03mi | 2/1.0 | 900 (+6%) | 9mo | $70,000 | $78 | 81 |
| 229 Miller St Unit E-6 | 0.06mi | 2/1.0 | 768 (-10%) | 2mo | $107,000 | $139 | 79 |
| 229 Miller St Unit G1 | 0.05mi | 2/1.5 | 800 (-6%) | 9mo | $120,000 | $150 | 78 |
| 229 Miller St Unit C6 | 0.03mi | 3/1.0 (+1) | 800 (-6%) | 10mo | $117,500 | $147 | 75 |
| 229 Miller St Unit F13 | 0.05mi | 2/1.5 | 740 (-13%) | 2mo | $92,000 | $124 | 72 |
| 229 Miller St Unit G-7 | 0.05mi | 2/1.5 | 900 (+6%) | 18mo | $129,900 | $144 | 70 |
| 229 Miller St Unit E4 | 0.06mi | 3/1.0 (+1) | 949 (+12%) | 7mo | $130,000 | $137 | 67 |
| 229 Miller St Unit D-8 | 0.03mi | 3/1.0 (+1) | 930 (+9%) | 15mo | $115,000 | $124 | 66 |
Match score weights: distance 35% · size 25% · config 20% · recency 20%. Top-matched comps best support the ARV.
Projected returns pro-forma
-3.0% appreciation · 3.0% rent growth · sell at horizon
- IRR
- -3.5%
- Equity multiple
- 0.87×
- Total profit
- $-4,922
- Equity at exit
- $20,114
- IRR
- 6.4%
- Equity multiple
- 1.48×
- Total profit
- $18,266
- Equity at exit
- $11,664
Cash invested: $37,772 (down + closing). Projections, not guarantees.
Landlord ↔ Tenant lean methodology
- Overall (STATE)
- 20 Strongly Tenant-Friendly
- State Massachusetts
- 20 Strongly Tenant-Friendly · D+15
- County
- — inherits STATE
- City
- — inherits STATE
ZIP-level market 01056
- Home prices YoY
- -31.1%
- Active inventory
- 38
- Price-to-rent
- 5.6×
Monthly cashflow live
- Estimated rent
- $2,000 medium interval (Pro) →
- Mortgage (P&I)
- −$707
- Tax est. 1.5%
- −$169 /mo · $2,024/yr
- Insurance
- −$56
- HOA
- −$386
- Vacancy / Maint / Mgmt
- −$420
- Net cashflow
- $262
Break-even live
Sensitivity live
| Price | -10% $355 | -5% $308 | +0% $262 | +5% $215 | +10% $169 |
|---|---|---|---|---|---|
| Rent | -10% $104 | -5% $183 | +0% $262 | +5% $341 | +10% $420 |
| Rate | -1.0pp $330 | -0.5pp $296 | base $262 | +0.5pp $227 | +1.0pp $191 |
UW: 25.0% down · 7.5% · 30yr · 1.5% tax · 5.0% vac · 8.0% maint · 8.0% mgmt
Financing live
Cash to close
- Down payment
- $33,725
- Closing costs
- $4,047
- Reserves months
- —
- Total cash needed
- —
Loan-product check · same deal, 3 products live
Conventional
25% down · 7.5% · 30yr
- Down + closing
- —
- Monthly P&I
- —
- Monthly cashflow
- —
- DSCR
- —
- Eligible?
- —
Personal DTI + credit; lowest rate.
DSCR
20% down · 8.5% · 30yr
- Down + closing
- —
- Monthly P&I
- —
- Monthly cashflow
- —
- DSCR
- —
- Eligible?
- —
No personal income docs; deal must DSCR.
Hard money
10% down · 12.0% · 12mo
- Down + closing
- —
- Monthly P&I
- —
- Monthly cashflow
- —
- DSCR
- —
- Eligible?
- —
Short-term bridge; refi at stabilization.
Rent comps 1 comps
| Address | Beds | Baths | Sqft | Rent | $/sqft | DOM | Units | Dist |
|---|---|---|---|---|---|---|---|---|
| 2597 Boston Rd Unit 1 Wilbraham, MA | 1.0 | 1.0 | 720 | $2,000 | $2.78 | 20d | 1 | 1.35mi |
HOA detail
- Monthly dues
- $386 · $4,632/yr
- Likely covers
- watersewertrash
Listing history 9 events
-
2026-06-18days on market $134,900 Active 10 DOM
-
2026-06-17days on market $134,900 Active 9 DOM
-
2026-06-16days on market $134,900 Active 8 DOM
-
2026-06-15statusdays on market $134,900 Active 7 DOM
-
2026-06-14days on market $134,900 Price Changed 5 DOM
-
2026-06-13pricestatusdays on market $134,900 Price Changed 4 DOM
-
2026-06-10days on market $124,900 New 2 DOM
-
2026-06-09remarks 695-char remark
-
2026-06-09$124,900 New 1 DOM
ⓘ Source: listings_history table (triggers on properties + properties_extension) + one-shot
backfill from property_details.listing_events for pre-trigger history.
Climate risk First Street
- Flood 1/10 Low FEMA zone X (unshaded) · 0% chance over 30 yrs
- Wildfire 3/10 Moderate
- Heat 4/10 Moderate 7 d/yr ≥96°F today · 17 d/yr by 30 yrs out
- Wind 5/10 Major 26% chance of damaging wind over 30 yrs
- Air quality 3/10 Moderate 2 unhealthy d/yr today · 4 by 30 yrs out
Nearby sold comps map
Loading sold comps map…
Walkable amenities ~0.75 mi
Loading nearby amenities…
Taxation est. · year 1
- Rental income
- $24,000
- − Mortgage interest
- −$7,556
- − Property taxes
- −$2,024
- − Insurance
- −$674
- − Repairs & maintenance
- −$1,920
- − Management
- −$1,920
- − HOA
- −$4,632
- − Depreciation
- −$3,924
- Taxable income
- $1,349
- Est. tax owed @ 24.0%
- −$324
- After-tax cash flow
- $2,817/yr
For passive investors: Depreciation is non-cash, so a rental often shows a tax loss while cash-flowing — sheltering income. Rental losses are passive: they offset passive income freely, and up to $25,000/yr can offset ordinary (W-2) income if you actively participate and your MAGI is under $100k (phasing out to $0 by $150k); unused losses carry forward. On sale, claimed depreciation is recaptured at up to 25%, and gains may owe capital-gains tax (a 1031 exchange can defer both). Figures are a year-1 estimate at your 24.0% rate — not tax advice; consult a CPA.
Condition & rehab AI · 12 photos
This move-in ready manufactured home in Hillside Valley Mobile Home Park is in excellent condition with new appliances, flooring, and a fresh paint job. It's a great investment opportunity with high rental potential.
Value-add opportunities
- Both Painting exterior — Enhances curb appeal and value
- Both Landscaping — Improves curb appeal and rental value
- Both Add a small front porch — Enhances curb appeal and rental value
Renovation cost estimate screening
Value-add ROI direction
- Both Painting exterior — Enhances curb appeal and value ↑
- Both Landscaping — Improves curb appeal and rental value ↑
- Both Add a small front porch — Enhances curb appeal and rental value ↑
ⓘ Cost ranges are severity-bucket heuristics (US national rule-of-thumb). Get contractor quotes + a written scope before underwriting a rehab budget.
Schools (NCES district)
- District
- Ludlow
- NCES district ID
- 2507050
- Math proficiency
- 30% ▼ -16.00%
- Reading proficiency
- 40% ▼ -5.00%
- Median HH income
- $62,637
- Composite
- 31.52/100
- National rank
- #5965
- State rank
- #228 of 302 in MA
Livability — Ludlow
No livability data for this city. (Only ~50 U.S. cities are tracked.)
Census & demographics
- Population (ZIP)
- 20,846
Population outlook (Hampden County) Hauer SSP2
- Today (2025)
- 485,646 people
- By 2030
- 491,517 · +1.2%
- By 2040
- 500,539 · +3.1%
- By 2050
- 508,827 · +4.8%
- By 2075
- 539,167 · +11.0%
- By 2100
- 545,698 · +12.4%
Race, ethnicity, and origin ACS 2023
- Neighborhood character
- Predominantly White (85%)
- Race & ethnicity
- White 85% Hispanic / Latino 10% Two or more races 7% Black 2%
- Hispanic origin (detail)
- Puerto Rican 7%
- Common ancestry
- Russian 23% Romanian 14% Lithuanian 12%
- Foreign-born
- 16% · Canada
- Languages at home
- 73% English-only · Other Indo-European 15% Spanish 6% Other Asian/Pacific 2%
Political lean MEDSL · Hampden
- 2024 margin
- Lean D (+8.9) · D 53.4% · R 44.5% · Other 2.1%
- 2008→2024 swing
- -16.4pp toward R · 2008: 25.3pp · 2024: 8.9pp
- All cycles
- 2024: D+8.9 2020: D+17.7 2016: D+16.0 2012: D+25.4 2008: D+25.3
Not yet ingested
- Civics
- —
Market trends
- HPI YoY
- ▼ -121.64%
- Current HPI
- 269.7061
- Rent YoY
- —
- Metro
- —
- State GDP YoY
- ▲ 2.28%
- F500 in state
- 38
Industry mix (Fortune 500 HQ in MA)
| Industry | F500 HQs | Revenue |
|---|---|---|
| Technology | 3 | $17B |
|
||
| Insurance | 2 | $84B |
|
||
| Retail | 2 | $76B |
|
||
| Life Sciences | 1 | $43B |
|
||
| Energy Technology | 1 | $31B |
|
||
| Aerospace / Defense | 1 | $18B |
|
||
Price history
1 event — show timeline
- 2026-06-08 Listed $124,900 MLS PIN
Cash-flow waterfall
monthlySold comps — $/sqft
last 12 mo · ≤1 miLoading sold comps…