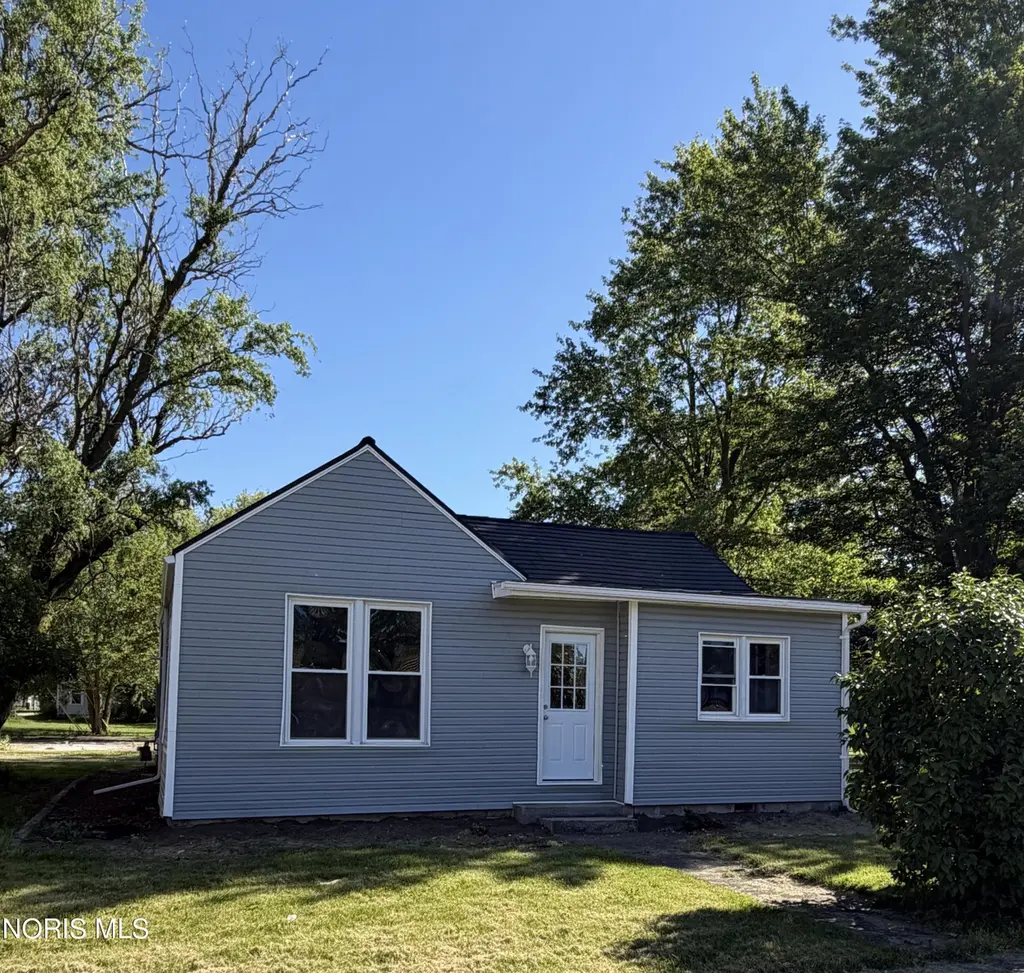
416 Railway Ave · Holgate, OH
Flood risk 1/10 · Minimal
- FEMA flood zone
- —
- Chance of flooding over 30 yrs
- 0.0%
- Est. flood insurance / yr
- —
Fire risk 1/10 · Minimal
- Est. fire insurance / yr
- $713 – $1,323
Heat risk 3/10 · Minor
- Hot days now (above 99°F)
- 7 days/yr
- Hot days in 30 yrs
- 17 days/yr
Wind risk 2/10 · Minimal
- Chance of severe wind over 30 yrs
- —
Air-quality risk 2/10 · Minimal
- Unhealthy air days now
- 1 days/yr
- Unhealthy air days in 30 yrs
- 2 days/yr
Risk factors via First Street. Map © Google.
Why this score? — see what drove the D grade
The composite is a weighted blend of 9 inputs, each scored 0–100. Each bar is that input's sub-score; the figure is the points it added to the 100-point composite (weight × sub-score).
- Cash flow +12.7/30.0
- Appreciation +10.0/10.0
- Schools +6.3/10.0
- DSCR +3.8/10.0
- Livability +3.6/5.0
- 1% rule +2.7/10.0
- Rent growth +2.5/5.0
- Condition / age +2.5/5.0
- ARV discount +0.0/15.0
$146,900
🖨 Deal sheet 📄 Offer letter ✓ Due diligence
Listing remarks MLS
Would you like to own a budget friendly piece of real estate? If so, right here it is! A little TLC would make a great home that would be cheaper than rent. Newer furnace, tankless water heater, plumbing, breaker box, and metal roof (except over front porch and kitchen). This home is located close to the grocery store, library, park, and two places to eat.
Key facts
- 0.4 acre lot
- Built 1900
- Listed 12 days
Property features AI
Exterior
- Parking: Alley access; Driveway; Off-street and paved parking; Concrete and gravel surfaces
- Utilities: Public water; Public sewer; Other utilities listed
- Home design: Single-family residence; One level / single-story; No attached units and no common walls
- Construction: Vinyl siding; Crawl space foundation; Built with vinyl siding
- Exterior features: Metal and shingle roof; 0.4-acre lot
Interior
- Kitchen: Electric cooktop; Refrigerator; Water heater (listed with appliances)
- Bedrooms: Bedroom 2 on the main level (approx. 11 x 9); Bedroom 3 on the main level (approx. 13 x 9)
- Flooring: Vinyl flooring
- Bathrooms: 1 full bathroom
- Heating & cooling: Central heating
- Interior features: Seven total rooms; Other interior features
- Laundry & utility: Main-level laundry; Utility room on the main level (approx. 14 x 14)
Neighborhood map
What this means for you Summary
Snapshot
- This is a 3-bed/1.0-bath single-family listed at $147k.
Deal economics
- At list price, monthly cash flow is $-15 ($-183/yr) — negative.
- To cash-flow at today's rent, offer at most $144k (1.8% below list).
- To meet the 1% rule (rent ≥ 1% of price), the offer needs to be $113k (22.8% below list).
- Recommended offer: $113k (22.8% below list) — sets the bar for 1% rule.
Location & tenants
- Location reads 72/100 on livability (#394 in OH) — a middle-class / working-renter tenant base. Strengths: crime A+, cost of living A+, housing A+; Watch: amenities F, commute F, health & safety F.
- Holgate Local (rural): math 76% / reading 73% proficiency, ranked #106 of 656 in OH (top 16%) — strong family-tenant draw, lease renewals of 3-5y typical.
- Zoned schools: Holgate Elementary School (math 82% / reading 77%, grade A, #173 of 1,584 statewide, top 12%, 165 students, 0% FRL); Holgate High School (math 72% / reading 72%, grade B+, #89 of 781 statewide, top 12%, 235 students, 46% FRL) — zoned schools average 23% FRL vs 42% district-wide (19 pts lower); this property's tenant base skews higher-income than the district average.
- Market conditions: 6 active listings in the ZIP; 18 units permitted in Henry County in 2024 (0 in 5+ unit buildings).
Forward outlook
- In year one you build about $16k of equity ($1k loan paydown + $15k appreciation (10.0% local appreciation)).
- Henry County population projected at -14% by 2050 — secular population decline; favor cash flow + early exit over multi-decade hold.
- At projected returns (10.0% appreciation + 3.0% rent growth), your $41k cash investment doubles in ~3 years — after that, you're playing with house money.
- By year 3, paydown + projected appreciation supports a ~$40k cash-out refi (75% LTV) — recoverable capital for the next deal without selling this one.
Negotiation context
- Only 12 days on market — expect competitive offers; lowballing is unlikely to land.
- 4 sale attempts since 24y ago; this cycle's ask is 126% above the opening price — seller raised mid-cycle; expect resistance to lowballs.
- Current owner paid $55k; list at $147k implies a 167% gain — meaningful room to come down on a strong offer.
Risks & watch-outs
- Watch-outs: built in 1900 — expect roof / HVAC / electrical / plumbing capex.
Questions for the listing agent
- What do current leases actually rent for vs. the listed asking? Can we see a recent rent roll and the last 12 months of T-12 income?
- Built in 1900 — when were the roof, HVAC, electrical panel, plumbing, and water heater last replaced?
- Is there a deadline driving the sale (1031 exchange, divorce, estate, relocation)? That informs how much negotiation room exists.
- Schools are B-rated — typically a magnet for longer-tenancy family renters. What's the average tenant stay here, and is there a school-zone premium baked into asking?
- The area grade is low — what's the realistic commute time and amenity access for the typical tenant pool here? Any planned neighborhood developments (good or bad) we should know about?
- What's the average days-on-market for RENTAL listings here right now (not sales)? A rising rental-DOM trend means longer vacancies and softer asking-rent achievability than the comps imply.
- What's the recent tenant-quality profile in this submarket — average credit score on applications, eviction rate, late-payment / NSF rate, and stable-employment percentage? A property-management company in the area should have these aggregated.
- How much new for-sale + rental construction is in the pipeline within 1–3 miles? Heavy new supply typically softens prices + rents 12–24 months out; constrained supply supports both.
Investment metrics
- 1% rule
- 0.77% ✗
- Cap rate
- 6.17%
- Cash-on-cash
- -0.45%
- DSCR
- 0.98
- GRM
- 10.8
CMA / ARV
- ARV (on-the-fly)
- $98,021
- Comps found
- 6
Show comp detail 6 sales within ~0.75 mi
| Address | Dist | Beds/Ba | Sqft | Sold | Price | $/sf | Match |
|---|---|---|---|---|---|---|---|
| 416 Railway Ave | 0.00mi | 3/1.0 | 1,273 (0%) | 2mo | $55,000 | $43 | 99 |
| 221 Randolph St | 0.15mi | 3/2.0 | 1,296 (+2%) | 15mo | $100,000 | $77 | 73 |
| 422 N Wilhelm St | 0.34mi | 4/1.0 (+1) | 1,312 (+3%) | 4mo | $97,000 | $74 | 71 |
| 309 N Wilhelm St | 0.27mi | 3/1.0 | 1,200 (-6%) | 11mo | $25,000 | $21 | 69 |
| 413 Kaufman St | 0.34mi | 4/1.0 (+1) | 1,205 (-5%) | 2mo | $99,900 | $83 | 68 |
| 324 Marion Ave | 0.26mi | 3/1.5 | 1,144 (-10%) | 2mo | $165,000 | $144 | 67 |
Match score weights: distance 35% · size 25% · config 20% · recency 20%. Top-matched comps best support the ARV.
Projected returns pro-forma
10.0% appreciation · 3.0% rent growth · sell at horizon
- IRR
- 23.9%
- Equity multiple
- 2.92×
- Total profit
- $78,986
- Equity at exit
- $132,339
- IRR
- 21.2%
- Equity multiple
- 6.67×
- Total profit
- $233,273
- Equity at exit
- $285,394
Cash invested: $41,132 (down + closing). Projections, not guarantees.
Landlord ↔ Tenant lean methodology
- Overall (STATE)
- 73 Landlord-Friendly
- State Ohio
- 73 Landlord-Friendly · R+6
- County
- — inherits STATE
- City
- — inherits STATE
ZIP-level market 43527
- Home prices YoY
- 8.5%
- Active inventory
- 6
- Price-to-rent
- 10.8×
Monthly cashflow live
- Estimated rent
- $1,133 medium interval (Pro) →
- Mortgage (P&I)
- −$770
- Tax from tax record
- −$79 /mo · $950/yr
- Insurance
- −$61
- HOA
- −$0
- Vacancy / Maint / Mgmt
- −$238
- Net cashflow
- $-15
Break-even live
UW: 25.0% down · 7.5% · 30yr · 1.5% tax · 5.0% vac · 8.0% maint · 8.0% mgmt
Financing live
Cash to close
- Down payment
- $36,725
- Closing costs
- $4,407
- Reserves months
- —
- Total cash needed
- —
Loan-product check · same deal, 3 products live
Conventional
25% down · 7.5% · 30yr
- Down + closing
- —
- Monthly P&I
- —
- Monthly cashflow
- —
- DSCR
- —
- Eligible?
- —
Personal DTI + credit; lowest rate.
DSCR
20% down · 8.5% · 30yr
- Down + closing
- —
- Monthly P&I
- —
- Monthly cashflow
- —
- DSCR
- —
- Eligible?
- —
No personal income docs; deal must DSCR.
Hard money
10% down · 12.0% · 12mo
- Down + closing
- —
- Monthly P&I
- —
- Monthly cashflow
- —
- DSCR
- —
- Eligible?
- —
Short-term bridge; refi at stabilization.
Listing history 12 events
-
2026-06-18days on market $146,900 Active 12 DOM
-
2026-06-17days on market $146,900 Active 11 DOM
-
2026-06-16days on market $146,900 Active 10 DOM
-
2026-06-15days on market $146,900 Active 9 DOM
-
2026-06-13days on market $146,900 Active 7 DOM
-
2026-06-12days on market $146,900 Active 6 DOM
-
2026-06-09days on market $146,900 Active 3 DOM
-
2026-06-08days on market $146,900 Active 2 DOM
-
2026-06-08statusdays on market $146,900 Active 1 DOM
-
2026-06-05days on market $146,900 Coming Soon 3 DOM
-
2026-06-03remarks 443-char remark
-
2026-06-03$146,900 Coming Soon 1 DOM
ⓘ Source: listings_history table (triggers on properties + properties_extension) + one-shot
backfill from property_details.listing_events for pre-trigger history.
Tax reassessment forecast OH · Partial reset (capped growth)
- Current annual tax
- $950 · $79/mo
- Projected year-2 tax
- $1,621 · $135/mo
- Expected delta
- +$671/yr (+$56/mo · 70.6%)
ⓘ Screening estimate from a state-policy table — verify with the county assessor before closing.
Climate risk First Street
- Flood 1/10 Low 0% chance over 30 yrs
- Wildfire 1/10 Low
- Heat 3/10 Moderate 7 d/yr ≥99°F today · 17 d/yr by 30 yrs out
- Wind 2/10 Low
- Air quality 2/10 Low 1 unhealthy d/yr today · 2 by 30 yrs out
Nearby sold comps map
Loading sold comps map…
Walkable amenities ~0.75 mi
Loading nearby amenities…
Taxation est. · year 1
- Rental income
- $13,602
- − Mortgage interest
- −$8,229
- − Property taxes
- −$950
- − Insurance
- −$734
- − Repairs & maintenance
- −$1,088
- − Management
- −$1,088
- − Depreciation
- −$4,273
- Taxable loss
- −$2,761
- Est. tax savings @ 24.0%
- +$663
- After-tax cash flow
- $479/yr
For passive investors: Depreciation is non-cash, so a rental often shows a tax loss while cash-flowing — sheltering income. Rental losses are passive: they offset passive income freely, and up to $25,000/yr can offset ordinary (W-2) income if you actively participate and your MAGI is under $100k (phasing out to $0 by $150k); unused losses carry forward. On sale, claimed depreciation is recaptured at up to 25%, and gains may owe capital-gains tax (a 1031 exchange can defer both). Figures are a year-1 estimate at your 24.0% rate — not tax advice; consult a CPA.
Schools (NCES district)
- District
- Holgate Local
- NCES district ID
- 3904757
- Math proficiency
- 76% ▼ -2.00%
- Reading proficiency
- 73% ▼ -1.00%
- Median HH income
- $52,077
- Composite
- 63.32/100
- National rank
- #627
- State rank
- #106 of 656 in OH
Livability — Holgate
- Score
- 72/100
- State rank
- #394
- US rank
- #6468
Category grades
Schools grade is shown separately in the Schools card above.
Census & demographics
- Census place
- Holgate, OH
- County
- Henry · 27,211 people
- Population (ZIP)
- 2,092
- Household income
- $63,698
- Rent vs Own
- Severe rent burden
- 19.4
Population outlook (Henry County) Hauer SSP2
- Today (2025)
- 27,204 people
- By 2030
- 26,657 · -2.0%
- By 2040
- 25,149 · -7.6%
- By 2050
- 23,361 · -14.1%
- By 2075
- 20,409 · -25.0%
- By 2100
- 18,199 · -33.1%
Race, ethnicity, and origin ACS 2023
- Neighborhood character
- Predominantly White (90%)
- Race & ethnicity
- White 90% Hispanic / Latino 9% Two or more races 6%
- Hispanic origin (detail)
- Mexican 8%
- Common ancestry
- Italian 2% Slovak 2% Lithuanian 1%
- Foreign-born
- 1%
- Languages at home
- 96% English-only · Spanish 4%
Political lean MEDSL · Henry
- 2024 margin
- Solid R (+46.7) · D 26.2% · R 72.9%
- 2008→2024 swing
- -33.8pp toward R · 2008: -12.9pp · 2024: -46.7pp
- All cycles
- 2024: R+46.7 2020: R+43.5 2016: R+39.8 2012: R+18.6 2008: R+12.9
Not yet ingested
- Civics
- —
Market trends
- HPI YoY
- ▲ 17.42%
- Current HPI
- 221.8347
- Rent YoY
- —
- Metro
- —
- State GDP YoY
- ▲ 1.98%
- F500 in state
- 48
Industry mix (Fortune 500 HQ in OH)
| Industry | F500 HQs | Revenue |
|---|---|---|
| Insurance | 3 | $145B |
|
||
| Industrial Machinery | 3 | $49B |
|
||
| Financial Services | 3 | $24B |
|
||
| Consumer Goods | 2 | $93B |
|
||
| Aerospace / Defense | 2 | $47B |
|
||
| Utilities | 2 | $33B |
|
||
Price history
+352.0% since first listed16 events — show timeline
- 2026-06-02 Coming Soon $146,900 NORIS
- 2026-05-01 Sold (Public Records) $55,000 Public Records
- 2026-04-30 Sold (MLS) $55,000 NORIS
- 2026-04-03 Pending — NORIS
- 2026-03-30 Listed $65,000 NORIS
- 2025-10-14 Price Changed $60,000 NORIS
- 2025-10-14 Price Changed $21,000 NORIS
- 2016-09-29 Sold (MLS) $21,000 NORIS
- 2016-06-16 Listed $24,900 NORIS
- 2003-05-28 Sold (Public Records) $60,000 Public Records
- 2003-05-28 Sold (MLS) $60,000 NORIS
- 2003-03-14 Listed $62,000 NORIS
- 2003-03-05 Listing Removed — NORIS
- 2002-10-05 Listed $62,000 NORIS
- 1998-08-25 Sold (Public Records) $55,000 Public Records
- 1991-08-07 Sold (Public Records) $32,500 Public Records
Property tax history
-3.7%/yrLatest (2025): $950 · -0.5% YoY. Source: county tax records.
Cash-flow waterfall
monthlySold comps — $/sqft
last 12 mo · ≤1 miLoading sold comps…