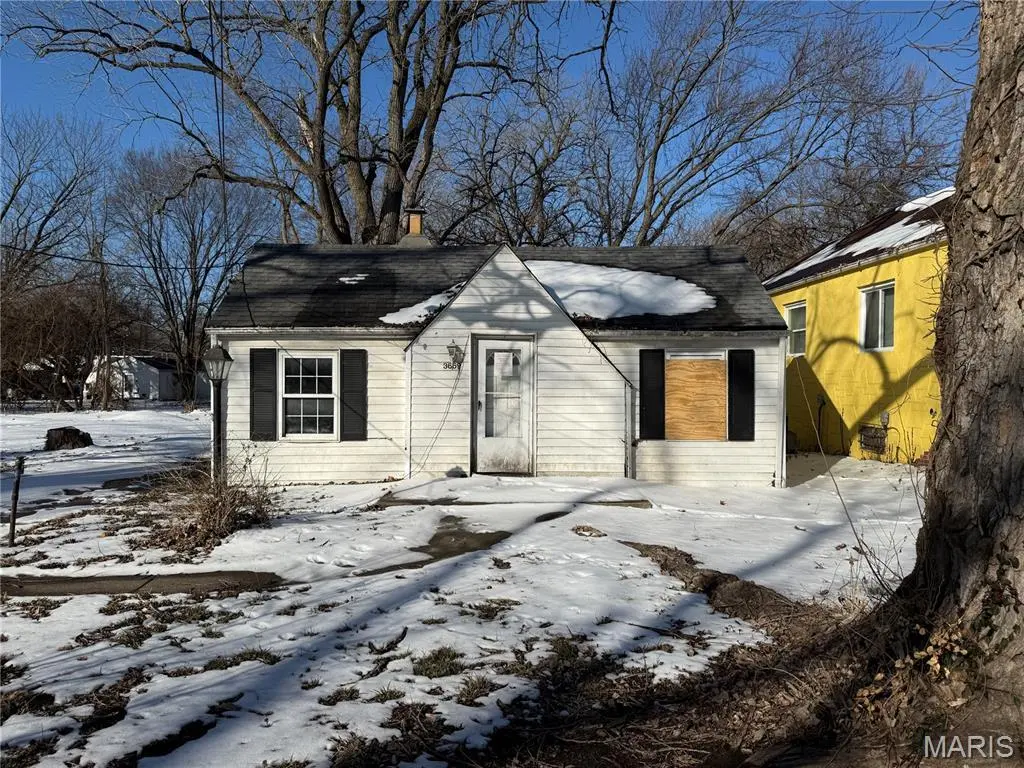
3669 Isolda Ave · Breckenridge Hills, MO
Flood risk 5/10 · Moderate
- FEMA flood zone
- AE
- Chance of flooding over 30 yrs
- 0.5%
- Est. flood insurance / yr
- $1,737 – $8,500
Fire risk 1/10 · Minimal
- Est. fire insurance / yr
- $1,054 – $1,958
Heat risk 4/10 · Minor
- Hot days now (above 106°F)
- 7 days/yr
- Hot days in 30 yrs
- 21 days/yr
Wind risk 2/10 · Minimal
- Chance of severe wind over 30 yrs
- 1.0%
Air-quality risk 2/10 · Minimal
- Unhealthy air days now
- 1 days/yr
- Unhealthy air days in 30 yrs
- 3 days/yr
Risk factors via First Street. Map © Google.
Why this score? — see what drove the D grade
The composite is a weighted blend of 9 inputs, each scored 0–100. Each bar is that input's sub-score; the figure is the points it added to the 100-point composite (weight × sub-score).
- Cash flow +15.0/30.0
- ARV discount +7.5/15.0
- 1% rule +5.0/10.0
- DSCR +5.0/10.0
- Rent growth +3.5/5.0
- Livability +3.4/5.0
- Condition / age +2.5/5.0
- Schools +1.7/10.0
- Appreciation +0.0/10.0
$25,000
🖨 Deal sheet 📄 Offer letter ✓ Due diligence
Listing remarks MLS
Unlock the potential of this 1 bed, 1 bath ranch offering 784 sq ft of opportunity. Whether you’re an investor, renovator, or buyer seeking sweat equity, this property delivers a rare chance to add value from the ground up. Featuring central HVAC, vinyl siding, and an architectural shingle roof, key exterior components are already in place. The interior is ready for a full transformation—no utilities are on, so bring flashlights and proceed with caution due to areas of subfloor damage. With a simple layout and manageable size, this home is primed for renovation, rental income, or resale. A true blank slate with endless possibilities for the right vision.
Key facts
- Central hvac
- Vinyl siding
- 5,950 sq ft lot
Tags
Neighborhood map
What this means for you Summary
Snapshot
- This is a 1-bed/1.0-bath single-family listed at $25k.
Deal economics
- At list price, monthly cash flow is $253 ($3k/yr) — positive.
- The deal already cash-flows at list — no discount required.
- Meets the 1% rule at list price ($1k rent vs $25k).
- Recommended offer: $22k (12.0% below list) — sets the bar for market timing.
Location & tenants
- Location reads 68/100 on livability (#193 in MO) — a middle-class / working-renter tenant base. Strengths: cost of living A+, housing A+; Watch: crime C-, employment D+, schools F.
- Ritenour (suburban): math 13% / reading 27% proficiency, ranked #304 of 324 in MO (top 94%) — low school quality limits family demand, transient renter base, plan for 1-2y turnover; 66% free/reduced lunch — lower-income household profile, screen leases tightly.
- Market conditions: Rents rising fast (+4.1%/yr); 61 active listings in the ZIP; 32 comparable units currently listed for rent nearby; rentals lingering (median 44d on market — plan ~5-8 weeks vacancy on turnover, expect pricing pressure); 53% of comp listings sitting > 30 days — soft ceiling on asking rent; 920 units permitted in St. Louis County in 2024 (250 in 5+ unit buildings).
Forward outlook
- Local home prices are declining (-3.0%/yr); year-one equity from $173 of loan paydown is wiped out by about $750 of value loss. Plan a longer hold.
- At projected returns (-3.0% appreciation + 4.1% rent growth), your $7k cash investment doubles in ~3 years — after that, you're playing with house money.
Negotiation context
- It's been on market 132 days — a 12% lower offer ($22k) is reasonable based on typical stale-listing flexibility.
Risks & watch-outs
- Watch-outs: property tax is 3.7% of price; flood insurance adds $427/mo; built in 1940 — expect roof / HVAC / electrical / plumbing capex.
- Climate carrying-cost: in FEMA flood zone AE (mandatory federal flood insurance) — expect insurance premiums to compound above CPI over the hold.
Questions for the listing agent
- It's been on market 132 days. Have you received any prior offers? Is the seller open to a 12% concession, seller financing, or rate buy-down credit?
- Built in 1940 — when were the roof, HVAC, electrical panel, plumbing, and water heater last replaced?
- Property tax is high relative to price — has the assessment been appealed recently, and will the sale trigger a re-assessment?
- What's the actual annual flood-insurance premium (NFIP or private), and is the property in a SFHA with mandatory coverage?
- Why hasn't it sold? Are there any deal-killer items the seller is aware of (foundation, flood, title, zoning, code violations)?
- Is there a deadline driving the sale (1031 exchange, divorce, estate, relocation)? That informs how much negotiation room exists.
- Schools are F-rated, which usually means shorter tenancies and higher turnover. Who's the typical renter profile here, and what's been the actual vacancy rate?
- The area grade is low — what's the realistic commute time and amenity access for the typical tenant pool here? Any planned neighborhood developments (good or bad) we should know about?
- What's the average days-on-market for RENTAL listings here right now (not sales)? A rising rental-DOM trend means longer vacancies and softer asking-rent achievability than the comps imply.
- What's the recent tenant-quality profile in this submarket — average credit score on applications, eviction rate, late-payment / NSF rate, and stable-employment percentage? A property-management company in the area should have these aggregated.
- How much new for-sale + rental construction is in the pipeline within 1–3 miles? Heavy new supply typically softens prices + rents 12–24 months out; constrained supply supports both.
Investment metrics
- 1% rule
- 4.55% ✓
- Cap rate
- 38.91%
- Cash-on-cash
- 116.47%
- DSCR
- 6.18
- GRM
- 1.8
CMA / ARV
- ARV (median comp)
- $113,781
- List price
- $25,000
- Delta
- -78.03%
- Verdict
- UNDERPRICED
- Comps
- 20 within 1.0 mi
Show comp detail 12 sales within ~0.75 mi
| Address | Dist | Beds/Ba | Sqft | Sold | Price | $/sf | Match |
|---|---|---|---|---|---|---|---|
| 3926 Edmundson Rd | 0.38mi | 2/1.0 (+1) | 768 (-2%) | 4mo | $59,900 | $78 | 70 |
| 3525 Wismer Rd | 0.30mi | 2/1.0 (+1) | 816 (+4%) | 5mo | $148,500 | $182 | 70 |
| 10212 Saint Arthur Ln | 0.55mi | 2/1.0 (+1) | 784 (0%) | 3mo | $154,900 | $198 | 67 |
| 9724 Margo Ann Ln | 0.43mi | 2/1.0 (+1) | 816 (+4%) | 2mo | $119,000 | $146 | 67 |
| 3548 Saint Genevieve Ln | 0.56mi | 2/1.0 (+1) | 774 (-1%) | 6mo | $120,000 | $155 | 62 |
| 3219 Royalton Ave | 0.68mi | 2/1.0 (+1) | 792 (+1%) | 3mo | $102,500 | $129 | 59 |
| 9448 Harold Dr | 0.48mi | 2/1.0 (+1) | 864 (+10%) | 2mo | $120,000 | $139 | 54 |
| 3294 W Tennyson Ave | 0.64mi | 2/1.0 (+1) | 744 (-5%) | 6mo | $40,000 | $54 | 52 |
| 3317 Royalton | 0.52mi | 2/1.0 (+1) | 700 (-11%) | 7mo | $107,000 | $153 | 47 |
| 3529 Saint Joachim Ln | 0.55mi | 2/1.0 (+1) | 682 (-13%) | 6mo | $109,900 | $161 | 43 |
| 10335 Saint Joan Ln | 0.75mi | 2/1.0 (+1) | 897 (+14%) | 2mo | $174,900 | $195 | 35 |
| 3329 Dix Ave | 0.70mi | 2/1.0 (+1) | 900 (+15%) | 6mo | $130,000 | $144 | 32 |
Match score weights: distance 35% · size 25% · config 20% · recency 20%. Top-matched comps best support the ARV.
Projected returns pro-forma
-3.0% appreciation · 4.14% rent growth · sell at horizon
- IRR
- 43.5%
- Equity multiple
- 2.95×
- Total profit
- $13,683
- Equity at exit
- $3,728
- IRR
- 50.8%
- Equity multiple
- 6.64×
- Total profit
- $39,449
- Equity at exit
- $2,162
Cash invested: $7,000 (down + closing). Projections, not guarantees.
Landlord ↔ Tenant lean methodology
- Overall (STATE)
- 81 Strongly Landlord-Friendly
- State Missouri
- 81 Strongly Landlord-Friendly · R+10
- County
- — inherits STATE
- City
- — inherits STATE
ZIP-level market 63074
- Rents YoY
- 4.1%
- Active inventory
- 61
- Price-to-rent
- 1.8×
Monthly cashflow live
- Estimated rent
- $1,138 high interval (Pro) →
- Mortgage (P&I)
- −$131
- Tax from tax record
- −$78 /mo · $936/yr
- Insurance
- −$10
- Flood insurance flood zone
- −$427 /mo · $5,118/yr
- HOA
- −$0
- Vacancy / Maint / Mgmt
- −$239
- Net cashflow
- $253
Break-even live
UW: 25.0% down · 7.5% · 30yr · 1.5% tax · 5.0% vac · 8.0% maint · 8.0% mgmt
Financing live
Cash to close
- Down payment
- $6,250
- Closing costs
- $750
- Reserves months
- —
- Total cash needed
- —
Loan-product check · same deal, 3 products live
Conventional
25% down · 7.5% · 30yr
- Down + closing
- —
- Monthly P&I
- —
- Monthly cashflow
- —
- DSCR
- —
- Eligible?
- —
Personal DTI + credit; lowest rate.
DSCR
20% down · 8.5% · 30yr
- Down + closing
- —
- Monthly P&I
- —
- Monthly cashflow
- —
- DSCR
- —
- Eligible?
- —
No personal income docs; deal must DSCR.
Hard money
10% down · 12.0% · 12mo
- Down + closing
- —
- Monthly P&I
- —
- Monthly cashflow
- —
- DSCR
- —
- Eligible?
- —
Short-term bridge; refi at stabilization.
Rent comps 32 comps
| Address | Beds | Baths | Sqft | Rent | $/sqft | DOM | Units | Dist |
|---|---|---|---|---|---|---|---|---|
| 9675 Muriel Ave Unit 9733 Overland, MO | 2.0 | 1.5 | 830 | $1,200 | $1.45 | 3d | 1 | 0.16mi |
| 9675 Muriel Ave Unit 9627 Overland, MO | 2.0 | 1.5 | 830 | $1,200 | $1.45 | 44d | 1 | 0.16mi |
| 10069 Livingston Ave St Ann, MO | 2.0 | 1.0 | 875 | $1,100 | $1.26 | 24d | 1 | 0.42mi |
| 3648 Edmundson Rd Unit 1 St. Louis, MO | 2.0 | 1.0 | 900 | $995 | $1.11 | 44d | 1 | 0.44mi |
| 3961 Jane Ave Unit 3963 St Ann, MO | 2.0 | 1.0 | 750 | $1,195 | $1.59 | 15d | 1 | 0.44mi |
| 9448 Harold Dr Saint Louis, MO | 2.0 | 1.0 | 864 | $1,495 | $1.73 | 44d | 1 | 0.47mi |
| 3529 Saint Joachim Ln Saint Ann, MO | 2.0 | 1.0 | 900 | $1,450 | $1.61 | 24d | 1 | 0.56mi |
| 3529 Saint Joachim Ln Unit NA St Ann, MO | 2.0 | 1.0 | 900 | $1,450 | $1.61 | 20d | 1 | 0.56mi |
| 10214 Saint Anthony Ln Saint Ann, MO | 2.0 | 1.0 | 734 | $1,200 | $1.63 | 44d | 1 | 0.65mi |
| 4120 Geraldine Ave St Ann, MO | 1.0 | 1.0 | 540 | $875 | $1.62 | 22d | 1 | 0.70mi |
| 4120 Geraldine Ave St Ann, MO | 2.0 | 1.5 | 922 | $1,200 | $1.30 | 18d | 1 | 0.70mi |
| 4120 Geraldine Ave St Ann, MO | 1.0 | 1.0 | 540 | $875 | $1.62 | 44d | 1 | 0.70mi |
| 3219 Royalton Ave Saint Louis, MO | 2.0 | 1.0 | 792 | $1,095 | $1.38 | 22d | 1 | 0.71mi |
| 3209 Royalton Ave Saint Louis, MO | 2.0 | 1.0 | 805 | $1,150 | $1.43 | 44d | 1 | 0.75mi |
| 9310 Shirley Gardens Dr Apt B St. Louis, MO | 2.0 | 1.0 | 800 | $1,100 | $1.38 | 44d | 1 | 0.77mi |
| 9310 Shirley Gardens Dr Apt C St. Louis, MO | 2.0 | 1.0 | 800 | $1,200 | $1.50 | 44d | 1 | 0.77mi |
| 10145 Cabana Club Dr St Ann, MO | 1.0–2.0 | 1.0–2.0 | 776 | $680 | $0.88 | 44d | 8 | 0.82mi |
| 3208 Dix Ave Saint Louis, MO | 2.0 | 1.0 | 656 | $1,235 | $1.88 | 10d | 1 | 0.89mi |
| 9618 De Porres Ln Saint Louis, MO | 2.0 | 1.0 | 875 | $1,200 | $1.37 | 44d | 1 | 0.93mi |
| 10205 Saint Daniel Ln Saint Ann, MO | 2.0 | 1.0 | 792 | $1,450 | $1.83 | 44d | 1 | 0.95mi |
| 9535 Baltimore Ave Saint Louis, MO | 2.0 | 1.0 | 800 | $1,145 | $1.43 | 24d | 1 | 1.04mi |
| 4616 Country Ln St Ann, MO | 2.0 | 1.0–2.0 | 758 | $1,234 | $1.63 | 2d | 9 | 1.06mi |
| 10742 Tropic Dr Unit VACANT St Ann, MO | 2.0 | 1.0 | 800 | $1,200 | $1.50 | 44d | 1 | 1.10mi |
| 9429 Baltimore Ave Saint Louis, MO | 2.0 | 1.0 | 900 | $1,200 | $1.33 | 24d | 1 | 1.12mi |
| 3010 Woodson Rd Breckenridge Hills, MO | 1.0 | 1.0 | 850 | $895 | $1.05 | 44d | 1 | 1.13mi |
| 2732 Annapolis Ave Saint Louis, MO | 2.0 | 1.0 | 768 | $1,250 | $1.63 | 44d | 1 | 1.14mi |
| 9987 Sloane Sq Unit 9987A St. Louis, MO | 1.0 | 1.0 | 571 | $695 | $1.22 | 44d | 1 | 1.15mi |
| 9987 Sloane Sq Apt A St. Louis, MO | 1.0 | 1.0 | 571 | $695 | $1.22 | 20d | 1 | 1.15mi |
| 9969 Sloane Sq Unit 9969C St. Louis, MO | 2.0 | 1.0 | 761 | $895 | $1.18 | 4d | 1 | 1.18mi |
| 10788 Tropic Dr Saint Ann, MO | 2.0 | 1.0 | 828 | $1,260 | $1.52 | 44d | 1 | 1.19mi |
| 11276 Liana Ln Saint Ann, MO | 2.0 | 1.0 | 780 | $1,189 | $1.52 | 4d | 1 | 1.26mi |
| 8819 McNulty Dr Saint Louis, MO | 2.0 | 1.0 | 752 | $1,225 | $1.63 | 44d | 1 | 1.36mi |
Listing history 17 events
-
2026-06-18days on market $25,000 Active 132 DOM
-
2026-06-17days on market $25,000 Active 131 DOM
-
2026-06-16days on market $25,000 Active 130 DOM
-
2026-06-15days on market $25,000 Active 129 DOM
-
2026-06-13pricedays on market $25,000 Active 127 DOM
-
2026-06-09days on market $35,000 Active 123 DOM
-
2026-06-08days on market $35,000 Active 122 DOM
-
2026-06-07days on market $35,000 Active 121 DOM
-
2026-06-03days on market $35,000 Active 117 DOM
-
2026-06-02days on market $35,000 Active 116 DOM
-
2026-06-01days on market $35,000 Active 115 DOM
-
2026-05-31days on market $35,000 Active 114 DOM
-
2026-04-23price $35,000 674-char remark
Show marketing remark (674 chars)
Unlock the potential of this 1 bed, 1 bath ranch offering 784 sq ft of opportunity. Whether you’re an investor, renovator, or buyer seeking sweat equity, this property delivers a rare chance to add value from the ground up. Featuring central HVAC, vinyl siding, and an architectural shingle roof, key exterior components are already in place. The interior is ready for a full transformation—no utilities are on, so bring flashlights and proceed with caution due to areas of subfloor damage. With a simple layout and manageable size, this home is primed for renovation, rental income, or resale. A true blank slate with endless possibilities for the right vision.
-
2026-03-19price $39,000 674-char remark
Show marketing remark (674 chars)
Unlock the potential of this 1 bed, 1 bath ranch offering 784 sq ft of opportunity. Whether you’re an investor, renovator, or buyer seeking sweat equity, this property delivers a rare chance to add value from the ground up. Featuring central HVAC, vinyl siding, and an architectural shingle roof, key exterior components are already in place. The interior is ready for a full transformation—no utilities are on, so bring flashlights and proceed with caution due to areas of subfloor damage. With a simple layout and manageable size, this home is primed for renovation, rental income, or resale. A true blank slate with endless possibilities for the right vision.
-
2026-02-06$40,000 Active 674-char remark
Show marketing remark (674 chars)
Unlock the potential of this 1 bed, 1 bath ranch offering 784 sq ft of opportunity. Whether you’re an investor, renovator, or buyer seeking sweat equity, this property delivers a rare chance to add value from the ground up. Featuring central HVAC, vinyl siding, and an architectural shingle roof, key exterior components are already in place. The interior is ready for a full transformation—no utilities are on, so bring flashlights and proceed with caution due to areas of subfloor damage. With a simple layout and manageable size, this home is primed for renovation, rental income, or resale. A true blank slate with endless possibilities for the right vision.
-
1992-12-14soldstatus
-
1988-12-01soldstatus $32,000
ⓘ Source: listings_history table (triggers on properties + properties_extension) + one-shot
backfill from property_details.listing_events for pre-trigger history.
Tax reassessment forecast MO · Resets to sale price
- Current annual tax
- $936 · $78/mo
- Projected year-2 tax
- $936 · $78/mo
- Expected delta
- $0/yr ($0/mo · 0.0%)
ⓘ Screening estimate from a state-policy table — verify with the county assessor before closing.
Climate risk First Street
- Flood 5/10 Major FEMA zone AE · 50% chance over 30 yrs
- Wildfire 1/10 Low
- Heat 4/10 Moderate 7 d/yr ≥106°F today · 21 d/yr by 30 yrs out
- Wind 2/10 Low 100% chance of damaging wind over 30 yrs
- Air quality 2/10 Low 1 unhealthy d/yr today · 3 by 30 yrs out
Nearby sold comps map
Loading sold comps map…
Walkable amenities ~0.75 mi
Loading nearby amenities…
Taxation est. · year 1
- Rental income
- $13,654
- − Mortgage interest
- −$1,400
- − Property taxes
- −$936
- − Insurance
- −$5,244
- − Repairs & maintenance
- −$1,092
- − Management
- −$1,092
- − Depreciation
- −$727
- Taxable income
- $3,163
- Est. tax owed @ 24.0%
- −$759
- After-tax cash flow
- $2,275/yr
For passive investors: Depreciation is non-cash, so a rental often shows a tax loss while cash-flowing — sheltering income. Rental losses are passive: they offset passive income freely, and up to $25,000/yr can offset ordinary (W-2) income if you actively participate and your MAGI is under $100k (phasing out to $0 by $150k); unused losses carry forward. On sale, claimed depreciation is recaptured at up to 25%, and gains may owe capital-gains tax (a 1031 exchange can defer both). Figures are a year-1 estimate at your 24.0% rate — not tax advice; consult a CPA.
Schools (NCES district)
- District
- Ritenour
- NCES district ID
- 2926640
- Math proficiency
- 13% ▼ -14.00%
- Reading proficiency
- 27% ▼ -7.00%
- Median HH income
- $41,410
- Composite
- 17.04/100
- National rank
- #9125
- State rank
- #304 of 324 in MO
Livability — Breckenridge Hills
- Score
- 68/100
- State rank
- #193
- US rank
- #10013
Category grades
Schools grade is shown separately in the Schools card above.
Census & demographics
- Census place
- Breckenridge Hills, MO
- County
- Saint Louis County · 888,823 people
- Metro
- St. Louis, MO-IL
- Population (ZIP)
- 15,793
- Household income
- $51,610
- Rent vs Own
- Severe rent burden
- 782.0
Population outlook (St. Louis County) Hauer SSP2
- Today (2025)
- 1,025,227 people
- By 2030
- 1,028,023 · +0.3%
- By 2040
- 1,020,940 · -0.4%
- By 2050
- 1,007,280 · -1.8%
- By 2075
- 987,277 · -3.7%
- By 2100
- 921,984 · -10.1%
Race, ethnicity, and origin ACS 2023
- Neighborhood character
- Diverse neighborhood (Simpson 0.65)
- Race & ethnicity
- White 50% Black 27% Hispanic / Latino 19% Two or more races 5% Asian 2%
- Hispanic origin (detail)
- Mexican 16%
- Common ancestry
- Lithuanian 2% Italian 1% Romanian 1%
- Foreign-born
- 13% · Canada, China
- Languages at home
- 80% English-only · Spanish 17% Chinese 1% German/W. Germanic 1%
Political lean MEDSL · St. Louis
- 2024 margin
- Strong D (+23.4) · D 60.8% · R 37.4% · Other 1.7%
- 2008→2024 swing
- +3.5pp toward D · 2008: 19.9pp · 2024: 23.4pp
- All cycles
- 2024: D+23.4 2020: D+24.0 2016: D+16.2 2012: D+13.7 2008: D+19.9
Not yet ingested
- Civics
- —
Market trends
- HPI YoY
- ▼ -242.89%
- Current HPI
- 210.6588
- Rent YoY
- ▲ 4.14%
- Metro
- St. Louis, MO-IL
- State GDP YoY
- ▲ 1.84%
- F500 in state
- 20
Industry mix (Fortune 500 HQ in MO)
| Industry | F500 HQs | Revenue |
|---|---|---|
| Healthcare | 1 | $163B |
|
||
| Insurance | 1 | $21B |
|
||
| Industrial Technology | 1 | $17B |
|
||
| Retail | 1 | $16B |
|
||
| Industrial Distribution | 1 | $10B |
|
||
| Utilities | 1 | $9B |
|
||
Price history
+9.4% since first listed5 events — show timeline
- 2026-04-23 Price Changed $35,000 MARIS as Distributed by MLS Grid
- 2026-03-19 Price Changed $39,000 MARIS as Distributed by MLS Grid
- 2026-02-06 Listed $40,000 MARIS as Distributed by MLS Grid
- 1992-12-14 Sold (Public Records) — Public Records
- 1988-12-01 Sold (Public Records) $32,000 Public Records
Property tax history
+0.0%/yrLatest (2022): $936 · +0.2% YoY. Source: county tax records.
Cash-flow waterfall
monthlySold comps — $/sqft
last 12 mo · ≤1 miLoading sold comps…