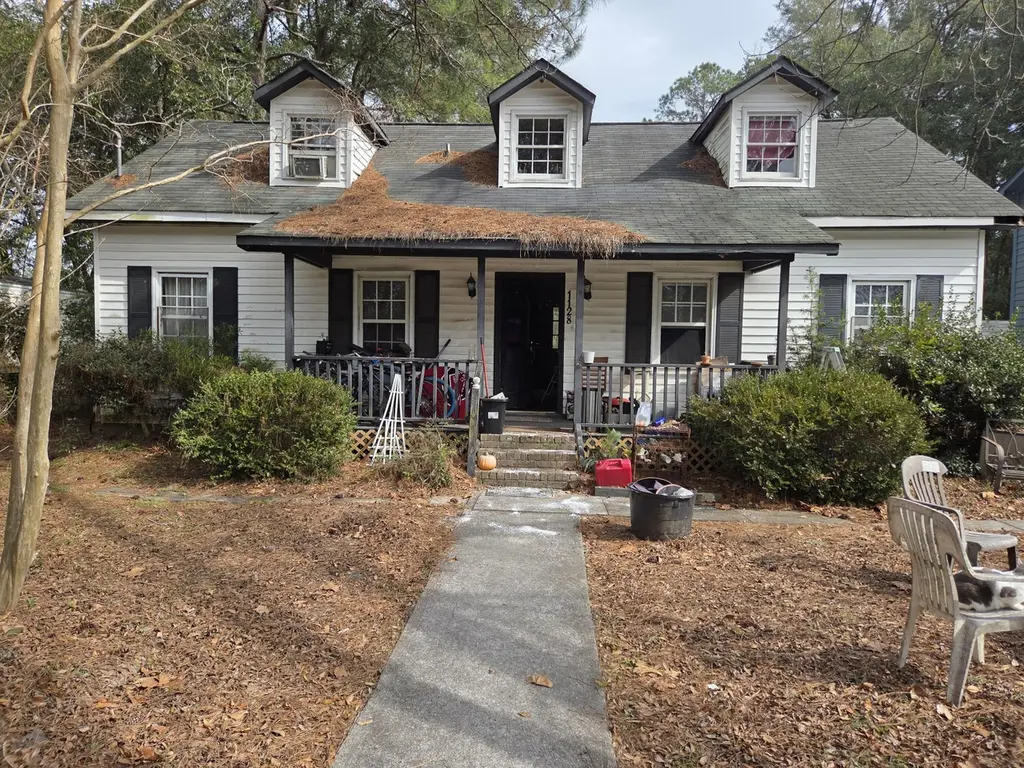
1128 Hillman St · James Island, SC
Flood risk 5/10 · Moderate
- FEMA flood zone
- X (shaded)
- Chance of flooding over 30 yrs
- 0.44%
- Est. flood insurance / yr
- $507 – $1,088
Fire risk 1/10 · Minimal
- Est. fire insurance / yr
- $783 – $1,453
Heat risk 10/10 · Severe
- Hot days now (above 104°F)
- 7 days/yr
- Hot days in 30 yrs
- 18 days/yr
Wind risk 9/10 · Severe
- Chance of severe wind over 30 yrs
- 99.0%
Air-quality risk 3/10 · Minor
- Unhealthy air days now
- 2 days/yr
- Unhealthy air days in 30 yrs
- 3 days/yr
Risk factors via First Street. Map © Google.
Why this score? — see what drove the C+ grade
The composite is a weighted blend of 9 inputs, each scored 0–100. Each bar is that input's sub-score; the figure is the points it added to the 100-point composite (weight × sub-score).
- Cash flow +22.4/30.0
- ARV discount +15.0/15.0
- DSCR +7.2/10.0
- 1% rule +4.8/10.0
- Schools +4.3/10.0
- Livability +3.5/5.0
- Rent growth +3.0/5.0
- Condition / age +2.5/5.0
- Appreciation +0.0/10.0
$309,000
🖨 Deal sheet 📄 Offer letter ✓ Due diligence
Listing remarks
Opportunity knocks in the heart of James Island! Situated on a quarter-acre lot in one of the Charleston area's most desirable and rapidly growing locations, this fixer-upper is priced well below market value and presents a compelling investment opportunity. With strong upside potential, this property is ideal for investors, flippers, or buyers looking to renovate and build instant equity. Comparable renovated homes in the area support a strong after-repair value (ARV), making this a prime candidate for a profitable flip or long-term hold. The lot size, location, and surrounding growth only add to the long-term appreciation potential. Opportunities like this on James Island are rare and mov
Key facts
- Quarter-acre lot
- 0.26 acre lot
- Built 1986
Tags
Neighborhood map
What this means for you Summary
Snapshot
- This is a 3-bed/2.0-bath single-family listed at $309k.
Deal economics
- At list price, monthly cash flow is $513 ($6k/yr) — positive.
- The deal already cash-flows at list — no discount required.
- To meet the 1% rule (rent ≥ 1% of price), the offer needs to be $303k (1.9% below list).
- Recommended offer: $303k (1.9% below list) — sets the bar for 1% rule.
- Cap rate 8.3% vs local median 2.4% in James Island — top-decile yield for the area; either an underpriced asset or a hidden risk that comps aren't pricing in. Stress-test before assuming the spread holds.
Location & tenants
- Location reads 70/100 on livability (#64 in SC) — a middle-class / working-renter tenant base. Strengths: employment A+, housing A+, crime A; Watch: amenities F, commute F, cost of living F.
- Charleston 01 (urban): math 48% / reading 53% proficiency, ranked #7 of 80 in SC (top 9%) — acceptable for families but not a draw, mixed tenant base, ~2y average lease.
- Zoned schools: Harbor View Elementary (math 65% / reading 63%, grade B, #63 of 597 statewide, top 11%, 639 students, 40% FRL); Camp Road Middle (math 50% / reading 57%, grade C+, #29 of 229 statewide, top 13%, 864 students, 38% FRL); James Island Charter High (math 73% / reading 89%, grade A, #21 of 196 statewide, top 11%, 1,589 students, 36% FRL, charter).
- Zoned-school proficiency averages 66% at this address vs 50% district-wide (+16 pts) — the actual schools serving this property are materially stronger than the Charleston 01 average implies; a family-tenant draw the district grade alone would hide.
- Market conditions: Rents rising (+2.1%/yr); 301 active listings in the ZIP; 9 comparable units currently listed for rent nearby; rentals at typical pace (median 23d on market — plan ~3-4 weeks tenant-placement turnaround); solid renter incomes; 4,156 units permitted in Charleston County in 2024 (857 in 5+ unit buildings).
- This rent runs 36% of the median local income ($102k/yr) — at the standard rent-burdened threshold; future hikes will face affordability resistance.
Forward outlook
- Local home prices are declining (-3.0%/yr); year-one equity from $2k of loan paydown is wiped out by about $9k of value loss. Plan a longer hold.
- Charleston County population projected at +44% by 2050 — long-run rental-demand tailwind backs the buy-and-hold thesis.
Negotiation context
- It's been on market 16 days — a 2% lower offer ($304k) is reasonable based on typical stale-listing flexibility.
- 3 sale attempts since 19y ago with the ask held roughly flat each time — persistent listings suggest the price (not the market) is what's stuck; bring a comps-based counter.
Risks & watch-outs
- Climate carrying-cost: moderate flood risk; severe wind risk, 99% chance of damaging wind over 30y; extreme-heat days projected 7→18/yr by 2055 (HVAC capex compounding) — expect insurance premiums to compound above CPI over the hold.
Questions for the listing agent
- Is there a deadline driving the sale (1031 exchange, divorce, estate, relocation)? That informs how much negotiation room exists.
- Schools are D-rated, which usually means shorter tenancies and higher turnover. Who's the typical renter profile here, and what's been the actual vacancy rate?
- What's the average days-on-market for RENTAL listings here right now (not sales)? A rising rental-DOM trend means longer vacancies and softer asking-rent achievability than the comps imply.
- What's the recent tenant-quality profile in this submarket — average credit score on applications, eviction rate, late-payment / NSF rate, and stable-employment percentage? A property-management company in the area should have these aggregated.
- How much new for-sale + rental construction is in the pipeline within 1–3 miles? Heavy new supply typically softens prices + rents 12–24 months out; constrained supply supports both.
Investment metrics
- 1% rule
- 0.98% ✗
- Cap rate
- 8.29%
- Cash-on-cash
- 7.12%
- DSCR
- 1.32
- GRM
- 8.5
CMA / ARV
- ARV (on-the-fly)
- $488,992
- Comps found
- 12
Show comp detail 12 sales within ~0.75 mi
| Address | Dist | Beds/Ba | Sqft | Sold | Price | $/sf | Match |
|---|---|---|---|---|---|---|---|
| 1128 Hillman St | 0.00mi | 3/2.5 | 1,652 (0%) | 1mo | $327,000 | $198 | 97 |
| 1129 Camp Rd | 0.09mi | 3/2.5 | 1,723 (+4%) | 4mo | $509,900 | $296 | 84 |
| 1249 Stone Post Rd | 0.17mi | 4/2.0 (+1) | 1,460 (-12%) | 5mo | $450,000 | $308 | 64 |
| 1409 Kentwood Cir | 0.61mi | 3/1.5 | 1,592 (-4%) | 1mo | $470,000 | $295 | 63 |
| 1475 Swamp Fox Ln | 0.22mi | 3/2.5 | 1,408 (-15%) | 2mo | $570,000 | $405 | 61 |
| 1138 Cottage Rd | 0.69mi | 4/2.0 (+1) | 1,659 (+0%) | 3mo | $735,000 | $443 | 60 |
| 1174 Fort Johnson Rd | 0.21mi | 4/3.0 (+1) | 1,854 (+12%) | 3mo | $490,000 | $264 | 59 |
| 1333 Mapleton Ave | 0.47mi | 3/2.0 | 1,440 (-13%) | 1mo | $633,750 | $440 | 56 |
| 1032 Greenhill Rd | 0.74mi | 3/2.5 | 1,498 (-9%) | 2mo | $260,000 | $174 | 46 |
| 1120 Seaside Ln | 0.73mi | 4/2.0 (+1) | 1,796 (+9%) | 1mo | $460,000 | $256 | 45 |
| 1223 Stone Post Rd | 0.59mi | 2/2.0 (-1) | 1,416 (-14%) | 1mo | $1,300,000 | $918 | 43 |
| 1418 Kentwood Circle Cir | 0.67mi | 4/2.5 (+1) | 1,859 (+12%) | 4mo | $440,000 | $237 | 38 |
Match score weights: distance 35% · size 25% · config 20% · recency 20%. Top-matched comps best support the ARV.
Projected returns pro-forma
-3.0% appreciation · 2.06% rent growth · sell at horizon
- IRR
- -6.4%
- Equity multiple
- 0.77×
- Total profit
- $-20,325
- Equity at exit
- $46,073
- IRR
- 2.1%
- Equity multiple
- 1.14×
- Total profit
- $12,519
- Equity at exit
- $26,717
Cash invested: $86,520 (down + closing). Projections, not guarantees.
Landlord ↔ Tenant lean methodology
- Overall (STATE)
- 90 Strongly Landlord-Friendly
- State South Carolina
- 90 Strongly Landlord-Friendly · R+6
- County
- — inherits STATE
- City
- — inherits STATE
ZIP-level market 29412
- Rents YoY
- 2.1%
- Active inventory
- 301
- Price-to-rent
- 8.5×
Monthly cashflow live
- Estimated rent
- $3,030 high interval (Pro) →
- Mortgage (P&I)
- −$1,620
- Tax from tax record
- −$131 /mo · $1,578/yr
- Insurance
- −$129
- HOA
- −$0
- Vacancy / Maint / Mgmt
- −$636
- Net cashflow
- $513
Break-even live
UW: 25.0% down · 7.5% · 30yr · 1.5% tax · 5.0% vac · 8.0% maint · 8.0% mgmt
Financing live
Cash to close
- Down payment
- $77,250
- Closing costs
- $9,270
- Reserves months
- —
- Total cash needed
- —
Loan-product check · same deal, 3 products live
Conventional
25% down · 7.5% · 30yr
- Down + closing
- —
- Monthly P&I
- —
- Monthly cashflow
- —
- DSCR
- —
- Eligible?
- —
Personal DTI + credit; lowest rate.
DSCR
20% down · 8.5% · 30yr
- Down + closing
- —
- Monthly P&I
- —
- Monthly cashflow
- —
- DSCR
- —
- Eligible?
- —
No personal income docs; deal must DSCR.
Hard money
10% down · 12.0% · 12mo
- Down + closing
- —
- Monthly P&I
- —
- Monthly cashflow
- —
- DSCR
- —
- Eligible?
- —
Short-term bridge; refi at stabilization.
Rent comps 9 comps
| Address | Beds | Baths | Sqft | Rent | $/sqft | DOM | Units | Dist |
|---|---|---|---|---|---|---|---|---|
| 1133 Oakcrest Dr Charleston, SC | 3.0 | 2.0 | 1290 | $3,300 | $2.56 | 14d | 1 | 0.70mi |
| 1209 Julian Clark Rd Charleston, SC | 3.0 | 2.0 | 1150 | $3,200 | $2.78 | 14d | 1 | 0.71mi |
| 1154 Julian Clark Rd Charleston, SC | 2.0 | 1.5 | 1193 | $1,845 | $1.55 | 23d | 1 | 0.72mi |
| 1410 Dove Run Dr Charleston, SC | 2.0 | 1.5 | 1400 | $1,800 | $1.29 | 23d | 1 | 0.76mi |
| 1129 Quail Dr Charleston, SC | 4.0 | 3.0 | 1475 | $5,200 | $3.53 | 23d | 1 | 0.98mi |
| 1471 Woodhill Ter Charleston, SC | 4.0 | 2.5 | 2011 | $3,000 | $1.49 | 23d | 1 | 1.13mi |
| 770 Dills Bluff Rd Charleston, SC | 2.0 | 2.0 | 1314 | $3,250 | $2.47 | 23d | 1 | 1.23mi |
| 1263 Marshview Dr Charleston, SC | 3.0 | 2.0 | 1432 | $3,000 | $2.09 | 14d | 1 | 1.32mi |
| 753 Sprague St Charleston, SC | 3.0 | 2.0 | 1680 | $4,600 | $2.74 | 23d | 1 | 1.49mi |
Listing history 6 events
-
2026-04-02status Pending
-
2026-03-25status Active
-
2026-03-18historical Active Under Contract
-
2026-03-17$309,000 Active
-
2008-02-16historical
-
2007-11-02$179,900
ⓘ Source: listings_history table (triggers on properties + properties_extension) + one-shot
backfill from property_details.listing_events for pre-trigger history.
Tax reassessment forecast SC · Resets to sale price
- Current annual tax
- $1,578 · $131/mo
- Projected year-2 tax
- $1,761 · $147/mo
- Expected delta
- +$183/yr (+$15/mo · 11.6%)
ⓘ Screening estimate from a state-policy table — verify with the county assessor before closing.
Climate risk First Street
- Flood 5/10 Major FEMA zone X (shaded) · 44% chance over 30 yrs
- Wildfire 1/10 Low
- Heat 10/10 Extreme 7 d/yr ≥104°F today · 18 d/yr by 30 yrs out
- Wind 9/10 Extreme 99% chance of damaging wind over 30 yrs
- Air quality 3/10 Moderate 2 unhealthy d/yr today · 3 by 30 yrs out
Nearby sold comps map
Loading sold comps map…
Walkable amenities ~0.75 mi
Loading nearby amenities…
Taxation est. · year 1
- Rental income
- $36,365
- − Mortgage interest
- −$17,309
- − Property taxes
- −$1,578
- − Insurance
- −$1,545
- − Repairs & maintenance
- −$2,909
- − Management
- −$2,909
- − Depreciation
- −$8,989
- Taxable income
- $1,126
- Est. tax owed @ 24.0%
- −$270
- After-tax cash flow
- $5,890/yr
For passive investors: Depreciation is non-cash, so a rental often shows a tax loss while cash-flowing — sheltering income. Rental losses are passive: they offset passive income freely, and up to $25,000/yr can offset ordinary (W-2) income if you actively participate and your MAGI is under $100k (phasing out to $0 by $150k); unused losses carry forward. On sale, claimed depreciation is recaptured at up to 25%, and gains may owe capital-gains tax (a 1031 exchange can defer both). Figures are a year-1 estimate at your 24.0% rate — not tax advice; consult a CPA.
Schools (NCES district)
- District
- Charleston 01
- NCES district ID
- 4501440
- Math proficiency
- 48% ▼ -2.00%
- Reading proficiency
- 53% ▬ 0.00%
- Median HH income
- $52,376
- Composite
- 43.41/100
- National rank
- #3018
- State rank
- #7 of 80 in SC
Livability — James Island
- Score
- 70/100
- State rank
- #64
- US rank
- #7731
Category grades
Schools grade is shown separately in the Schools card above.
Census & demographics
- Census place
- James Island, SC
- County
- Charleston County · 366,793 people
- Metro
- Charleston-North Charleston, SC
- Population (ZIP)
- 39,256
- Household income
- $101,509
- Rent vs Own
- Severe rent burden
- 1006.0
Population outlook (Charleston County) Hauer SSP2
- Today (2025)
- 480,562 people
- By 2030
- 525,921 · +9.4%
- By 2040
- 612,189 · +27.4%
- By 2050
- 691,627 · +43.9%
- By 2075
- 847,979 · +76.5%
- By 2100
- 926,482 · +92.8%
Race, ethnicity, and origin ACS 2023
- Neighborhood character
- Predominantly White (74%)
- Race & ethnicity
- White 74% Black 16% Hispanic / Latino 5% Two or more races 4% Asian 2%
- Common ancestry
- Slovak 3% Italian 3% Lithuanian 2%
- Foreign-born
- 5% · Canada, China
- Languages at home
- 94% English-only · Spanish 3% French/Haitian/Cajun 1% Other Indo-European 1%
Political lean MEDSL · Charleston
- 2024 margin
- Lean D (+5.7) · D 51.9% · R 46.3% · Other 1.8%
- 2008→2024 swing
- -2.7pp toward R · 2008: 8.3pp · 2024: 5.7pp
- All cycles
- 2024: D+5.7 2020: D+12.9 2016: D+7.9 2012: D+2.4 2008: D+8.3
Not yet ingested
- Civics
- —
Market trends
- HPI YoY
- ▼ -564.80%
- Current HPI
- 400.0617
- Rent YoY
- ▲ 2.06%
- Metro
- Charleston-North Charleston, SC
- State GDP YoY
- ▲ 4.51%
- F500 in state
- 2
Industry mix (Fortune 500 HQ in SC)
| Industry | F500 HQs | Revenue |
|---|---|---|
| Packaging | 1 | $7B |
|
||
Price history
+71.8% since first listed6 events — show timeline
- 2026-04-02 Pending — Charleston Trident MLS
- 2026-03-25 Relisted — Charleston Trident MLS
- 2026-03-18 Contingent — Charleston Trident MLS
- 2026-03-17 Listed $309,000 Charleston Trident MLS
- 2008-02-16 Listing Removed — Charleston Trident MLS
- 2007-11-02 Listed $179,900 Charleston Trident MLS
Property tax history
+3.9%/yrLatest (2022): $1,578 · +0.4% YoY. Source: county tax records.
Cash-flow waterfall
monthlySold comps — $/sqft
last 12 mo · ≤1 miLoading sold comps…