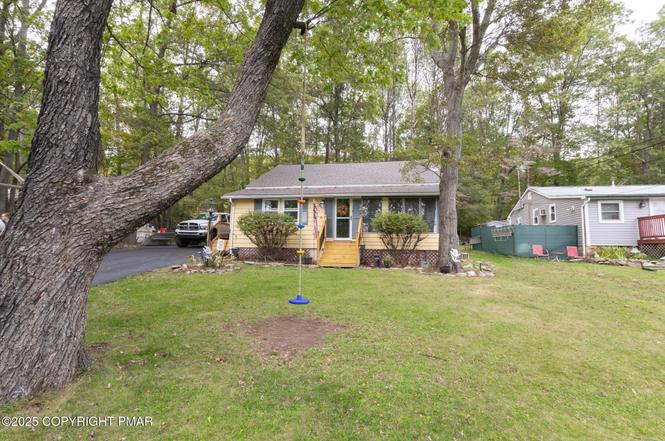
9064 Robinhood Dr · Indian Mountain Lake, PA
Flood risk 1/10 · Minimal
- FEMA flood zone
- X (unshaded)
- Chance of flooding over 30 yrs
- 0.0%
- Est. flood insurance / yr
- $473 – $860
Fire risk 5/10 · Moderate
- Est. fire insurance / yr
- $511 – $949
Heat risk 2/10 · Minimal
- Hot days now (above 93°F)
- 7 days/yr
- Hot days in 30 yrs
- 16 days/yr
Wind risk 4/10 · Minor
- Chance of severe wind over 30 yrs
- 9.0%
Air-quality risk 3/10 · Minor
- Unhealthy air days now
- 1 days/yr
- Unhealthy air days in 30 yrs
- 4 days/yr
Risk factors via First Street. Map © Google.
Why this score? — see what drove the B- grade
The composite is a weighted blend of 9 inputs, each scored 0–100. Each bar is that input's sub-score; the figure is the points it added to the 100-point composite (weight × sub-score).
- Cash flow +24.7/30.0
- Appreciation +8.1/10.0
- DSCR +8.0/10.0
- ARV discount +6.9/15.0
- 1% rule +6.5/10.0
- Schools +3.7/10.0
- Livability +3.1/5.0
- Rent growth +2.5/5.0
- Condition / age +2.5/5.0
$239,900
🖨 Deal sheet 📄 Offer letter ✓ Due diligence
Listing remarks
This fully updated home in the desirable Robin Hood Lakes community delivers move-in-ready comfort with modern upgrades and low maintenance living. Nearly every major system and surface has been replaced. Highlights include a new roof (2023), energy-efficient windows, (2024) with warranty, brand-new decks, smart lock exterior doors, and a freshly seal coated driveway (2025). Inside, discover a renovated half bath upstairs, a completely remodeled full bath downstairs (2025), an updated mudroom, and thoughtful finishes throughout. The home's heating and cooling system (2020) and electric water heater (2020) offer peace of mind for years to come. With updates completed inside and out, this pro
Key facts
- Lake community
- Bright living area
- Partially wooded lot
Tags
Neighborhood map
What this means for you Summary
Snapshot
- This is a 2-bed/1.0-bath single-family listed at $240k.
Deal economics
- At list price, monthly cash flow is $503 ($6k/yr) — positive.
- The deal already cash-flows at list — no discount required.
- Meets the 1% rule at list price ($3k rent vs $240k).
- Recommended offer: $226k (6.0% below list) — sets the bar for market timing.
- Cap rate 8.8% vs local median 4.7% in Indian Mountain Lake — top-decile yield for the area; either an underpriced asset or a hidden risk that comps aren't pricing in. Stress-test before assuming the spread holds.
Location & tenants
- Location reads 62/100 on livability (#1,349 in PA) — a middle-class / working-renter tenant base. Strengths: cost of living A+, housing A+, crime A; Watch: schools D, health & safety D, amenities F.
- Pleasant Valley SD (rural): math 31% / reading 53% proficiency, ranked #297 of 539 in PA (top 55%) — families likely to look elsewhere, expect single-tenant / working-renter base with shorter leases.
- Market conditions: 90 active listings in the ZIP; 1 comparable units currently listed for rent nearby; 278 units permitted in Monroe County in 2024 (52 in 5+ unit buildings).
Forward outlook
- In year one you build about $17k of equity ($2k loan paydown + $15k appreciation (6.2% local appreciation)).
- Monroe County population projected at -11% by 2050 — secular population decline; favor cash flow + early exit over multi-decade hold.
- At projected returns (6.2% appreciation + 3.0% rent growth), your $67k cash investment doubles in ~3 years — after that, you're playing with house money.
- By year 3, paydown + projected appreciation supports a ~$41k cash-out refi (75% LTV) — recoverable capital for the next deal without selling this one.
Negotiation context
- It's been on market 88 days — a 6% lower offer ($226k) is reasonable based on typical stale-listing flexibility.
- 4 sale attempts since 4y ago with the ask held roughly flat each time — persistent listings suggest the price (not the market) is what's stuck; bring a comps-based counter.
- Current owner paid $175k; 37% above their basis — modest negotiation headroom, anchor on the comps not their cost.
Risks & watch-outs
- Watch-outs: built in 1959 — expect roof / HVAC / electrical / plumbing capex.
- Climate carrying-cost: moderate wildfire risk — expect insurance premiums to compound above CPI over the hold.
Questions for the listing agent
- It's been on market 88 days. Have you received any prior offers? Is the seller open to a 6% concession, seller financing, or rate buy-down credit?
- Built in 1959 — when were the roof, HVAC, electrical panel, plumbing, and water heater last replaced?
- What does the HOA fee cover, when was the last increase, and are there any pending special assessments or reserve-fund shortfalls?
- Why hasn't it sold? Are there any deal-killer items the seller is aware of (foundation, flood, title, zoning, code violations)?
- Is there a deadline driving the sale (1031 exchange, divorce, estate, relocation)? That informs how much negotiation room exists.
- Schools are D-rated, which usually means shorter tenancies and higher turnover. Who's the typical renter profile here, and what's been the actual vacancy rate?
- What's the average days-on-market for RENTAL listings here right now (not sales)? A rising rental-DOM trend means longer vacancies and softer asking-rent achievability than the comps imply.
- What's the recent tenant-quality profile in this submarket — average credit score on applications, eviction rate, late-payment / NSF rate, and stable-employment percentage? A property-management company in the area should have these aggregated.
- How much new for-sale + rental construction is in the pipeline within 1–3 miles? Heavy new supply typically softens prices + rents 12–24 months out; constrained supply supports both.
Investment metrics
- 1% rule
- 1.15% ✓
- Cap rate
- 8.81%
- Cash-on-cash
- 8.98%
- DSCR
- 1.40
- GRM
- 7.3
CMA / ARV
- ARV (on-the-fly)
- $236,544
- Comps found
- 9
Show comp detail 9 sales within ~0.75 mi
| Address | Dist | Beds/Ba | Sqft | Sold | Price | $/sf | Match |
|---|---|---|---|---|---|---|---|
| 170 Acorn Ln | 0.36mi | 3/1.0 (+1) | 952 (-7%) | 0mo | $220,000 | $231 | 66 |
| 8676 Twin Lake Dr | 0.52mi | 3/1.0 (+1) | 1,000 (-2%) | 3mo | $237,000 | $237 | 64 |
| 8803 Robinhood Dr | 0.36mi | 3/2.0 (+1) | 1,056 (+3%) | 12mo | $229,000 | $217 | 59 |
| 8708 Lady Marion Dr | 0.39mi | 3/1.0 (+1) | 960 (-6%) | 10mo | $200,000 | $208 | 58 |
| 8879 Robinhood Dr | 0.28mi | 3/1.5 (+1) | 1,056 (+3%) | 19mo | $147,900 | $140 | 58 |
| 161 Acorn Ln | 0.37mi | 3/1.0 (+1) | 1,008 (-2%) | 24mo | $230,000 | $228 | 55 |
| 8755 Twin Lake Dr | 0.38mi | 3/3.0 (+1) | 1,011 (-1%) | 18mo | $315,000 | $312 | 52 |
| 4194 Forest Dr | 0.57mi | 3/1.5 (+1) | 1,036 (+1%) | 18mo | $292,000 | $282 | 50 |
| 4155 Greenwood Dr | 0.72mi | 2/1.0 | 900 (-12%) | 24mo | $225,000 | $250 | 26 |
Match score weights: distance 35% · size 25% · config 20% · recency 20%. Top-matched comps best support the ARV.
Projected returns pro-forma
6.25% appreciation · 3.0% rent growth · sell at horizon
- IRR
- 23.3%
- Equity multiple
- 2.56×
- Total profit
- $104,894
- Equity at exit
- $154,613
- IRR
- 22.0%
- Equity multiple
- 5.21×
- Total profit
- $282,679
- Equity at exit
- $283,724
Cash invested: $67,172 (down + closing). Projections, not guarantees.
Landlord ↔ Tenant lean methodology
- Overall (STATE)
- 62 Landlord-Friendly
- State Pennsylvania
- 62 Landlord-Friendly · EVEN
- County
- — inherits STATE
- City
- — inherits STATE
ZIP-level market 18058
- Home prices YoY
- 3.4%
- Active inventory
- 90
- Price-to-rent
- 7.3×
Monthly cashflow live
- Estimated rent
- $2,750 medium interval (Pro) →
- Mortgage (P&I)
- −$1,258
- Tax from tax record
- −$266 /mo · $3,191/yr
- Insurance
- −$100
- HOA
- −$46
- Vacancy / Maint / Mgmt
- −$578
- Net cashflow
- $503
Break-even live
UW: 25.0% down · 7.5% · 30yr · 1.5% tax · 5.0% vac · 8.0% maint · 8.0% mgmt
Financing live
Cash to close
- Down payment
- $59,975
- Closing costs
- $7,197
- Reserves months
- —
- Total cash needed
- —
Loan-product check · same deal, 3 products live
Conventional
25% down · 7.5% · 30yr
- Down + closing
- —
- Monthly P&I
- —
- Monthly cashflow
- —
- DSCR
- —
- Eligible?
- —
Personal DTI + credit; lowest rate.
DSCR
20% down · 8.5% · 30yr
- Down + closing
- —
- Monthly P&I
- —
- Monthly cashflow
- —
- DSCR
- —
- Eligible?
- —
No personal income docs; deal must DSCR.
Hard money
10% down · 12.0% · 12mo
- Down + closing
- —
- Monthly P&I
- —
- Monthly cashflow
- —
- DSCR
- —
- Eligible?
- —
Short-term bridge; refi at stabilization.
Rent comps 1 comps
| Address | Beds | Baths | Sqft | Rent | $/sqft | DOM | Units | Dist |
|---|---|---|---|---|---|---|---|---|
| 20 Iowa Rd Albrightsville, PA | 3.0 | 1.0 | 930 | $2,750 | $2.96 | 23d | 1 | 0.79mi |
HOA detail
- Monthly dues
- $46 · $552/yr
- Likely covers
- waterelectric
Listing history 10 events
-
2026-03-05status Pending
-
2026-03-01status Active
-
2026-03-01price $239,900
-
2026-02-06price $229,900
-
2025-09-15$250,000 Active
-
2023-03-03soldstatus $175,000
-
2022-11-01$199,900 Active
-
2022-09-29price $199,900
-
2022-09-16$209,900 Active
-
2007-04-25soldstatus $155,000
ⓘ Source: listings_history table (triggers on properties + properties_extension) + one-shot
backfill from property_details.listing_events for pre-trigger history.
Tax reassessment forecast PA · Partial reset (capped growth)
- Current annual tax
- $3,191 · $266/mo
- Projected year-2 tax
- $3,491 · $291/mo
- Expected delta
- +$300/yr (+$25/mo · 9.4%)
ⓘ Screening estimate from a state-policy table — verify with the county assessor before closing.
Climate risk First Street
- Flood 1/10 Low FEMA zone X (unshaded) · 0% chance over 30 yrs
- Wildfire 5/10 Major
- Heat 2/10 Low 7 d/yr ≥93°F today · 16 d/yr by 30 yrs out
- Wind 4/10 Moderate 9% chance of damaging wind over 30 yrs
- Air quality 3/10 Moderate 1 unhealthy d/yr today · 4 by 30 yrs out
Nearby sold comps map
Loading sold comps map…
Walkable amenities ~0.75 mi
Loading nearby amenities…
Taxation est. · year 1
- Rental income
- $33,000
- − Mortgage interest
- −$13,438
- − Property taxes
- −$3,191
- − Insurance
- −$1,200
- − Repairs & maintenance
- −$2,640
- − Management
- −$2,640
- − HOA
- −$552
- − Depreciation
- −$6,979
- Taxable income
- $2,360
- Est. tax owed @ 24.0%
- −$566
- After-tax cash flow
- $5,464/yr
For passive investors: Depreciation is non-cash, so a rental often shows a tax loss while cash-flowing — sheltering income. Rental losses are passive: they offset passive income freely, and up to $25,000/yr can offset ordinary (W-2) income if you actively participate and your MAGI is under $100k (phasing out to $0 by $150k); unused losses carry forward. On sale, claimed depreciation is recaptured at up to 25%, and gains may owe capital-gains tax (a 1031 exchange can defer both). Figures are a year-1 estimate at your 24.0% rate — not tax advice; consult a CPA.
Schools (NCES district)
- District
- Pleasant Valley SD
- NCES district ID
- 4219290
- Math proficiency
- 31% ▼ -19.00%
- Reading proficiency
- 53% ▼ -15.00%
- Median HH income
- $61,593
- Composite
- 37.18/100
- National rank
- #4476
- State rank
- #297 of 539 in PA
Livability — Indian Mountain Lake
- Score
- 62/100
- State rank
- #1349
- US rank
- #16713
Category grades
Schools grade is shown separately in the Schools card above.
Census & demographics
- Population (ZIP)
- 9,884
Population outlook (Monroe County) Hauer SSP2
- Today (2025)
- 164,099 people
- By 2030
- 161,412 · -1.6%
- By 2040
- 154,616 · -5.8%
- By 2050
- 146,710 · -10.6%
- By 2075
- 140,830 · -14.2%
- By 2100
- 138,472 · -15.6%
Race, ethnicity, and origin ACS 2023
- Neighborhood character
- Predominantly White (81%)
- Race & ethnicity
- White 81% Hispanic / Latino 11% Two or more races 10% Black 2%
- Hispanic origin (detail)
- Mexican 6% Puerto Rican 2%
- Common ancestry
- Romanian 6% Polish 4% Iranian 4%
- Foreign-born
- 6% · Canada
- Languages at home
- 90% English-only · Spanish 5% Other Indo-European 2% Russian/Polish/Slavic 1%
Political lean MEDSL · Monroe
- 2024 margin
- Toss-up / Even · D 49.1% · R 49.9%
- 2008→2024 swing
- -17.1pp toward R · 2008: 16.3pp · 2024: -0.8pp
- All cycles
- 2024: R+0.8 2020: D+6.4 2016: D+0.3 2012: D+14.0 2008: D+16.3
Not yet ingested
- Civics
- —
Market trends
- HPI YoY
- ▲ 6.25%
- Current HPI
- 188.6013
- Rent YoY
- —
- Metro
- —
- State GDP YoY
- ▲ 1.68%
- F500 in state
- 34
Industry mix (Fortune 500 HQ in PA)
| Industry | F500 HQs | Revenue |
|---|---|---|
| Healthcare | 2 | $309B |
|
||
| Insurance | 2 | $27B |
|
||
| Telecommunications / Media | 1 | $124B |
|
||
| Industrial Distribution | 1 | $22B |
|
||
| Financial Services | 1 | $20B |
|
||
| Chemicals / Materials | 1 | $18B |
|
||
Price history
+54.8% since first listed10 events — show timeline
- 2026-03-05 Pending — PMAR
- 2026-03-01 Relisted — PMAR
- 2026-03-01 Price Changed $239,900 PMAR
- 2026-02-06 Price Changed $229,900 PMAR
- 2025-09-15 Listed $250,000 PMAR
- 2023-03-03 Sold (Public Records) $175,000 Public Records
- 2022-11-01 Listed $199,900 PMAR
- 2022-09-29 Price Changed $199,900 PMAR
- 2022-09-16 Listed $209,900 PMAR
- 2007-04-25 Sold (Public Records) $155,000 Public Records
Property tax history
+4.3%/yrLatest (2026): $3,191 · +1.6% YoY. Source: county tax records.
Cash-flow waterfall
monthlySold comps — $/sqft
last 12 mo · ≤1 miLoading sold comps…