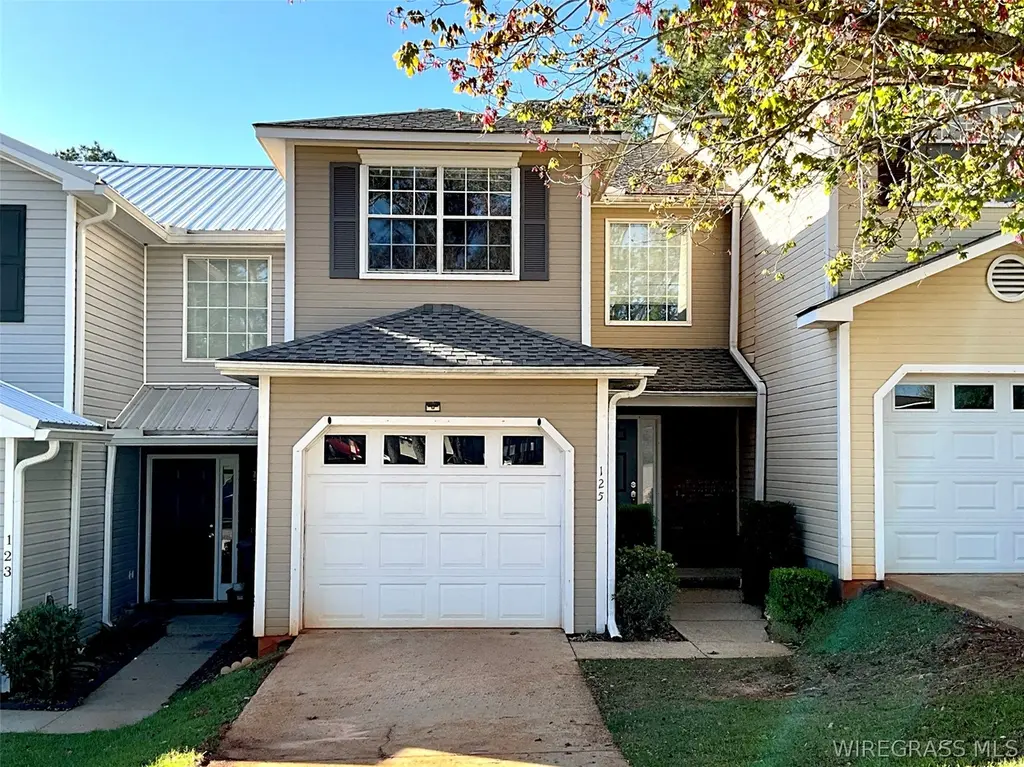
125 Pineridge Dr · Enterprise, AL
Flood risk 1/10 · Minimal
- FEMA flood zone
- X (unshaded)
- Chance of flooding over 30 yrs
- 0.0%
- Est. flood insurance / yr
- $507 – $1,088
Fire risk 3/10 · Minor
- Est. fire insurance / yr
- $916 – $1,700
Heat risk 8/10 · Major
- Hot days now (above 106°F)
- 7 days/yr
- Hot days in 30 yrs
- 20 days/yr
Wind risk 8/10 · Major
- Chance of severe wind over 30 yrs
- 99.0%
Air-quality risk 2/10 · Minimal
- Unhealthy air days now
- 0 days/yr
- Unhealthy air days in 30 yrs
- 1 days/yr
Risk factors via First Street. Map © Google.
Why this score? — see what drove the D grade
The composite is a weighted blend of 9 inputs, each scored 0–100. Each bar is that input's sub-score; the figure is the points it added to the 100-point composite (weight × sub-score).
- Cash flow +15.9/30.0
- ARV discount +5.0/15.0
- DSCR +4.9/10.0
- Schools +4.3/10.0
- 1% rule +4.1/10.0
- Rent growth +3.5/5.0
- Livability +3.2/5.0
- Condition / age +2.5/5.0
- Appreciation +0.0/10.0
$145,000
🖨 Deal sheet (PDF) 📄 Offer letter ✓ Due diligence
Listing remarks MLS
This charming 2-bedroom, 2.5-bathroom townhome offers carpeted upstairs bedrooms and LVP flooring in the living area. The galley-style kitchen comes with stainless steel appliances. Bedrooms are tucked away upstairs for extra privacy and comfort. Bathrooms are conveniently located on both levels, and the laundry room sits just off the foyer downstairs. Enjoy plenty of parking with a roomy one-car garage and concrete driveway. Ideally situated near shopping, schools, and restaurants, and just a short drive to Fort Rucker. Tenant occupied until May 2027.
Key facts
- Roomy one-car garage
- Galley-style kitchen
- Plenty of parking
Tags
Neighborhood map
What this means for you Summary
Snapshot
- This is a 2-bed/2.5-bath townhouse listed at $145k.
Deal economics
- At list price, monthly cash flow is $69 ($829/yr) — positive.
- The deal already cash-flows at list — no discount required.
- To meet the 1% rule (rent ≥ 1% of price), the offer needs to be $132k (9.0% below list).
- Recommended offer: $132k (9.0% below list) — sets the bar for 1% rule.
- Cap rate 6.9% vs local median 4.1% in Enterprise — top-decile yield for the area; either an underpriced asset or a hidden risk that comps aren't pricing in. Stress-test before assuming the spread holds.
Location & tenants
- Location reads 65/100 on livability (#127 in AL) — a middle-class / working-renter tenant base. Strengths: cost of living A+, housing A+; Watch: health & safety D, crime F, amenities F.
- Enterprise City (town): math 40% / reading 60% proficiency, ranked #12 of 129 in AL (top 9%) — acceptable for families but not a draw, mixed tenant base, ~2y average lease.
- Market conditions: Rents rising (+3.9%/yr); 444 active listings in the ZIP; 29 comparable units currently listed for rent nearby; rentals lingering (median 46d on market — plan ~5-8 weeks vacancy on turnover, expect pricing pressure); 100% of comp listings sitting > 30 days — soft ceiling on asking rent; solid renter incomes; 137 units permitted in Coffee County in 2024 (0 in 5+ unit buildings).
Forward outlook
- Local home prices are declining (-3.0%/yr); year-one equity from $1k of loan paydown is wiped out by about $4k of value loss. Plan a longer hold.
Negotiation context
- It's been on market 99 days — a 9% lower offer ($132k) is reasonable based on typical stale-listing flexibility.
- 7 sale attempts since 21y ago with the ask held roughly flat each time — persistent listings suggest the price (not the market) is what's stuck; bring a comps-based counter.
- Current owner paid $126k; 15% above their basis — modest negotiation headroom, anchor on the comps not their cost.
Risks & watch-outs
- Climate carrying-cost: severe wind risk, 99% chance of damaging wind over 30y; extreme-heat days projected 7→20/yr by 2055 (HVAC capex compounding) — expect insurance premiums to compound above CPI over the hold.
Questions for the listing agent
- It's been on market 99 days. Have you received any prior offers? Is the seller open to a 9% concession, seller financing, or rate buy-down credit?
- What does the HOA fee cover, when was the last increase, and are there any pending special assessments or reserve-fund shortfalls?
- Why hasn't it sold? Are there any deal-killer items the seller is aware of (foundation, flood, title, zoning, code violations)?
- Is there a deadline driving the sale (1031 exchange, divorce, estate, relocation)? That informs how much negotiation room exists.
- Crime grade is F in this area — have there been break-ins, vandalism, or insurance claims at this property in the last 3 years? What carrier currently insures it and at what premium?
- The area grade is low — what's the realistic commute time and amenity access for the typical tenant pool here? Any planned neighborhood developments (good or bad) we should know about?
- What's the average days-on-market for RENTAL listings here right now (not sales)? A rising rental-DOM trend means longer vacancies and softer asking-rent achievability than the comps imply.
- What's the recent tenant-quality profile in this submarket — average credit score on applications, eviction rate, late-payment / NSF rate, and stable-employment percentage? A property-management company in the area should have these aggregated.
- How much new for-sale + rental construction is in the pipeline within 1–3 miles? Heavy new supply typically softens prices + rents 12–24 months out; constrained supply supports both.
Investment metrics
- 1% rule
- 0.91% ✗
- Cap rate
- 6.86%
- Cash-on-cash
- 2.04%
- DSCR
- 1.09
- GRM
- 9.2
CMA / ARV
- ARV (median comp)
- $137,363
- List price
- $145,000
- Delta
- 5.56%
- Verdict
- FAIR
- Comps
- 20 within 1.0 mi
Show comp detail 12 sales within ~0.75 mi
| Address | Dist | Beds/Ba | Sqft | Sold | Price | $/sf | Match |
|---|---|---|---|---|---|---|---|
| 40 Woodfield Pl | 0.10mi | 2/2.5 | 1,380 (0%) | 3mo | $133,500 | $97 | 93 |
| 114 Baldwin Dr | 0.49mi | 2/2.5 | 1,404 (+2%) | 0mo | $140,000 | $100 | 74 |
| 164 S Springview Dr | 0.48mi | 2/2.5 | 1,404 (+2%) | 2mo | $143,500 | $102 | 73 |
| 120 Baldwin Dr | 0.50mi | 2/2.5 | 1,404 (+2%) | 1mo | $166,500 | $119 | 73 |
| 103 Wakefield Way | 0.62mi | 2/2.5 | 1,404 (+2%) | 2mo | $165,000 | $118 | 67 |
| 202 Foxchase Ln | 0.68mi | 2/2.5 | 1,392 (+1%) | 1mo | $148,000 | $106 | 66 |
| 152 Commons Dr | 0.47mi | 2/2.5 | 1,495 (+8%) | 4mo | $151,000 | $101 | 61 |
| 159 Commons Dr | 0.43mi | 3/2.5 (+1) | 1,494 (+8%) | 1mo | $173,500 | $116 | 61 |
| 3145 Achey Dr | 0.49mi | 2/1.5 | 1,278 (-7%) | 4mo | $140,000 | $110 | 57 |
| 155 S Spring View Dr | 0.50mi | 3/2.5 (+1) | 1,495 (+8%) | 2mo | $147,000 | $98 | 56 |
| 208 Ridgeway Dr | 0.60mi | 3/2.5 (+1) | 1,495 (+8%) | 1mo | $160,000 | $107 | 52 |
| 110 Foxchase Ln | 0.66mi | 3/2.5 (+1) | 1,500 (+9%) | 4mo | $165,000 | $110 | 46 |
Match score weights: distance 35% · size 25% · config 20% · recency 20%. Top-matched comps best support the ARV.
Projected returns pro-forma
-3.0% appreciation · 3.92% rent growth · sell at horizon
- IRR
- -12.1%
- Equity multiple
- 0.56×
- Total profit
- $-17,865
- Equity at exit
- $21,620
- IRR
- -1.6%
- Equity multiple
- 0.88×
- Total profit
- $-4,734
- Equity at exit
- $12,537
Cash invested: $40,600 (down + closing). Projections, not guarantees.
Landlord ↔ Tenant lean methodology
- Overall (STATE)
- 90 Strongly Landlord-Friendly
- State Alabama
- 90 Strongly Landlord-Friendly · R+15
- County
- — inherits STATE
- City
- — inherits STATE
ZIP-level market 36330
- Home prices YoY
- -19.4%
- Rents YoY
- 3.9%
- Active inventory
- 444
- Price-to-rent
- 9.2×
Monthly cashflow live
- Estimated rent
- $1,319 high interval (Pro) →
- Mortgage (P&I)
- −$760
- Tax from tax record
- −$82 /mo · $987/yr
- Insurance
- −$60
- HOA
- −$70
- Vacancy / Maint / Mgmt
- −$277
- Net cashflow
- $69
Break-even live
Sensitivity live
| Price | -10% $151 | -5% $110 | +0% $69 | +5% $28 | +10% $-13 |
|---|---|---|---|---|---|
| Rent | -10% $-35 | -5% $17 | +0% $69 | +5% $121 | +10% $173 |
| Rate | -1.0pp $142 | -0.5pp $106 | base $69 | +0.5pp $31 | +1.0pp $-7 |
UW: 25.0% down · 7.5% · 30yr · 1.5% tax · 5.0% vac · 8.0% maint · 8.0% mgmt
Financing live
Cash to close
- Down payment
- $36,250
- Closing costs
- $4,350
- Reserves months
- —
- Total cash needed
- —
Loan-product check · same deal, 3 products live
Conventional
25% down · 7.5% · 30yr
- Down + closing
- —
- Monthly P&I
- —
- Monthly cashflow
- —
- DSCR
- —
- Eligible?
- —
Personal DTI + credit; lowest rate.
DSCR
20% down · 8.5% · 30yr
- Down + closing
- —
- Monthly P&I
- —
- Monthly cashflow
- —
- DSCR
- —
- Eligible?
- —
No personal income docs; deal must DSCR.
Hard money
10% down · 12.0% · 12mo
- Down + closing
- —
- Monthly P&I
- —
- Monthly cashflow
- —
- DSCR
- —
- Eligible?
- —
Short-term bridge; refi at stabilization.
Rent comps 29 comps
| Address | Beds | Baths | Sqft | Rent | $/sqft | DOM | Units | Dist |
|---|---|---|---|---|---|---|---|---|
| 106 Pineridge Dr Enterprise, AL | 2.0 | 2.5 | 1427 | $1,150 | $0.81 | 45d | 1 | 0.02mi |
| 224 Candlebrook Dr Enterprise, AL | 2.0 | 1.5 | 1024 | $1,050 | $1.03 | 45d | 1 | 0.19mi |
| 220 Candlebrook Dr Enterprise, AL | 2.0 | 1.5 | 1024 | $995 | $0.97 | 45d | 1 | 0.19mi |
| 206 Myrtlewood Dr Enterprise, AL | 3.0 | 2.0 | 1155 | $1,400 | $1.21 | 45d | 1 | 0.24mi |
| 184 N Springview Dr Enterprise, AL | 3.0 | 2.5 | 1494 | $1,350 | $0.90 | 45d | 1 | 0.33mi |
| 160 N Springview Dr Enterprise, AL | 3.0 | 2.5 | 1495 | $1,350 | $0.90 | 45d | 1 | 0.38mi |
| 102 S Spring View Dr Enterprise, AL | 2.0 | 2.5 | 1404 | $1,300 | $0.93 | 45d | 1 | 0.40mi |
| 605 Melbourne Dr Enterprise, AL | 3.0 | 2.0 | 1333 | $1,650 | $1.24 | 45d | 1 | 0.40mi |
| 114 S Spring View Dr Enterprise, AL | 3.0 | 2.5 | 1494 | $1,300 | $0.87 | 45d | 1 | 0.41mi |
| 3101 Achey Dr Enterprise, AL | 2.0 | 1.5 | 1232 | $1,200 | $0.97 | 45d | 1 | 0.46mi |
| 137 Commons Dr Unit 1 Enterprise, AL | 2.0 | 2.5 | 1369 | $1,100 | $0.80 | 45d | 1 | 0.48mi |
| 133 Commons Dr Enterprise, AL | 3.0 | 2.5 | 1400 | $1,200 | $0.86 | 45d | 1 | 0.49mi |
| 118 Baldwin Dr Enterprise, AL | 3.0 | 2.5 | 1494 | $1,375 | $0.92 | 45d | 1 | 0.50mi |
| 25 Courtyard Way Enterprise, AL | 2.0 | 2.5 | 1632 | $1,250 | $0.77 | 45d | 1 | 0.50mi |
| 114 Commons Dr Enterprise, AL | 2.0 | 2.5 | 1380 | $1,300 | $0.94 | 45d | 1 | 0.54mi |
| 85 Courtyard Way Enterprise, AL | 3.0 | 2.5 | 1460 | $1,375 | $0.94 | 45d | 1 | 0.54mi |
| 102 Commons Dr Enterprise, AL | 2.0 | 2.5 | 1380 | $1,250 | $0.91 | 45d | 1 | 0.55mi |
| 210 Morgan Ln Enterprise, AL | 3.0 | 2.0 | 1494 | $1,300 | $0.87 | 45d | 1 | 0.56mi |
| 214 Morgan Ln Enterprise, AL | 3.0 | 2.0 | 1322 | $1,400 | $1.06 | 45d | 1 | 0.60mi |
| 107 Wakefield Way Enterprise, AL | 2.0 | 2.5 | 1369 | $1,350 | $0.99 | 45d | 1 | 0.62mi |
| 206 Wakefield Way Enterprise, AL | 2.0 | 2.5 | 1495 | $2,635 | $1.76 | 45d | 1 | 0.67mi |
| 108 Anthony Cir Unit C Enterprise, AL | 2.0 | 2.0 | 1032 | $900 | $0.87 | 45d | 1 | 0.75mi |
| 203 Winthrope Ln Enterprise, AL | 2.0 | 2.5 | 1365 | $1,325 | $0.97 | 45d | 1 | 0.78mi |
| 206 Myrick Dr Enterprise, AL | 3.0 | 2.0 | 1800 | $1,595 | $0.89 | 45d | 1 | 0.80mi |
| 155 Wingate Ave Enterprise, AL | 2.0 | 2.0 | 1600 | $1,450 | $0.91 | 45d | 1 | 0.84mi |
| 200 Cheyenne Dr Enterprise, AL | 2.0 | 1.5 | 1088 | $800 | $0.74 | 45d | 1 | 0.97mi |
| 452 Sandy Oak Dr Enterprise, AL | 2.0 | 1.5 | 1300 | $1,150 | $0.88 | 45d | 1 | 1.16mi |
| 455 Sandy Oak Dr Enterprise, AL | 3.0 | 2.5 | 1504 | $1,975 | $1.31 | 45d | 1 | 1.19mi |
| 443 Sandy Oak Dr Enterprise, AL | 2.0 | 2.5 | 1504 | $1,350 | $0.90 | 45d | 1 | 1.20mi |
HOA detail
- Monthly dues
- $70 · $840/yr
Listing history 30 events
-
2026-06-21days on market $145,000 Active 99 DOM
-
2026-06-19days on market $145,000 Active 97 DOM
-
2026-06-18days on market $145,000 Active 96 DOM
-
2026-06-17days on market $145,000 Active 95 DOM
-
2026-06-16days on market $145,000 Active 94 DOM
-
2026-06-15days on market $145,000 Active 93 DOM
-
2026-06-14days on market $145,000 Active 91 DOM
-
2026-06-12days on market $145,000 Active 90 DOM
-
2026-06-09days on market $145,000 Active 87 DOM
-
2026-06-08days on market $145,000 Active 86 DOM
-
2026-06-07days on market $145,000 Active 85 DOM
-
2026-06-05days on market $145,000 Active 82 DOM
-
2026-06-03days on market $145,000 Active 81 DOM
-
2026-06-02days on market $145,000 Active 80 DOM
-
2026-06-01days on market $145,000 Active 79 DOM
-
2026-05-31days on market $145,000 Active 78 DOM
-
2026-05-30days on market $145,000 Active 77 DOM
-
2026-03-14$145,000 Active 558-char remark
Show marketing remark (558 chars)
This charming 2-bedroom, 2.5-bathroom townhome offers carpeted upstairs bedrooms and LVP flooring in the living area. The galley-style kitchen comes with stainless steel appliances. Bedrooms are tucked away upstairs for extra privacy and comfort. Bathrooms are conveniently located on both levels, and the laundry room sits just off the foyer downstairs. Enjoy plenty of parking with a roomy one-car garage and concrete driveway. Ideally situated near shopping, schools, and restaurants, and just a short drive to Fort Rucker. Tenant occupied until May 2027.
-
2023-12-28soldstatus $126,000
-
2023-12-21soldstatus $126,000 Closed 591-char remark
Show marketing remark (591 chars)
Discover this attractive 2 bedroom, 2.5 bathroom townhouse, featuring fresh paint, new carpet upstairs and LVP flooring in the living area completed in 2021 ensuring a well maintained interior. The galley-style kitchen is equipped with stainless steel appliances combining practicality with a contemporary style. The bedrooms are conveniently situated upstairs for added privacy and comfort. This tenant occupied gem has so much to offer but also provides a fantastic investment opportunity for savvy buyers, current lease ends June 2024. Don't hesitate, call today to schedule your showing!
-
2023-10-21$126,900 591-char remark
Show marketing remark (591 chars)
Discover this attractive 2 bedroom, 2.5 bathroom townhouse, featuring fresh paint, new carpet upstairs and LVP flooring in the living area completed in 2021 ensuring a well maintained interior. The galley-style kitchen is equipped with stainless steel appliances combining practicality with a contemporary style. The bedrooms are conveniently situated upstairs for added privacy and comfort. This tenant occupied gem has so much to offer but also provides a fantastic investment opportunity for savvy buyers, current lease ends June 2024. Don't hesitate, call today to schedule your showing!
-
2021-06-14soldstatus $90,000
-
2021-06-11soldstatus $90,000
-
2021-06-11soldstatus $90,000
-
2021-04-01$94,500
-
2021-04-01$94,500
-
2013-07-17$76,500
-
2013-07-17$76,500
-
2005-10-31soldstatus $88,000
-
2005-09-30$88,000
ⓘ Source: listings_history table (triggers on properties + properties_extension) + one-shot
backfill from property_details.listing_events for pre-trigger history.
Tax reassessment forecast AL · Resets to sale price
- Current annual tax
- $987 · $82/mo
- Projected year-2 tax
- $987 · $82/mo
- Expected delta
- $0/yr ($0/mo · -0.0%)
ⓘ Screening estimate from a state-policy table — verify with the county assessor before closing.
Climate risk First Street
- Flood 1/10 Low FEMA zone X (unshaded) · 0% chance over 30 yrs
- Wildfire 3/10 Moderate
- Heat 8/10 Severe 7 d/yr ≥106°F today · 20 d/yr by 30 yrs out
- Wind 8/10 Severe 99% chance of damaging wind over 30 yrs
- Air quality 2/10 Low 0 unhealthy d/yr today · 1 by 30 yrs out
Nearby sold comps map
Loading sold comps map…
Walkable amenities ~0.75 mi
Loading nearby amenities…
Taxation est. · year 1
- Rental income
- $15,829
- − Mortgage interest
- −$8,122
- − Property taxes
- −$987
- − Insurance
- −$725
- − Repairs & maintenance
- −$1,266
- − Management
- −$1,266
- − HOA
- −$840
- − Depreciation
- −$4,218
- Taxable loss
- −$1,596
- Est. tax savings @ 24.0%
- +$383
- After-tax cash flow
- $1,211/yr
For passive investors: Depreciation is non-cash, so a rental often shows a tax loss while cash-flowing — sheltering income. Rental losses are passive: they offset passive income freely, and up to $25,000/yr can offset ordinary (W-2) income if you actively participate and your MAGI is under $100k (phasing out to $0 by $150k); unused losses carry forward. On sale, claimed depreciation is recaptured at up to 25%, and gains may owe capital-gains tax (a 1031 exchange can defer both). Figures are a year-1 estimate at your 24.0% rate — not tax advice; consult a CPA.
Schools (NCES district)
- District
- Enterprise City
- NCES district ID
- 0101320
- Math proficiency
- 40% ▼ -20.00%
- Reading proficiency
- 60% ▲ 4.00%
- Median HH income
- $51,311
- Composite
- 42.83/100
- National rank
- #3136
- State rank
- #12 of 129 in AL
Livability — Enterprise
- Score
- 65/100
- State rank
- #127
- US rank
- #12953
Category grades
Schools grade is shown separately in the Schools card above.
Census & demographics
- Census place
- Enterprise, AL
- County
- Coffee County · 39,557 people
- City population
- 39,557
- Metro
- Enterprise, AL
- Population (ZIP)
- 39,557
- Household income
- $75,765
- Rent vs Own
- Severe rent burden
- 1126.0
Population outlook (Coffee County) Hauer SSP2
- Today (2025)
- 53,133 people
- By 2030
- 53,832 · +1.3%
- By 2040
- 54,504 · +2.6%
- By 2050
- 54,289 · +2.2%
- By 2075
- 51,175 · -3.7%
- By 2100
- 46,793 · -11.9%
Race, ethnicity, and origin ACS 2023
- Neighborhood character
- Diverse neighborhood (Simpson 0.56)
- Race & ethnicity
- White 63% Black 17% Hispanic / Latino 13% Two or more races 9% Asian 1%
- Hispanic origin (detail)
- Mexican 6% Puerto Rican 3%
- Common ancestry
- Italian 3% Lithuanian 2% Serbian 2%
- Foreign-born
- 6% · Canada, Vietnam, South Korea
- Languages at home
- 89% English-only · Spanish 8% German/W. Germanic 2%
Political lean MEDSL · Coffee
- 2024 margin
- Solid R (+57.9) · D 20.7% · R 78.6%
- 2008→2024 swing
- -9.0pp toward R · 2008: -48.9pp · 2024: -57.9pp
- All cycles
- 2024: R+57.9 2020: R+53.1 2016: R+56.7 2012: R+49.4 2008: R+48.9
Not yet ingested
- Civics
- —
Market trends
- HPI YoY
- ▼ -44.44%
- Current HPI
- 184.0163
- Rent YoY
- ▲ 3.92%
- Metro
- Enterprise, AL
- State GDP YoY
- ▲ 2.94%
- F500 in state
- 4
Industry mix (Fortune 500 HQ in AL)
| Industry | F500 HQs | Revenue |
|---|---|---|
| Financial Services | 1 | $8B |
|
||
| Healthcare | 1 | $5B |
|
||
Price history
+64.8% since first listed13 events — show timeline
- 2026-03-14 Listed $145,000 WBR
- 2023-12-28 Sold (Public Records) $126,000 Public Records
- 2023-12-21 Sold (MLS) $126,000 WBR
- 2023-10-21 Listed $126,900 WBR
- 2021-06-14 Sold (Public Records) $90,000 Public Records
- 2021-06-11 Sold (MLS) $90,000 WBR
- 2021-06-11 Sold (MLS) $90,000 MAAR
- 2021-04-01 Listed $94,500 WBR
- 2021-04-01 Listed $94,500 MAAR
- 2013-07-17 Listed $76,500 MAAR
- 2013-07-17 Listed $76,500 WBR
- 2005-10-31 Sold (MLS) $88,000 MAAR
- 2005-09-30 Listed $88,000 MAAR
Property tax history
+8.9%/yrLatest (2025): $987 · +7.3% YoY. Source: county tax records.
Cash-flow waterfall
monthlySold comps — $/sqft
last 12 mo · ≤1 miLoading sold comps…