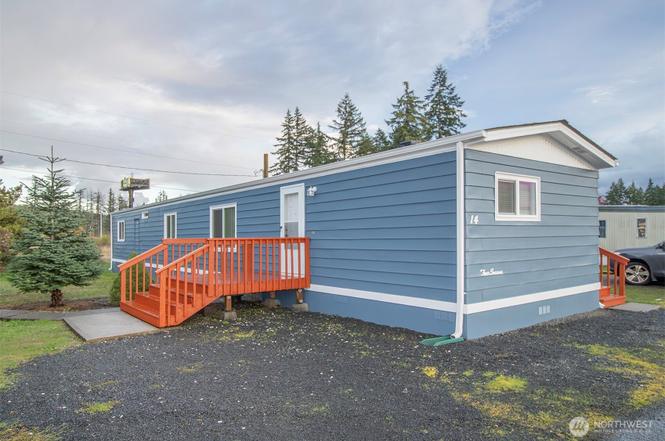
6201 203rd Ave SW #14 · Grand Mound, WA
Flood risk 1/10 · Minimal
- FEMA flood zone
- X (unshaded)
- Chance of flooding over 30 yrs
- 0.0%
- Est. flood insurance / yr
- $507 – $1,088
Fire risk 4/10 · Minor
- Est. fire insurance / yr
- $604 – $1,122
Heat risk 3/10 · Minor
- Hot days now (above 89°F)
- 7 days/yr
- Hot days in 30 yrs
- 14 days/yr
Wind risk 1/10 · Minimal
- Chance of severe wind over 30 yrs
- —
Air-quality risk 6/10 · Moderate
- Unhealthy air days now
- 8 days/yr
- Unhealthy air days in 30 yrs
- 8 days/yr
Risk factors via First Street. Map © Google.
Why this score? — see what drove the B grade
The composite is a weighted blend of 9 inputs, each scored 0–100. Each bar is that input's sub-score; the figure is the points it added to the 100-point composite (weight × sub-score).
- Cash flow +30.0/30.0
- 1% rule +10.0/10.0
- DSCR +10.0/10.0
- ARV discount +7.5/15.0
- Schools +4.9/10.0
- Rent growth +3.2/5.0
- Livability +3.1/5.0
- Condition / age +2.5/5.0
- Appreciation +0.0/10.0
$95,000
🖨 Deal sheet 📄 Offer letter ✓ Due diligence
Listing remarks
Beautifully refreshed 954 +/- sf home in Grand Mound! 2 bedroom and 1 bathroom. Fresh interior and exterior paint. All new doors, windows and blinds. New LVP flooring throughout. All new appliances in kitchen. Washer and Dryer hookups. New roof. New storage shed. All ages park just a few minutes off I5 with a quick commute to Centralia and Olympia.
Key facts
- New doors
- New appliances
- New lvp flooring
Tags
Property features AI
Finance
- Other: Number of homes in park: 16
- Financial info: Listing terms: Cash or Conventional; Tax annual amount: $189
- HOA & community: Sunny Acres Community LLC; Park approved for sale; 16 homes in the park; Land lease: $715 (monthly); Pets allowed — see remarks; Senior exemption: no
Exterior
- Parking: Uncovered parking; 2 open parking spaces
- Utilities: Electric energy source; Public water (Thurston County); Community septic; Power by Puget Sound Energy; Comcast/Xfinity cable and internet; Electric water heater
- Home design: Manufactured home (single wide); One story; Faces north; Manufactured after 6/15/1976; Model: FSEAS 68/14; Make: Four Seasons; Mobile home remains; Property type: Residential — Manufactured Home; Condition: Very good
- Construction: Metal/vinyl and wood construction; Composition roof; Concrete ribbon foundation; Built as a manufactured house
- Exterior features: Metal/vinyl and wood exterior; Patio/porch/deck; New shed in back; Dead-end street; Paved access; Has a view
Interior
- Kitchen: Dishwasher; Refrigerator; Stove/Range
- Bedrooms: 2 bedrooms
- Flooring: Vinyl; Vinyl plank
- Bathrooms: 1 full bathroom with bathtub and shower
- Heating & cooling: Forced air heating; No cooling
- Interior features: Water heater; Kitchen without eating space; Double pane windows
- Laundry & utility: Exterior closet water heater
Neighborhood map
What this means for you Summary
Snapshot
- This is a 2-bed/1.0-bath manufactured listed at $95k.
Deal economics
- At list price, monthly cash flow is $639 ($8k/yr) — positive.
- The deal already cash-flows at list — no discount required.
- Meets the 1% rule at list price ($2k rent vs $95k).
- Recommended offer: $84k (12.0% below list) — sets the bar for market timing.
- Cap rate 14.4% vs local median 2.6% in Grand Mound — top-decile yield for the area; either an underpriced asset or a hidden risk that comps aren't pricing in. Stress-test before assuming the spread holds.
Location & tenants
- Location reads 61/100 on livability (#446 in WA) — a middle-class / working-renter tenant base. Strengths: housing A+, crime B+; Watch: health & safety C-, employment D, amenities F.
- Rochester School District (rural): math 53% / reading 57% proficiency, ranked #97 of 291 in WA (top 33%) — acceptable for families but not a draw, mixed tenant base, ~2y average lease.
- Zoned schools: Grand Mound Elementary (499 students, 66% FRL); Rochester High School (600 students, 51% FRL).
- Market conditions: Rents rising (+3.0%/yr); 258 active listings in the ZIP; 1,222 units permitted in Thurston County in 2024 (508 in 5+ unit buildings).
Forward outlook
- Local home prices are declining (-3.0%/yr); year-one equity from $657 of loan paydown is wiped out by about $3k of value loss. Plan a longer hold.
- Thurston County population projected at +27% by 2050 — long-run rental-demand tailwind backs the buy-and-hold thesis.
- At projected returns (-3.0% appreciation + 3.0% rent growth), your $27k cash investment doubles in ~5 years — after that, you're playing with house money.
Negotiation context
- It's been on market 231 days — a 12% lower offer ($84k) is reasonable based on typical stale-listing flexibility.
Questions for the listing agent
- It's been on market 231 days. Have you received any prior offers? Is the seller open to a 12% concession, seller financing, or rate buy-down credit?
- Built in 1979 — when were the roof, HVAC, electrical panel, plumbing, and water heater last replaced?
- Why hasn't it sold? Are there any deal-killer items the seller is aware of (foundation, flood, title, zoning, code violations)?
- Is there a deadline driving the sale (1031 exchange, divorce, estate, relocation)? That informs how much negotiation room exists.
- Schools are F-rated, which usually means shorter tenancies and higher turnover. Who's the typical renter profile here, and what's been the actual vacancy rate?
- What's the average days-on-market for RENTAL listings here right now (not sales)? A rising rental-DOM trend means longer vacancies and softer asking-rent achievability than the comps imply.
- What's the recent tenant-quality profile in this submarket — average credit score on applications, eviction rate, late-payment / NSF rate, and stable-employment percentage? A property-management company in the area should have these aggregated.
- How much new for-sale + rental construction is in the pipeline within 1–3 miles? Heavy new supply typically softens prices + rents 12–24 months out; constrained supply supports both.
Investment metrics
- 1% rule
- 1.59% ✓
- Cap rate
- 14.37%
- Cash-on-cash
- 28.83%
- DSCR
- 2.28
- GRM
- 5.2
CMA / ARV
No comps found within radius.
Projected returns pro-forma
-3.0% appreciation · 3.0% rent growth · sell at horizon
- IRR
- 23.1%
- Equity multiple
- 1.95×
- Total profit
- $25,270
- Equity at exit
- $14,165
- IRR
- 31.1%
- Equity multiple
- 3.79×
- Total profit
- $74,260
- Equity at exit
- $8,214
Cash invested: $26,600 (down + closing). Projections, not guarantees.
Landlord ↔ Tenant lean methodology
- Overall (STATE)
- 28 Tenant-Leaning
- State Washington
- 28 Tenant-Leaning · D+8
- County
- — inherits STATE
- City
- — inherits STATE
ZIP-level market 98531
- Rents YoY
- 3.0%
- Active inventory
- 258
- Price-to-rent
- 5.2×
Monthly cashflow live
- Estimated rent
- $1,513 medium interval (Pro) →
- Mortgage (P&I)
- −$498
- Tax from tax record
- −$19 /mo · $225/yr
- Insurance
- −$40
- HOA
- −$0
- Vacancy / Maint / Mgmt
- −$318
- Net cashflow
- $639
Break-even live
UW: 25.0% down · 7.5% · 30yr · 1.5% tax · 5.0% vac · 8.0% maint · 8.0% mgmt
Financing live
Cash to close
- Down payment
- $23,750
- Closing costs
- $2,850
- Reserves months
- —
- Total cash needed
- —
Loan-product check · same deal, 3 products live
Conventional
25% down · 7.5% · 30yr
- Down + closing
- —
- Monthly P&I
- —
- Monthly cashflow
- —
- DSCR
- —
- Eligible?
- —
Personal DTI + credit; lowest rate.
DSCR
20% down · 8.5% · 30yr
- Down + closing
- —
- Monthly P&I
- —
- Monthly cashflow
- —
- DSCR
- —
- Eligible?
- —
No personal income docs; deal must DSCR.
Hard money
10% down · 12.0% · 12mo
- Down + closing
- —
- Monthly P&I
- —
- Monthly cashflow
- —
- DSCR
- —
- Eligible?
- —
Short-term bridge; refi at stabilization.
Listing history 18 events
-
2026-06-18days on market $95,000 Active 231 DOM
-
2026-06-17days on market $95,000 Active 230 DOM
-
2026-06-16days on market $95,000 Active 229 DOM
-
2026-06-15days on market $95,000 Active 228 DOM
-
2026-06-14days on market $95,000 Active 226 DOM
-
2026-06-13days on market $95,000 Active 225 DOM
-
2026-06-10days on market $95,000 Active 223 DOM
-
2026-06-09days on market $95,000 Active 222 DOM
-
2026-06-08days on market $95,000 Active 221 DOM
-
2026-06-07days on market $95,000 Active 220 DOM
-
2026-06-05days on market $95,000 Active 217 DOM
-
2026-06-02days on market $95,000 Active 215 DOM
-
2026-06-01days on market $95,000 Active 214 DOM
-
2026-05-31days on market $95,000 Active 213 DOM
-
2026-05-30days on market $95,000 Active 212 DOM
-
2026-04-14price $95,000
-
2025-11-26price $97,000
-
2025-10-30$99,000 Active
ⓘ Source: listings_history table (triggers on properties + properties_extension) + one-shot
backfill from property_details.listing_events for pre-trigger history.
Tax reassessment forecast WA · Resets to sale price
- Current annual tax
- $225 · $19/mo
- Projected year-2 tax
- $931 · $78/mo
- Expected delta
- +$706/yr (+$59/mo · 313.9%)
ⓘ Screening estimate from a state-policy table — verify with the county assessor before closing.
Climate risk First Street
- Flood 1/10 Low FEMA zone X (unshaded) · 0% chance over 30 yrs
- Wildfire 4/10 Moderate
- Heat 3/10 Moderate 7 d/yr ≥89°F today · 14 d/yr by 30 yrs out
- Wind 1/10 Low
- Air quality 6/10 Major 8 unhealthy d/yr today · 8 by 30 yrs out
Nearby sold comps map
Loading sold comps map…
Walkable amenities ~0.75 mi
Loading nearby amenities…
Taxation est. · year 1
- Rental income
- $18,161
- − Mortgage interest
- −$5,321
- − Property taxes
- −$225
- − Insurance
- −$475
- − Repairs & maintenance
- −$1,453
- − Management
- −$1,453
- − Depreciation
- −$2,764
- Taxable income
- $6,470
- Est. tax owed @ 24.0%
- −$1,553
- After-tax cash flow
- $6,116/yr
For passive investors: Depreciation is non-cash, so a rental often shows a tax loss while cash-flowing — sheltering income. Rental losses are passive: they offset passive income freely, and up to $25,000/yr can offset ordinary (W-2) income if you actively participate and your MAGI is under $100k (phasing out to $0 by $150k); unused losses carry forward. On sale, claimed depreciation is recaptured at up to 25%, and gains may owe capital-gains tax (a 1031 exchange can defer both). Figures are a year-1 estimate at your 24.0% rate — not tax advice; consult a CPA.
Schools (NCES district)
- District
- Rochester School District
- NCES district ID
- 5307470
- Math proficiency
- 53% ▲ 5.00%
- Reading proficiency
- 57% ▲ 1.00%
- Median HH income
- $56,231
- Composite
- 49.33/100
- National rank
- #4348
- State rank
- #97 of 291 in WA
Livability — Grand Mound
- Score
- 61/100
- State rank
- #446
- US rank
- #18178
Category grades
Schools grade is shown separately in the Schools card above.
Census & demographics
- Census place
- Grand Mound, WA
- County
- Lewis County · 27,337 people
- Metro
- Centralia, WA
- Population (ZIP)
- 27,337
- Household income
- $63,406
- Rent vs Own
- Severe rent burden
- 1000.0
Population outlook (Thurston County) Hauer SSP2
- Today (2025)
- 308,239 people
- By 2030
- 326,483 · +5.9%
- By 2040
- 359,890 · +16.8%
- By 2050
- 391,800 · +27.1%
- By 2075
- 468,024 · +51.8%
- By 2100
- 519,890 · +68.7%
Race, ethnicity, and origin ACS 2023
- Neighborhood character
- Predominantly White (74%)
- Race & ethnicity
- White 74% Hispanic / Latino 19% Two or more races 10% Asian 1%
- Hispanic origin (detail)
- Mexican 15% Puerto Rican 1%
- Common ancestry
- Portuguese 3% Slovak 3% Lithuanian 2%
- Foreign-born
- 9% · Canada, Vietnam
- Languages at home
- 83% English-only · Spanish 16% Tagalog/Filipino 1%
Political lean MEDSL · Thurston
- 2024 margin
- Strong D (+20.4) · D 58.5% · R 38.1% · Other 3.5%
- 2008→2024 swing
- -1.3pp toward R · 2008: 21.7pp · 2024: 20.4pp
- All cycles
- 2024: D+20.4 2020: D+18.6 2016: D+15.4 2012: D+19.0 2008: D+21.7
Not yet ingested
- Civics
- —
Market trends
- HPI YoY
- ▼ -249.98%
- Current HPI
- 378.6936
- Rent YoY
- ▲ 3.00%
- Metro
- Centralia, WA
- State GDP YoY
- ▲ 4.65%
- F500 in state
- 22
Industry mix (Fortune 500 HQ in WA)
| Industry | F500 HQs | Revenue |
|---|---|---|
| Retail | 2 | $269B |
|
||
| Technology / Retail | 1 | $638B |
|
||
| Technology | 1 | $245B |
|
||
| Telecommunications | 1 | $38B |
|
||
| Food / Beverage | 1 | $36B |
|
||
| Automotive / Trucks | 1 | $34B |
|
||
Price history
-4.0% since first listed3 events — show timeline
- 2026-04-14 Price Changed $95,000 NWMLS as Distributed by MLS Grid
- 2025-11-26 Price Changed $97,000 NWMLS as Distributed by MLS Grid
- 2025-10-30 Listed $99,000 NWMLS as Distributed by MLS Grid
Property tax history
+0.1%/yrLatest (2026): $225 · +19.1% YoY. Source: county tax records.
Cash-flow waterfall
monthlySold comps — $/sqft
last 12 mo · ≤1 miLoading sold comps…