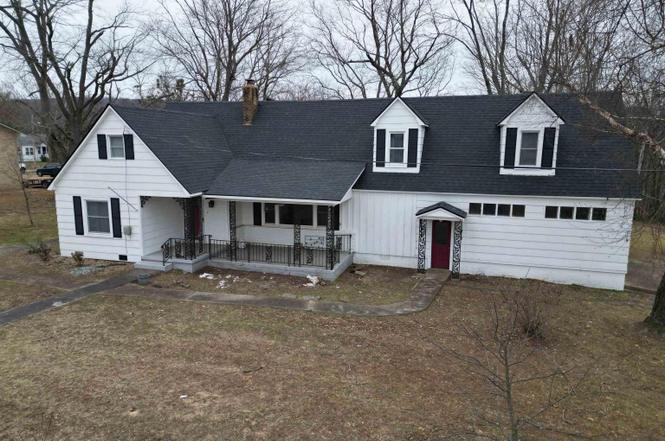
303 Campus St · Marshall, AR
Flood risk No data
- FEMA flood zone
- —
- Chance of flooding over 30 yrs
- —
- Est. flood insurance / yr
- —
Fire risk No data
- Est. fire insurance / yr
- —
Heat risk No data
- Hot days now (above threshold)
- —
- Hot days in 30 yrs
- —
Wind risk No data
- Chance of severe wind over 30 yrs
- —
Air-quality risk No data
- Unhealthy air days now
- —
- Unhealthy air days in 30 yrs
- —
Risk factors via First Street. Map © Google.
Why this score? — see what drove the D grade
The composite is a weighted blend of 9 inputs, each scored 0–100. Each bar is that input's sub-score; the figure is the points it added to the 100-point composite (weight × sub-score).
- Cash flow +12.8/30.0
- ARV discount +7.5/15.0
- Appreciation +5.0/10.0
- DSCR +3.8/10.0
- Livability +3.3/5.0
- Schools +3.2/10.0
- 1% rule +2.9/10.0
- Rent growth +2.5/5.0
- Condition / age +2.5/5.0
$161,500
🖨 Deal sheet (PDF) 📄 Offer letter ✓ Due diligence
Listing remarks
BRAND NEW ROOF on a vintage craftsman style house with plenty of charm and character. Inside the city limits, and within walking distance to downtown Marshall, this home is just the right size. With all the nooks and crannies, this home stands out differently from so many others. With a little TLC you could bring this up to date, or keep the retro look alive and well. There are plenty of rooms for family members, a study, storage, game room, office, and hobby room. Protect your vehicles with the garage and carport in the back yard. There is a shed out back for more storage or a small shop. Majestic trees cover the back yard giving shade and more a more manageable yard than a rural lot. Be
Key facts
- Office
- Study
- Storage
Tags
Property features AI
Finance
- Financial info: Financing options include VA, FHA, conventional, rural development or cash
Exterior
- Parking: Garage; Carport; Parking pads
- Utilities: Public water; Public sewer
- Home design: Wood exterior
- Construction: Crawl space foundation; Architectural shingle roof
- Exterior features: Patio; Deck; Outside storage area; Paved road access; Sloped lot; Located inside city limits
Interior
- Kitchen: Electric range; Refrigerator stays
- Flooring: Carpet; Vinyl
- Bathrooms: Three full bathrooms
- Heating & cooling: Central electric cooling; Mini-split system
- Interior features: Washer connection; washer and dryer stay; Wood-burning stove; Sheet rock, paneling and wallpaper on walls/ceilings
- Laundry & utility: Laundry room; Washer connection; washer and dryer stay
Neighborhood map
What this means for you Summary
Snapshot
- This is a 4-bed/3.0-bath single-family listed at $162k.
Deal economics
- At list price, monthly cash flow is $-15 ($-178/yr) — negative.
- To cash-flow at today's rent, offer at most $159k (1.6% below list).
- To meet the 1% rule (rent ≥ 1% of price), the offer needs to be $128k (20.6% below list).
- Recommended offer: $128k (20.6% below list) — sets the bar for 1% rule.
- Cap rate 6.2% vs local median 3.5% in Marshall — top-decile yield for the area; either an underpriced asset or a hidden risk that comps aren't pricing in. Stress-test before assuming the spread holds.
Location & tenants
- Location reads 66/100 on livability (#115 in AR) — a middle-class / working-renter tenant base. Strengths: cost of living A+, housing A+, health & safety A+; Watch: crime D-, amenities F, commute F.
- Searcy County School District (rural): math 39% / reading 40% proficiency, ranked #82 of 238 in AR (top 34%) — families likely to look elsewhere, expect single-tenant / working-renter base with shorter leases.
- Zoned schools: Marshall Elementary School (math 64% / reading 34%, grade D, #93 of 454 statewide, top 23%, 293 students, 99% FRL); Leslie Elementary School (math 47% / reading 37%, grade D-, #78 of 201 statewide, top 40%, 190 students, 98% FRL); Marshall High School (math 28% / reading 43%, grade F, #85 of 292 statewide, top 30%, 358 students, 99% FRL) — zoned schools average 99% FRL vs 57% district-wide (42 pts higher); higher-poverty schools than district average — tighter screening recommended.
- Market conditions: 80 active listings in the ZIP.
Forward outlook
- In year one you build about $6k of equity ($1k loan paydown + $5k appreciation (3.0% local appreciation)).
- Searcy County population projected at -26% by 2050 — secular population decline; favor cash flow + early exit over multi-decade hold.
- At projected returns (3.0% appreciation + 3.0% rent growth), your $45k cash investment doubles in ~7 years — after that, you're playing with house money.
- By year 6, paydown + projected appreciation supports a ~$32k cash-out refi (75% LTV) — recoverable capital for the next deal without selling this one.
Negotiation context
- It's been on market 315 days — a 12% lower offer ($142k) is reasonable based on typical stale-listing flexibility.
- 2 sale attempts; this cycle's ask has dropped $8k (5%) from the opening price — seller is motivated, your offer sets the floor, not the list.
Risks & watch-outs
- Watch-outs: built in 1947 — expect roof / HVAC / electrical / plumbing capex.
Questions for the listing agent
- What do current leases actually rent for vs. the listed asking? Can we see a recent rent roll and the last 12 months of T-12 income?
- It's been on market 315 days. Have you received any prior offers? Is the seller open to a 21% concession, seller financing, or rate buy-down credit?
- Built in 1947 — when were the roof, HVAC, electrical panel, plumbing, and water heater last replaced?
- Why hasn't it sold? Are there any deal-killer items the seller is aware of (foundation, flood, title, zoning, code violations)?
- Is there a deadline driving the sale (1031 exchange, divorce, estate, relocation)? That informs how much negotiation room exists.
- Schools are D-rated, which usually means shorter tenancies and higher turnover. Who's the typical renter profile here, and what's been the actual vacancy rate?
- Crime grade is D in this area — have there been break-ins, vandalism, or insurance claims at this property in the last 3 years? What carrier currently insures it and at what premium?
- The area grade is low — what's the realistic commute time and amenity access for the typical tenant pool here? Any planned neighborhood developments (good or bad) we should know about?
- What's the average days-on-market for RENTAL listings here right now (not sales)? A rising rental-DOM trend means longer vacancies and softer asking-rent achievability than the comps imply.
- What's the recent tenant-quality profile in this submarket — average credit score on applications, eviction rate, late-payment / NSF rate, and stable-employment percentage? A property-management company in the area should have these aggregated.
- How much new for-sale + rental construction is in the pipeline within 1–3 miles? Heavy new supply typically softens prices + rents 12–24 months out; constrained supply supports both.
Investment metrics
- 1% rule
- 0.79% ✗
- Cap rate
- 6.18%
- Cash-on-cash
- -0.39%
- DSCR
- 0.98
- GRM
- 10.5
CMA / ARV
No comps found within radius.
Projected returns pro-forma
3.0% appreciation · 3.0% rent growth · sell at horizon
- IRR
- 7.1%
- Equity multiple
- 1.41×
- Total profit
- $18,475
- Equity at exit
- $72,617
- IRR
- 9.9%
- Equity multiple
- 2.48×
- Total profit
- $67,071
- Equity at exit
- $111,912
Cash invested: $45,220 (down + closing). Projections, not guarantees.
Landlord ↔ Tenant lean methodology
- Overall (STATE)
- 92 Strongly Landlord-Friendly
- State Arkansas
- 92 Strongly Landlord-Friendly · R+14
- County
- — inherits STATE
- City
- — inherits STATE
ZIP-level market 72650
- Active inventory
- 80
- Price-to-rent
- 10.5×
Monthly cashflow live
- Estimated rent
- $1,283 medium interval (Pro) →
- Mortgage (P&I)
- −$847
- Tax from tax record
- −$114 /mo · $1,370/yr
- Insurance
- −$67
- HOA
- −$0
- Vacancy / Maint / Mgmt
- −$269
- Net cashflow
- $-15
Break-even live
Sensitivity live
| Price | -10% $77 | -5% $31 | +0% $-15 | +5% $-61 | +10% $-106 |
|---|---|---|---|---|---|
| Rent | -10% $-116 | -5% $-66 | +0% $-15 | +5% $36 | +10% $87 |
| Rate | -1.0pp $66 | -0.5pp $26 | base $-15 | +0.5pp $-57 | +1.0pp $-99 |
UW: 25.0% down · 7.5% · 30yr · 1.5% tax · 5.0% vac · 8.0% maint · 8.0% mgmt
Financing live
Cash to close
- Down payment
- $40,375
- Closing costs
- $4,845
- Reserves months
- —
- Total cash needed
- —
Loan-product check · same deal, 3 products live
Conventional
25% down · 7.5% · 30yr
- Down + closing
- —
- Monthly P&I
- —
- Monthly cashflow
- —
- DSCR
- —
- Eligible?
- —
Personal DTI + credit; lowest rate.
DSCR
20% down · 8.5% · 30yr
- Down + closing
- —
- Monthly P&I
- —
- Monthly cashflow
- —
- DSCR
- —
- Eligible?
- —
No personal income docs; deal must DSCR.
Hard money
10% down · 12.0% · 12mo
- Down + closing
- —
- Monthly P&I
- —
- Monthly cashflow
- —
- DSCR
- —
- Eligible?
- —
Short-term bridge; refi at stabilization.
Listing history 21 events
-
2026-06-19status $161,500 Under Contract 315 DOM
-
2026-06-18days on market $161,500 Take Backups 315 DOM
-
2026-06-17days on market $161,500 Take Backups 314 DOM
-
2026-06-16days on market $161,500 Take Backups 313 DOM
-
2026-06-15days on market $161,500 Take Backups 312 DOM
-
2026-06-14days on market $161,500 Take Backups 310 DOM
-
2026-06-12days on market $161,500 Take Backups 309 DOM
-
2026-06-09days on market $161,500 Take Backups 306 DOM
-
2026-06-08days on market $161,500 Take Backups 305 DOM
-
2026-06-07days on market $161,500 Take Backups 304 DOM
-
2026-06-07days on market $161,500 Take Backups 303 DOM
-
2026-06-04statusdays on market $161,500 Take Backups 300 DOM
-
2026-06-02days on market $161,500 Escape Clause 299 DOM
-
2026-06-01days on market $161,500 Escape Clause 298 DOM
-
2026-05-31days on market $161,500 Escape Clause 297 DOM
-
2026-05-31days on market $161,500 Escape Clause 296 DOM
-
2026-04-17historical Escape Clause
-
2025-10-04price $161,500
-
2025-08-07$170,000 New Listing
-
2025-07-25historical
-
2025-05-22$175,000 New Listing
ⓘ Source: listings_history table (triggers on properties + properties_extension) + one-shot
backfill from property_details.listing_events for pre-trigger history.
Tax reassessment forecast AR · Resets to sale price
- Current annual tax
- $1,370 · $114/mo
- Projected year-2 tax
- $1,370 · $114/mo
- Expected delta
- $0/yr ($0/mo · 0.0%)
ⓘ Screening estimate from a state-policy table — verify with the county assessor before closing.
Nearby sold comps map
Loading sold comps map…
Walkable amenities ~0.75 mi
Loading nearby amenities…
Taxation est. · year 1
- Rental income
- $15,395
- − Mortgage interest
- −$9,047
- − Property taxes
- −$1,370
- − Insurance
- −$808
- − Repairs & maintenance
- −$1,232
- − Management
- −$1,232
- − Depreciation
- −$4,698
- Taxable loss
- −$2,990
- Est. tax savings @ 24.0%
- +$718
- After-tax cash flow
- $539/yr
For passive investors: Depreciation is non-cash, so a rental often shows a tax loss while cash-flowing — sheltering income. Rental losses are passive: they offset passive income freely, and up to $25,000/yr can offset ordinary (W-2) income if you actively participate and your MAGI is under $100k (phasing out to $0 by $150k); unused losses carry forward. On sale, claimed depreciation is recaptured at up to 25%, and gains may owe capital-gains tax (a 1031 exchange can defer both). Figures are a year-1 estimate at your 24.0% rate — not tax advice; consult a CPA.
Schools (NCES district)
- District
- Searcy County School District
- NCES district ID
- 0509480
- Math proficiency
- 39% ▼ -16.00%
- Reading proficiency
- 40% ▼ -10.00%
- Median HH income
- $31,222
- Composite
- 32.28/100
- National rank
- #5751
- State rank
- #82 of 238 in AR
Livability — Marshall
- Score
- 66/100
- State rank
- #115
- US rank
- #11273
Category grades
Schools grade is shown separately in the Schools card above.
Census & demographics
- Census place
- Marshall, AR
- Population (ZIP)
- 4,462
Population outlook (Searcy County) Hauer SSP2
- Today (2025)
- 7,091 people
- By 2030
- 6,656 · -6.1%
- By 2040
- 5,868 · -17.2%
- By 2050
- 5,250 · -26.0%
- By 2075
- 4,407 · -37.9%
- By 2100
- 3,834 · -45.9%
Race, ethnicity, and origin ACS 2023
- Neighborhood character
- Predominantly White (88%)
- Race & ethnicity
- White 88% Two or more races 9% Hispanic / Latino 3% Native American 2%
- Common ancestry
- Iranian 4% Romanian 2% Italian 1%
- Foreign-born
- 1% · Canada
- Languages at home
- 97% English-only · Spanish 2%
Political lean MEDSL · Searcy
- 2024 margin
- Solid R (+72.2) · D 13.2% · R 85.4% · Other 1.4%
- 2008→2024 swing
- -26.3pp toward R · 2008: -45.9pp · 2024: -72.2pp
- All cycles
- 2024: R+72.2 2020: R+69.1 2016: R+63.7 2012: R+51.0 2008: R+45.9
Not yet ingested
- Civics
- —
Market trends
- HPI YoY
- —
- Current HPI
- —
- Rent YoY
- —
- Metro
- —
- State GDP YoY
- ▲ 3.80%
- F500 in state
- 10
Industry mix (Fortune 500 HQ in AR)
| Industry | F500 HQs | Revenue |
|---|---|---|
| Retail | 1 | $681B |
|
||
| Food / Agriculture | 1 | $53B |
|
||
| Retail / Energy | 1 | $22B |
|
||
| Transportation / Logistics | 1 | $12B |
|
||
| Energy | 1 | $4B |
|
||
Price history
-7.7% since first listed5 events — show timeline
- 2026-04-17 Contingent — CARMLS
- 2025-10-04 Price Changed $161,500 CARMLS
- 2025-08-07 Listed $170,000 CARMLS
- 2025-07-25 Listing Removed — CARMLS
- 2025-05-22 Listed $175,000 CARMLS
Property tax history
+5.8%/yrLatest (2025): $1,370 · +31.4% YoY. Source: county tax records.
Cash-flow waterfall
monthlySold comps — $/sqft
last 12 mo · ≤1 miLoading sold comps…