774 Rain St NE · Ocean Shores, WA
Flood risk 1/10 · Minimal
- FEMA flood zone
- X (unshaded)
- Chance of flooding over 30 yrs
- 0.0%
- Est. flood insurance / yr
- $507 – $1,088
Fire risk 1/10 · Minimal
- Est. fire insurance / yr
- $604 – $1,122
Heat risk 1/10 · Minimal
- Hot days now (above 72°F)
- 7 days/yr
- Hot days in 30 yrs
- 16 days/yr
Wind risk 1/10 · Minimal
- Chance of severe wind over 30 yrs
- —
Air-quality risk 5/10 · Moderate
- Unhealthy air days now
- 6 days/yr
- Unhealthy air days in 30 yrs
- 6 days/yr
Risk factors via First Street. Map © Google.
Why this score? — see what drove the C- grade
The composite is a weighted blend of 9 inputs, each scored 0–100. Each bar is that input's sub-score; the figure is the points it added to the 100-point composite (weight × sub-score).
- Cash flow +16.5/30.0
- ARV discount +15.0/15.0
- DSCR +5.1/10.0
- 1% rule +3.8/10.0
- Schools +3.4/10.0
- Livability +3.1/5.0
- Rent growth +2.5/5.0
- Condition / age +2.5/5.0
- Appreciation +0.0/10.0
$149,500
🖨 Deal sheet 📄 Offer letter ✓ Due diligence
Listing remarks
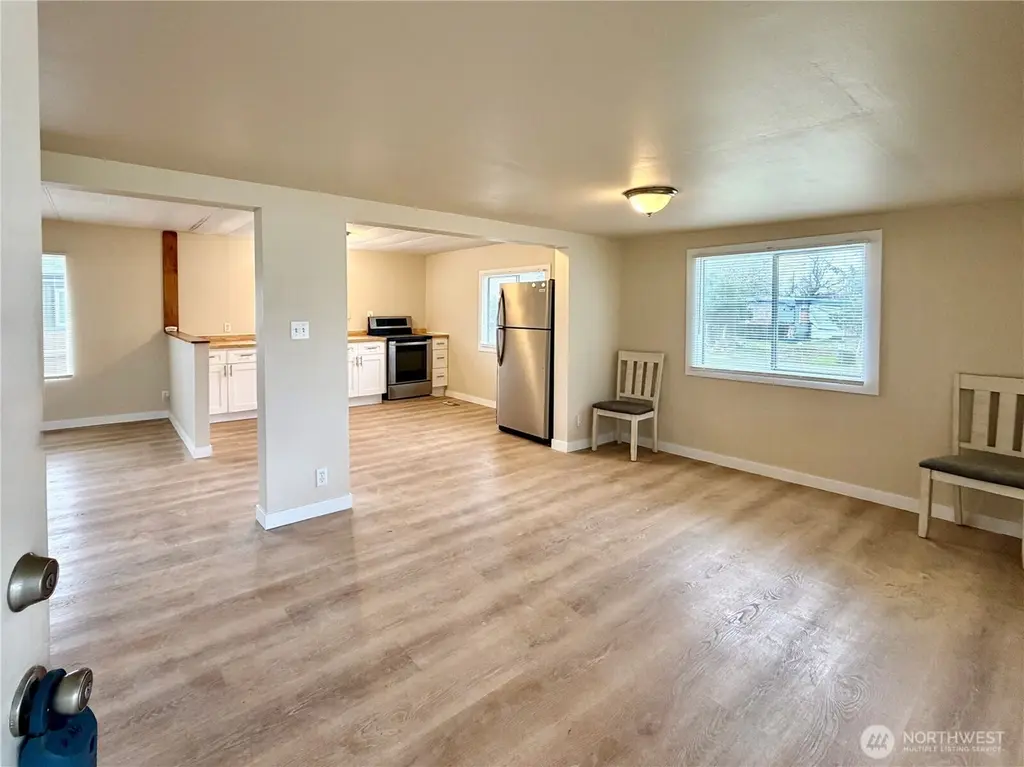
Owner financing available! Open-concept kitchen, dining and spacious living room create an inviting and functional layout, ideal for everyday living or entertaining. Recent updates include newer kitchen appliances, countertops, updated baseboards, LVP flooring throughout, fresh interior paint, and updated window treatments. Covered front entry to get out of the weather, fully covered back area, perfect for outdoor fun and relaxing, with a convenient storage area. Ideally located within walking distance to town amenities including shopping, dining, movies, golf, the beach, and more. Most recently operated as a long-term rental, continue as an investment or easily transition into a vacation g
Key facts
- Recent updates
- Open-concept kitchen
- Covered front entry
Tags
Neighborhood map
What this means for you Summary
Snapshot
- This is a 2-bed/1.0-bath manufactured listed at $150k.
Deal economics
- At list price, monthly cash flow is $88 ($1k/yr) — positive.
- The deal already cash-flows at list — no discount required.
- To meet the 1% rule (rent ≥ 1% of price), the offer needs to be $132k (12.0% below list).
- Recommended offer: $132k (12.0% below list) — sets the bar for 1% rule.
- Cap rate 7.0% vs local median 3.1% in Ocean Shores — top-decile yield for the area; either an underpriced asset or a hidden risk that comps aren't pricing in. Stress-test before assuming the spread holds.
Location & tenants
- Location reads 62/100 on livability (#424 in WA) — a middle-class / working-renter tenant base. Strengths: housing A; Watch: schools C-, crime C-, health & safety C-.
- North Beach School District (rural): math 32% / reading 44% proficiency, ranked #236 of 291 in WA (top 81%) — families likely to look elsewhere, expect single-tenant / working-renter base with shorter leases; 63% free/reduced lunch — lower-income household profile, screen leases tightly.
- Market conditions: 653 active listings in the ZIP; 2 comparable units currently listed for rent nearby; 297 units permitted in Grays Harbor County in 2024 (17 in 5+ unit buildings).
Forward outlook
- Local home prices are declining (-3.0%/yr); year-one equity from $1k of loan paydown is wiped out by about $4k of value loss. Plan a longer hold.
- Grays Harbor County population projected at -24% by 2050 — secular population decline; favor cash flow + early exit over multi-decade hold.
Negotiation context
- It's been on market 137 days — a 12% lower offer ($132k) is reasonable based on typical stale-listing flexibility.
- 2 sale attempts with the ask held roughly flat each time — persistent listings suggest the price (not the market) is what's stuck; bring a comps-based counter.
- Current owner paid $65k; list at $150k implies a 130% gain — meaningful room to come down on a strong offer.
Questions for the listing agent
- It's been on market 137 days. Have you received any prior offers? Is the seller open to a 12% concession, seller financing, or rate buy-down credit?
- Built in 1972 — when were the roof, HVAC, electrical panel, plumbing, and water heater last replaced?
- Why hasn't it sold? Are there any deal-killer items the seller is aware of (foundation, flood, title, zoning, code violations)?
- Is there a deadline driving the sale (1031 exchange, divorce, estate, relocation)? That informs how much negotiation room exists.
- What's the average days-on-market for RENTAL listings here right now (not sales)? A rising rental-DOM trend means longer vacancies and softer asking-rent achievability than the comps imply.
- What's the recent tenant-quality profile in this submarket — average credit score on applications, eviction rate, late-payment / NSF rate, and stable-employment percentage? A property-management company in the area should have these aggregated.
- How much new for-sale + rental construction is in the pipeline within 1–3 miles? Heavy new supply typically softens prices + rents 12–24 months out; constrained supply supports both.
Investment metrics
- 1% rule
- 0.88% ✗
- Cap rate
- 7.00%
- Cash-on-cash
- 2.52%
- DSCR
- 1.11
- GRM
- 9.5
CMA / ARV
- ARV (median comp)
- $269,500
- List price
- $149,500
- Delta
- -44.53%
- Verdict
- UNDERPRICED
- Comps
- 7 within 1.0 mi
Show comp detail 2 sales within ~0.75 mi
| Address | Dist | Beds/Ba | Sqft | Sold | Price | $/sf | Match |
|---|---|---|---|---|---|---|---|
| 131 Victoria Loop NE | 0.36mi | 1/1.0 (-1) | 716 (-1%) | 10mo | $97,375 | $136 | 69 |
| 108 Victoria Loop NE | 0.39mi | 2/1.0 | 784 (+9%) | 13mo | $80,000 | $102 | 56 |
Match score weights: distance 35% · size 25% · config 20% · recency 20%. Top-matched comps best support the ARV.
Projected returns pro-forma
-3.0% appreciation · 3.0% rent growth · sell at horizon
- IRR
- -12.3%
- Equity multiple
- 0.55×
- Total profit
- $-18,656
- Equity at exit
- $22,291
- IRR
- -3.3%
- Equity multiple
- 0.78×
- Total profit
- $-9,159
- Equity at exit
- $12,926
Cash invested: $41,860 (down + closing). Projections, not guarantees.
Landlord ↔ Tenant lean methodology
- Overall (STATE)
- 28 Tenant-Leaning
- State Washington
- 28 Tenant-Leaning · D+8
- County
- — inherits STATE
- City
- — inherits STATE
ZIP-level market 98569
- Home prices YoY
- -3.4%
- Active inventory
- 653
- Price-to-rent
- 9.5×
Monthly cashflow live
- Estimated rent
- $1,315 medium interval (Pro) →
- Mortgage (P&I)
- −$784
- Tax from tax record
- −$105 /mo · $1,256/yr
- Insurance
- −$62
- HOA
- −$0
- Vacancy / Maint / Mgmt
- −$276
- Net cashflow
- $88
Break-even live
UW: 25.0% down · 7.5% · 30yr · 1.5% tax · 5.0% vac · 8.0% maint · 8.0% mgmt
Financing live
Cash to close
- Down payment
- $37,375
- Closing costs
- $4,485
- Reserves months
- —
- Total cash needed
- —
Loan-product check · same deal, 3 products live
Conventional
25% down · 7.5% · 30yr
- Down + closing
- —
- Monthly P&I
- —
- Monthly cashflow
- —
- DSCR
- —
- Eligible?
- —
Personal DTI + credit; lowest rate.
DSCR
20% down · 8.5% · 30yr
- Down + closing
- —
- Monthly P&I
- —
- Monthly cashflow
- —
- DSCR
- —
- Eligible?
- —
No personal income docs; deal must DSCR.
Hard money
10% down · 12.0% · 12mo
- Down + closing
- —
- Monthly P&I
- —
- Monthly cashflow
- —
- DSCR
- —
- Eligible?
- —
Short-term bridge; refi at stabilization.
Rent comps 2 comps
| Address | Beds | Baths | Sqft | Rent | $/sqft | DOM | Units | Dist |
|---|---|---|---|---|---|---|---|---|
| 165 Barnacle St Unit 503 Ocean Shores, WA | 1.0 | 1.0 | 725 | $950 | $1.31 | 43d | 1 | 0.33mi |
| 672 Ocean Shores Blvd NW Ocean Shores, WA | 1.0 | 1.0 | 700 | $1,150 | $1.64 | 43d | 1 | 0.49mi |
Listing history 11 events
-
2026-06-05statusdays on market $149,500 Pending 137 DOM
-
2026-06-03days on market $149,500 Active 136 DOM
-
2026-06-02days on market $149,500 Active 135 DOM
-
2026-06-01days on market $149,500 Active 134 DOM
-
2026-05-31days on market $149,500 Active 133 DOM
-
2026-05-30days on market $149,500 Active 132 DOM
-
2026-03-02status Active
-
2026-02-20status Pending
-
2026-01-08$149,500 Active
-
2018-05-14soldstatus $65,000
-
2008-05-21soldstatus $67,596
ⓘ Source: listings_history table (triggers on properties + properties_extension) + one-shot
backfill from property_details.listing_events for pre-trigger history.
Tax reassessment forecast WA · Resets to sale price
- Current annual tax
- $1,256 · $105/mo
- Projected year-2 tax
- $1,465 · $122/mo
- Expected delta
- +$209/yr (+$17/mo · 16.7%)
ⓘ Screening estimate from a state-policy table — verify with the county assessor before closing.
Climate risk First Street
- Flood 1/10 Low FEMA zone X (unshaded) · 0% chance over 30 yrs
- Wildfire 1/10 Low
- Heat 1/10 Low 7 d/yr ≥72°F today · 16 d/yr by 30 yrs out
- Wind 1/10 Low
- Air quality 5/10 Major 6 unhealthy d/yr today · 6 by 30 yrs out
Nearby sold comps map
Loading sold comps map…
Walkable amenities ~0.75 mi
Loading nearby amenities…
Taxation est. · year 1
- Rental income
- $15,780
- − Mortgage interest
- −$8,374
- − Property taxes
- −$1,256
- − Insurance
- −$748
- − Repairs & maintenance
- −$1,262
- − Management
- −$1,262
- − Depreciation
- −$4,349
- Taxable loss
- −$1,471
- Est. tax savings @ 24.0%
- +$353
- After-tax cash flow
- $1,408/yr
For passive investors: Depreciation is non-cash, so a rental often shows a tax loss while cash-flowing — sheltering income. Rental losses are passive: they offset passive income freely, and up to $25,000/yr can offset ordinary (W-2) income if you actively participate and your MAGI is under $100k (phasing out to $0 by $150k); unused losses carry forward. On sale, claimed depreciation is recaptured at up to 25%, and gains may owe capital-gains tax (a 1031 exchange can defer both). Figures are a year-1 estimate at your 24.0% rate — not tax advice; consult a CPA.
Schools (NCES district)
- District
- North Beach School District
- NCES district ID
- 5305700
- Math proficiency
- 32% ▼ -4.00%
- Reading proficiency
- 44% ▬ 0.00%
- Median HH income
- $40,966
- Composite
- 34.46/100
- National rank
- #10153
- State rank
- #236 of 291 in WA
Livability — Ocean Shores
- Score
- 62/100
- State rank
- #424
- US rank
- #16852
Category grades
Schools grade is shown separately in the Schools card above.
Census & demographics
- Census place
- Ocean Shores, WA
- County
- Grays Harbor County · 44,693 people
- City population
- 7,187
- Metro
- Aberdeen, WA
- Population (ZIP)
- 7,489
- Household income
- $58,378
- Rent vs Own
- Severe rent burden
- 172.0
Population outlook (Grays Harbor County) Hauer SSP2
- Today (2025)
- 66,443 people
- By 2030
- 63,255 · -4.8%
- By 2040
- 56,466 · -15.0%
- By 2050
- 50,516 · -24.0%
- By 2075
- 39,296 · -40.9%
- By 2100
- 31,142 · -53.1%
Race, ethnicity, and origin ACS 2023
- Neighborhood character
- Predominantly White (86%)
- Race & ethnicity
- White 86% Two or more races 5% Hispanic / Latino 4% Asian 3% Native American 3%
- Common ancestry
- Portuguese 8% Iranian 5% Lithuanian 4%
- Foreign-born
- 5% · Canada
- Languages at home
- 92% English-only · Spanish 3% Tagalog/Filipino 2% German/W. Germanic 2%
Political lean MEDSL · Grays Harbor
- 2024 margin
- Lean R (+6.0) · D 45.6% · R 51.6% · Other 2.8%
- 2008→2024 swing
- -20.6pp toward R · 2008: 14.6pp · 2024: -6.0pp
- All cycles
- 2024: R+6.0 2020: R+6.6 2016: R+7.1 2012: D+14.0 2008: D+14.6
Not yet ingested
- Civics
- —
Market trends
- HPI YoY
- ▼ -13.33%
- Current HPI
- 380.05
- Rent YoY
- —
- Metro
- Aberdeen, WA
- State GDP YoY
- ▲ 4.65%
- F500 in state
- 22
Industry mix (Fortune 500 HQ in WA)
| Industry | F500 HQs | Revenue |
|---|---|---|
| Retail | 2 | $269B |
|
||
| Technology / Retail | 1 | $638B |
|
||
| Technology | 1 | $245B |
|
||
| Telecommunications | 1 | $38B |
|
||
| Food / Beverage | 1 | $36B |
|
||
| Automotive / Trucks | 1 | $34B |
|
||
Price history
+121.2% since first listed5 events — show timeline
- 2026-03-02 Relisted — NWMLS as Distributed by MLS Grid
- 2026-02-20 Pending — NWMLS as Distributed by MLS Grid
- 2026-01-08 Listed $149,500 NWMLS as Distributed by MLS Grid
- 2018-05-14 Sold (Public Records) $65,000 Public Records
- 2008-05-21 Sold (Public Records) $67,596 Public Records
Property tax history
+5.0%/yrLatest (2026): $1,256 · +4.1% YoY. Source: county tax records.
Cash-flow waterfall
monthlySold comps — $/sqft
last 12 mo · ≤1 miLoading sold comps…