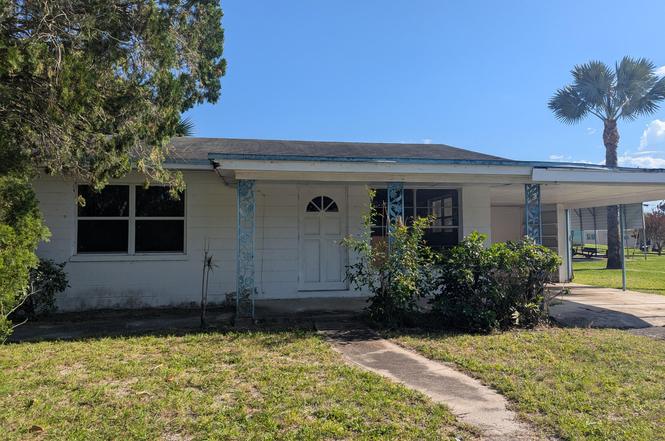
1705 Juanita Ave · Fort Pierce, FL
Flood risk 1/10 · Minimal
- FEMA flood zone
- X (unshaded)
- Chance of flooding over 30 yrs
- 0.0%
- Est. flood insurance / yr
- $507 – $1,088
Fire risk 1/10 · Minimal
- Est. fire insurance / yr
- $947 – $1,759
Heat risk 10/10 · Severe
- Hot days now (above 106°F)
- 7 days/yr
- Hot days in 30 yrs
- 26 days/yr
Wind risk 10/10 · Severe
- Chance of severe wind over 30 yrs
- 99.0%
Air-quality risk 2/10 · Minimal
- Unhealthy air days now
- 2 days/yr
- Unhealthy air days in 30 yrs
- 2 days/yr
Risk factors via First Street. Map © Google.
Why this score? — see what drove the A grade
The composite is a weighted blend of 9 inputs, each scored 0–100. Each bar is that input's sub-score; the figure is the points it added to the 100-point composite (weight × sub-score).
- Cash flow +30.0/30.0
- ARV discount +15.0/15.0
- DSCR +10.0/10.0
- 1% rule +9.7/10.0
- Appreciation +8.0/10.0
- Livability +3.8/5.0
- Schools +3.7/10.0
- Rent growth +2.5/5.0
- Condition / age +2.5/5.0
$115,000
🖨 Deal sheet (PDF) 📄 Offer letter ✓ Due diligence
Listing remarks
CBS 2 bedroom 1 bath plus utility room with 1/2 bath is ready for your vision. Home has terrazzo & tile floors and real wood vintage kitchen cabinets. Located close to downtown, airport, beaches, shops and more. This is a Fannie Mae HECM HomePath property.
Key facts
- Close to airport
- Tile floors
- Utility room
Tags
Property features AI
Exterior
- Parking: Two total parking spaces; Attached carport (covered) with one carport space; One open parking space
- Utilities: Public water; Septic tank sewer; Electricity connected; Water connected
- Home design: Single-family residence; One story; Resale condition; Faces north
- Construction: CBS construction; Shingle and other roof types; Built as single-story (year built not provided)
- Exterior features: Not waterfront
Interior
- Kitchen: No specific kitchen appliances listed
- Bedrooms: One bedroom on the main level
- Flooring: Carpet; Tile; Other flooring
- Bathrooms: One full bathroom; One half bathroom
- Interior features: No notable interior features reported
- Laundry & utility: No laundry appliances listed
Neighborhood map
What this means for you Summary
Snapshot
- This is a 2-bed/1.5-bath single-family listed at $115k.
Deal economics
- At list price, monthly cash flow is $476 ($6k/yr) — positive.
- The deal already cash-flows at list — no discount required.
- Meets the 1% rule at list price ($2k rent vs $115k).
- Cap rate 11.3% vs local median 3.5% in Fort Pierce — top-decile yield for the area; either an underpriced asset or a hidden risk that comps aren't pricing in. Stress-test before assuming the spread holds.
Location & tenants
- Location reads 76/100 on livability (#226 in FL, #3,360 nationally) — a middle-class / working-renter tenant base. Strengths: commute A+, cost of living A+, housing A+; Watch: crime D+, amenities F, employment F.
- St. Lucie (urban): math 40% / reading 48% proficiency, ranked #51 of 73 in FL (top 70%) — families likely to look elsewhere, expect single-tenant / working-renter base with shorter leases.
- Zoned schools: Manatee Academy K-8 (math 53% / reading 51%, grade C-, #990 of 2,144 statewide, top 48%, 1,664 students, 65% FRL); Southern Oaks Middle School (math 39% / reading 43%, grade F, #353 of 571 statewide, top 63%, 894 students, 76% FRL); Fort Pierce Central High School (math 15% / reading 45%, grade F, #441 of 667 statewide, top 67%, 3,091 students, 62% FRL).
- Market conditions: 133 active listings in the ZIP; 27 comparable units currently listed for rent nearby; rentals at typical pace (median 26d on market — plan ~3-4 weeks tenant-placement turnaround); 4,868 units permitted in St. Lucie County in 2024 (268 in 5+ unit buildings).
Forward outlook
- In year one you build about $8k of equity ($795 loan paydown + $7k appreciation (5.9% local appreciation)).
- St. Lucie County population projected at +20% by 2050 — long-run rental-demand tailwind backs the buy-and-hold thesis.
- At projected returns (5.9% appreciation + 3.0% rent growth), your $32k cash investment doubles in ~3 years — after that, you're playing with house money.
- By year 5, paydown + projected appreciation supports a ~$33k cash-out refi (75% LTV) — recoverable capital for the next deal without selling this one.
Negotiation context
- Only 6 days on market — expect competitive offers; lowballing is unlikely to land.
- Current owner paid $62k; list at $115k implies a 85% gain — meaningful room to come down on a strong offer.
Risks & watch-outs
- Climate carrying-cost: severe wind risk, 99% chance of damaging wind over 30y; extreme-heat days projected 7→26/yr by 2055 (HVAC capex compounding) — expect insurance premiums to compound above CPI over the hold.
Questions for the listing agent
- Built in 1961 — when were the roof, HVAC, electrical panel, plumbing, and water heater last replaced?
- Is there a deadline driving the sale (1031 exchange, divorce, estate, relocation)? That informs how much negotiation room exists.
- Schools are D-rated, which usually means shorter tenancies and higher turnover. Who's the typical renter profile here, and what's been the actual vacancy rate?
- Crime grade is D in this area — have there been break-ins, vandalism, or insurance claims at this property in the last 3 years? What carrier currently insures it and at what premium?
- What's the average days-on-market for RENTAL listings here right now (not sales)? A rising rental-DOM trend means longer vacancies and softer asking-rent achievability than the comps imply.
- What's the recent tenant-quality profile in this submarket — average credit score on applications, eviction rate, late-payment / NSF rate, and stable-employment percentage? A property-management company in the area should have these aggregated.
- How much new for-sale + rental construction is in the pipeline within 1–3 miles? Heavy new supply typically softens prices + rents 12–24 months out; constrained supply supports both.
Investment metrics
- 1% rule
- 1.47% ✓
- Cap rate
- 11.26%
- Cash-on-cash
- 17.75%
- DSCR
- 1.79
- GRM
- 5.7
CMA / ARV
- ARV (on-the-fly)
- $166,634
- Comps found
- 3
Show comp detail 3 sales within ~0.75 mi
| Address | Dist | Beds/Ba | Sqft | Sold | Price | $/sf | Match |
|---|---|---|---|---|---|---|---|
| 1904 Rosarita Ave | 0.25mi | 2/1.0 | 696 (-8%) | 20mo | $130,000 | $187 | 57 |
| 1605 N 17th St | 0.60mi | 2/1.0 | 782 (+4%) | 15mo | $174,900 | $224 | 51 |
| 1903 Avenue O | 0.63mi | 3/1.0 (+1) | 816 (+8%) | 12mo | $180,000 | $221 | 40 |
Match score weights: distance 35% · size 25% · config 20% · recency 20%. Top-matched comps best support the ARV.
Projected returns pro-forma
5.92% appreciation · 3.0% rent growth · sell at horizon
- IRR
- 30.1%
- Equity multiple
- 2.96×
- Total profit
- $63,066
- Equity at exit
- $71,718
- IRR
- 28.1%
- Equity multiple
- 6.03×
- Total profit
- $162,025
- Equity at exit
- $129,563
Cash invested: $32,200 (down + closing). Projections, not guarantees.
Landlord ↔ Tenant lean methodology
- Overall (STATE)
- 87 Strongly Landlord-Friendly
- State Florida
- 87 Strongly Landlord-Friendly · R+3
- County
- — inherits STATE
- City
- — inherits STATE
ZIP-level market 34946
- Home prices YoY
- 1.7%
- Active inventory
- 133
- Price-to-rent
- 5.7×
Monthly cashflow live
- Estimated rent
- $1,692 high interval (Pro) →
- Mortgage (P&I)
- −$603
- Tax from tax record
- −$210 /mo · $2,517/yr
- Insurance
- −$48
- HOA
- −$0
- Vacancy / Maint / Mgmt
- −$355
- Net cashflow
- $476
Break-even live
Sensitivity live
| Price | -10% $541 | -5% $509 | +0% $476 | +5% $444 | +10% $411 |
|---|---|---|---|---|---|
| Rent | -10% $343 | -5% $409 | +0% $476 | +5% $543 | +10% $610 |
| Rate | -1.0pp $534 | -0.5pp $506 | base $476 | +0.5pp $447 | +1.0pp $416 |
UW: 25.0% down · 7.5% · 30yr · 1.5% tax · 5.0% vac · 8.0% maint · 8.0% mgmt
Financing live
Cash to close
- Down payment
- $28,750
- Closing costs
- $3,450
- Reserves months
- —
- Total cash needed
- —
Loan-product check · same deal, 3 products live
Conventional
25% down · 7.5% · 30yr
- Down + closing
- —
- Monthly P&I
- —
- Monthly cashflow
- —
- DSCR
- —
- Eligible?
- —
Personal DTI + credit; lowest rate.
DSCR
20% down · 8.5% · 30yr
- Down + closing
- —
- Monthly P&I
- —
- Monthly cashflow
- —
- DSCR
- —
- Eligible?
- —
No personal income docs; deal must DSCR.
Hard money
10% down · 12.0% · 12mo
- Down + closing
- —
- Monthly P&I
- —
- Monthly cashflow
- —
- DSCR
- —
- Eligible?
- —
Short-term bridge; refi at stabilization.
Rent comps 27 comps
| Address | Beds | Baths | Sqft | Rent | $/sqft | DOM | Units | Dist |
|---|---|---|---|---|---|---|---|---|
| 1910 Juanita Ave Fort Pierce, FL | 3.0 | 2.0 | 1100 | $2,000 | $1.82 | 16d | 1 | 0.17mi |
| 2107 San Marcos Ave Fort Pierce, FL | 2.0 | 1.0 | 625 | $1,171 | $1.87 | 23d | 1 | 0.29mi |
| 1710 N 21st St Fort Pierce, FL | 3.0 | 1.0 | 968 | $2,100 | $2.17 | 16d | 1 | 0.56mi |
| 1601 N 17th St Fort Pierce, FL | 2.0 | 1.0 | 996 | $1,650 | $1.66 | 25d | 1 | 0.64mi |
| 2017 N 3rd St Fort Pierce, FL | 1.0 | 1.0 | 600 | $1,650 | $2.75 | 25d | 1 | 0.65mi |
| 1610 N 25th St Unit 10 Fort Pierce, FL | 2.0 | 1.0 | 740 | $1,600 | $2.16 | 25d | 1 | 0.74mi |
| 1610 N 25th St Unit 1 Fort Pierce, FL | 2.0 | 1.0 | 740 | $1,600 | $2.16 | 16d | 1 | 0.74mi |
| 1610 N 25th St Unit 13 Fort Pierce, FL | 2.0 | 1.0 | 740 | $1,550 | $2.09 | 25d | 1 | 0.74mi |
| 2760 Seneca Ave Fort Pierce, FL | 2.0 | 1.0 | 837 | $1,500 | $1.79 | 25d | 1 | 0.74mi |
| 2202 N AVE Unit A Fort Pierce, FL | 2.0 | 1.0 | 585 | $1,500 | $2.56 | 25d | 1 | 0.75mi |
| 1408 N 23rd St Fort Pierce, FL | 3.0 | 1.0 | 1110 | $1,900 | $1.71 | 16d | 1 | 0.80mi |
| 1220 Avenue L Unit A Fort Pierce, FL | 3.0 | 1.0 | 850 | $1,700 | $2.00 | 25d | 1 | 0.89mi |
| 3101 Avenue T Fort Pierce, FL | 2.0 | 2.0 | 1064 | $1,980 | $1.86 | 25d | 1 | 0.93mi |
| 3002 Avenue Q Fort Pierce, FL | 2.0 | 1.0 | 864 | $1,900 | $2.20 | 25d | 1 | 0.94mi |
| 1225 Avenue K Fort Pierce, FL | 3.0 | 1.0 | 837 | $1,700 | $2.03 | 25d | 1 | 0.99mi |
| 907 N 20th St Apt B Fort Pierce, FL | 3.0 | 1.0 | 980 | $1,800 | $1.84 | 25d | 1 | 1.06mi |
| 2804 Avenue J Fort Pierce, FL | 3.0 | 1.0 | 816 | $2,000 | $2.45 | 16d | 1 | 1.15mi |
| 1405 Avenue G Apt A Fort Pierce, FL | 3.0 | 2.0 | 1064 | $2,200 | $2.07 | 25d | 1 | 1.20mi |
| 1604 Avenue E Fort Pierce, FL | 2.0 | 1.0 | 713 | $1,350 | $1.89 | 16d | 1 | 1.25mi |
| 1617 Avenue E Fort Pierce, FL | 3.0 | 1.0 | 1100 | $1,800 | $1.64 | 25d | 1 | 1.27mi |
| 1127 E Avenue Unit A Fort Pierce, FL | 2.0 | 1.0 | 784 | $1,800 | $2.30 | 23d | 1 | 1.36mi |
| 701 N 9th St Unit B Fort Pierce, FL | 2.0 | 2.0 | 740 | $1,395 | $1.89 | 25d | 1 | 1.36mi |
| 529 N 11th St Fort Pierce, FL | 2.0 | 2.0 | 634 | $1,200 | $1.89 | 23d | 1 | 1.38mi |
| 1607 Avenue D Fort Pierce, FL | 3.0 | 2.0 | 1029 | $1,700 | $1.65 | 16d | 1 | 1.40mi |
| 508 Means Ct Fort Pierce, FL | 3.0 | 3.0 | 826 | $1,950 | $2.36 | 16d | 1 | 1.42mi |
| 508 Means Ct Unit A Fort Pierce, FL | 1.0 | 1.0 | 826 | $775 | $0.94 | 25d | 1 | 1.42mi |
| 434 N 17th St Fort Pierce, FL | 2.0 | 1.0 | 712 | $1,500 | $2.11 | 25d | 1 | 1.43mi |
Listing history 5 events
-
2026-06-16statusdays on market $115,000 Pending 6 DOM
-
2026-06-15days on market $115,000 Active 5 DOM
-
2026-06-14days on market $115,000 Active 3 DOM
-
2026-06-13remarks 258-char remark
-
2026-06-13$115,000 Active 2 DOM
ⓘ Source: listings_history table (triggers on properties + properties_extension) + one-shot
backfill from property_details.listing_events for pre-trigger history.
Tax reassessment forecast FL · Resets to sale price
- Current annual tax
- $2,517 · $210/mo
- Projected year-2 tax
- $2,517 · $210/mo
- Expected delta
- $0/yr ($0/mo · 0.0%)
ⓘ Screening estimate from a state-policy table — verify with the county assessor before closing.
Climate risk First Street
- Flood 1/10 Low FEMA zone X (unshaded) · 0% chance over 30 yrs
- Wildfire 1/10 Low
- Heat 10/10 Extreme 7 d/yr ≥106°F today · 26 d/yr by 30 yrs out
- Wind 10/10 Extreme 99% chance of damaging wind over 30 yrs
- Air quality 2/10 Low 2 unhealthy d/yr today · 2 by 30 yrs out
Nearby sold comps map
Loading sold comps map…
Walkable amenities ~0.75 mi
Loading nearby amenities…
Taxation est. · year 1
- Rental income
- $20,310
- − Mortgage interest
- −$6,442
- − Property taxes
- −$2,517
- − Insurance
- −$575
- − Repairs & maintenance
- −$1,625
- − Management
- −$1,625
- − Depreciation
- −$3,345
- Taxable income
- $4,181
- Est. tax owed @ 24.0%
- −$1,003
- After-tax cash flow
- $4,713/yr
For passive investors: Depreciation is non-cash, so a rental often shows a tax loss while cash-flowing — sheltering income. Rental losses are passive: they offset passive income freely, and up to $25,000/yr can offset ordinary (W-2) income if you actively participate and your MAGI is under $100k (phasing out to $0 by $150k); unused losses carry forward. On sale, claimed depreciation is recaptured at up to 25%, and gains may owe capital-gains tax (a 1031 exchange can defer both). Figures are a year-1 estimate at your 24.0% rate — not tax advice; consult a CPA.
Schools (NCES district)
- District
- St. Lucie
- NCES district ID
- 1201770
- Math proficiency
- 40% ▼ -11.00%
- Reading proficiency
- 48% ▼ -4.00%
- Median HH income
- $44,737
- Composite
- 37.28/100
- National rank
- #4449
- State rank
- #51 of 73 in FL
Livability — Fort Pierce
- Score
- 76/100
- State rank
- #226
- US rank
- #3360
Category grades
Schools grade is shown separately in the Schools card above.
Census & demographics
- Census place
- Fort Pierce, FL
- City population
- 78,556
- Population (ZIP)
- 6,588
Population outlook (St. Lucie County) Hauer SSP2
- Today (2025)
- 338,016 people
- By 2030
- 355,687 · +5.2%
- By 2040
- 385,521 · +14.1%
- By 2050
- 406,106 · +20.1%
- By 2075
- 441,054 · +30.5%
- By 2100
- 436,885 · +29.2%
Race, ethnicity, and origin ACS 2023
- Neighborhood character
- Diverse neighborhood (Simpson 0.68)
- Race & ethnicity
- Black 36% Hispanic / Latino 34% White 26% Two or more races 18% Native American 4% Asian 1%
- Hispanic origin (detail)
- Mexican 16% Puerto Rican 2% Cuban 2% Salvadoran 1%
- Common ancestry
- Lithuanian 1% Slovak 1% Portuguese 1%
- Foreign-born
- 25% · Canada, Dominican Republic
- Languages at home
- 70% English-only · Spanish 28% Other Indo-European 1%
Political lean MEDSL · St. Lucie
- 2024 margin
- Lean R (+9.1) · D 45.1% · R 54.2%
- 2008→2024 swing
- -21.2pp toward R · 2008: 12.1pp · 2024: -9.1pp
- All cycles
- 2024: R+9.1 2020: R+1.6 2016: R+2.5 2012: D+7.9 2008: D+12.1
Not yet ingested
- Civics
- —
Market trends
- HPI YoY
- ▲ 5.92%
- Current HPI
- 351.3324
- Rent YoY
- —
- Metro
- —
- State GDP YoY
- ▲ 3.28%
- F500 in state
- 36
Industry mix (Fortune 500 HQ in FL)
| Industry | F500 HQs | Revenue |
|---|---|---|
| Industrial Technology | 2 | $29B |
|
||
| Insurance | 2 | $17B |
|
||
| Retail | 1 | $60B |
|
||
| Technology Distribution | 1 | $58B |
|
||
| Homebuilding | 1 | $35B |
|
||
| Technology Manufacturing | 1 | $35B |
|
||
Price history
+666.7% since first listed4 events — show timeline
- 2026-06-09 Listed $115,000 Beaches MLS
- 1996-02-05 Sold (Public Records) $62,000 Public Records
- 1995-07-06 Sold (Public Records) $38,000 Public Records
- 1994-04-07 Sold (Public Records) $15,000 Public Records
Property tax history
+36.1%/yrLatest (2025): $2,517 · +3.8% YoY. Source: county tax records.
Cash-flow waterfall
monthlySold comps — $/sqft
last 12 mo · ≤1 miLoading sold comps…