 🌊 Lakefront
603 Davis St #907 · Austin, TX
Flood risk 7/10 · Major
- FEMA flood zone
- X (shaded)
- Chance of flooding over 30 yrs
- 0.78%
- Est. flood insurance / yr
- $507 – $1,088
Fire risk 1/10 · Minimal
- Est. fire insurance / yr
- $1,222 – $2,270
Heat risk 8/10 · Major
- Hot days now (above 108°F)
- 6 days/yr
- Hot days in 30 yrs
- 19 days/yr
Wind risk 8/10 · Major
- Chance of severe wind over 30 yrs
- 80.0%
Air-quality risk 2/10 · Minimal
- Unhealthy air days now
- 1 days/yr
- Unhealthy air days in 30 yrs
- 1 days/yr
Risk factors via First Street. Map © Google.
Why this score? — see what drove the D- grade
The composite is a weighted blend of 9 inputs, each scored 0–100. Each bar is that input's sub-score; the figure is the points it added to the 100-point composite (weight × sub-score).
- ARV discount +15.0/15.0
- Appreciation +4.8/10.0
- Cash flow +4.4/30.0
- Livability +4.1/5.0
- Schools +3.4/10.0
- Rent growth +3.1/5.0
- Condition / age +2.5/5.0
- 1% rule +2.3/10.0
- DSCR +0.0/10.0
$420,000
🖨 Deal sheet (PDF) 📄 Offer letter ✓ Due diligence
Listing remarks MLS
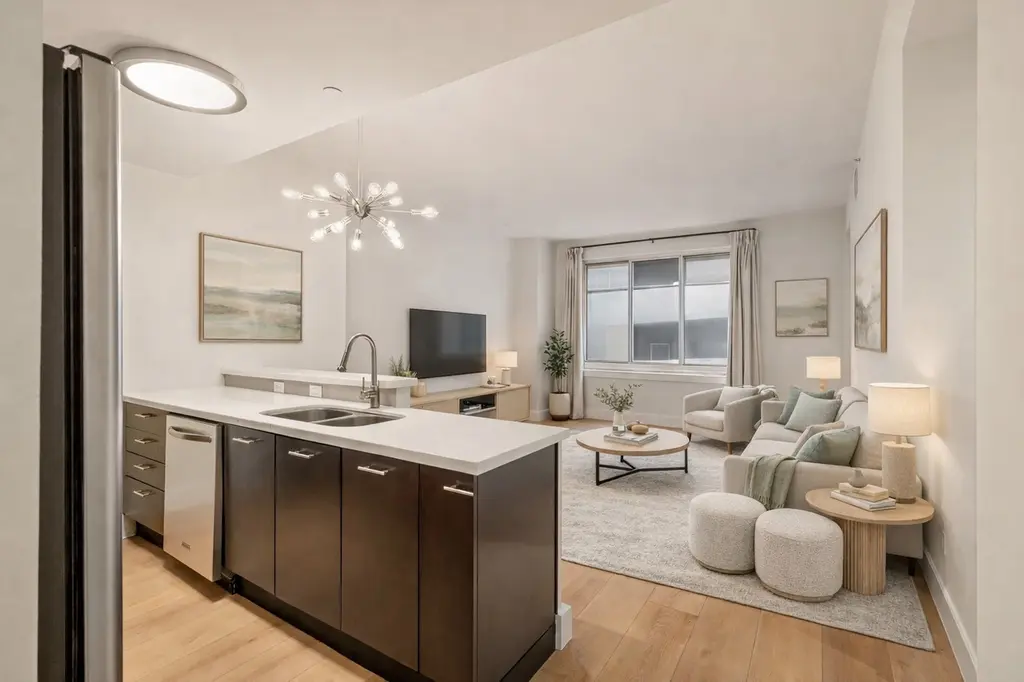
Live in the center of the Rainey Street District at The Shore—an iconic, established downtown building known for livable floorplans and a polished ownership experience. Residence #907 offers an open layout plus a rare bonus room you can style as a home office, gym/yoga studio, media space, or an oversized walk-in closet. Recent improvements include new wood floors, fresh paint throughout, and blackout linen curtains with a French return in both the living room and bedroom for true, edge-to-edge light control. The kitchen features stainless steel appliances and quartz countertops, flowing seamlessly into the main living space. This east-facing home enjoys an added layer of separation thanks to a nearby sound-barrier building, creating a more peaceful interior vibe while keeping you steps from Austin’s best dining, nightlife, and the lakefront trail. Building perks include concierge service, pool and fitness center, and direct access to Austin’s iconic Hike-and-Bike Trail. From the pool level, enjoy convenient access to the adjacent Hotel Van Zandt for a hotel-adjacent lifestyle next door. Reserved parking: P3 #173. A major plus: as one of Rainey’s original luxury condo buildings, The Shore delivers a proven HOA and professional, full-service management that owners appreciate. 1 bed | 1 bath | bonus room | 879 SF | built 2006 | AISD Per seller/building, the building maintained power during the 2021 winter storm; buyer to verify.
Key facts
- Quartz countertops
- New wood floors
- Bonus room
Tags
Neighborhood map
What this means for you Summary
Snapshot
- This is a 1-bed/1.0-bath condo listed at $420k.
Deal economics
- At list price, monthly cash flow is $-1k ($-14k/yr) — negative.
- To cash-flow at today's rent, offer at most $213k (49.2% below list).
- To meet the 1% rule (rent ≥ 1% of price), the offer needs to be $308k (26.7% below list).
- Recommended offer: $213k (49.2% below list) — sets the bar for cash-flow.
- Cap rate 3.1% vs local median 1.8% in Austin — top-decile yield for the area; either an underpriced asset or a hidden risk that comps aren't pricing in. Stress-test before assuming the spread holds.
Location & tenants
- Location reads 82/100 on livability (#16 in TX, #1,208 nationally) — a professional / high-income tenant draw. Strengths: amenities A+, commute A+, employment A+; Watch: cost of living D, crime F.
- Austin ISD (urban): math 33% / reading 44% proficiency, ranked #431 of 826 in TX (top 52%) — families likely to look elsewhere, expect single-tenant / working-renter base with shorter leases.
- Market conditions: Rents rising (+2.5%/yr); 301 active listings in the ZIP; 40 comparable units currently listed for rent nearby; rentals lingering (median 45d on market — plan ~5-8 weeks vacancy on turnover, expect pricing pressure); 52% of comp listings sitting > 30 days — soft ceiling on asking rent; high-income renter base; 17,121 units permitted in Travis County in 2024 (11,963 in 5+ unit buildings).
Forward outlook
- In year one you build about $986 of equity ($3k loan paydown + $-2k appreciation (-0.5% local appreciation)).
- Travis County population projected at +60% by 2050 — long-run rental-demand tailwind backs the buy-and-hold thesis.
Negotiation context
- It's been on market 155 days — a 12% lower offer ($370k) is reasonable based on typical stale-listing flexibility.
- 10 sale attempts since 17y ago; this cycle's ask is 18991% above the opening price — seller raised mid-cycle; expect resistance to lowballs.
Risks & watch-outs
- Watch-outs: flood insurance adds $66/mo.
- Climate carrying-cost: major flood risk; severe wind risk, 80% chance of damaging wind over 30y; extreme-heat days projected 6→19/yr by 2055 (HVAC capex compounding) — expect insurance premiums to compound above CPI over the hold.
Questions for the listing agent
- What do current leases actually rent for vs. the listed asking? Can we see a recent rent roll and the last 12 months of T-12 income?
- It's been on market 155 days. Have you received any prior offers? Is the seller open to a 49% concession, seller financing, or rate buy-down credit?
- What's the actual annual flood-insurance premium (NFIP or private), and is the property in a SFHA with mandatory coverage?
- What does the HOA fee cover, when was the last increase, and are there any pending special assessments or reserve-fund shortfalls?
- Any open or pending special assessments — roof, HVAC, plumbing, elevator, façade? What's the per-unit balance and payoff schedule, and is the seller paying it off at close or rolling it to the buyer?
- Why hasn't it sold? Are there any deal-killer items the seller is aware of (foundation, flood, title, zoning, code violations)?
- Is there a deadline driving the sale (1031 exchange, divorce, estate, relocation)? That informs how much negotiation room exists.
- Crime grade is F in this area — have there been break-ins, vandalism, or insurance claims at this property in the last 3 years? What carrier currently insures it and at what premium?
- The area grade is low — what's the realistic commute time and amenity access for the typical tenant pool here? Any planned neighborhood developments (good or bad) we should know about?
- This sits on a lake — are riparian / water-frontage rights deeded with the parcel? Any dock permits, shoreline easements, or HOA water-use restrictions?
- What's the documented flood / surge / shoreline-erosion history here (FEMA AND non-FEMA — e.g., storm surge, creek backup, septic-field saturation)?
- Any water-quality or seasonal algae-bloom issues that affect tenant satisfaction or short-term-rental demand?
- What's the average days-on-market for RENTAL listings here right now (not sales)? A rising rental-DOM trend means longer vacancies and softer asking-rent achievability than the comps imply.
- What's the recent tenant-quality profile in this submarket — average credit score on applications, eviction rate, late-payment / NSF rate, and stable-employment percentage? A property-management company in the area should have these aggregated.
- How much new apartment / multifamily construction is in the pipeline within 1–3 miles? Heavy new supply (>2% of stock underway) typically softens rents 12–24 months out; light construction supports rent growth.
Investment metrics
- 1% rule
- 0.73% ✗
- Cap rate
- 3.14%
- Cash-on-cash
- -11.25%
- DSCR
- 0.50
- GRM
- 11.4
CMA / ARV
- ARV (median comp)
- $513,771
- List price
- $420,000
- Delta
- -18.25%
- Verdict
- UNDERPRICED
- Comps
- 20 within 1.0 mi
Projected returns pro-forma
-0.46% appreciation · 2.54% rent growth · sell at horizon
- IRR
- -18.6%
- Equity multiple
- 0.18×
- Total profit
- $-96,635
- Equity at exit
- $112,454
- IRR
- -12.3%
- Equity multiple
- -0.18×
- Total profit
- $-138,663
- Equity at exit
- $127,808
Cash invested: $117,600 (down + closing). Projections, not guarantees.
Landlord ↔ Tenant lean methodology
- Overall (STATE)
- 87 Strongly Landlord-Friendly
- State Texas
- 87 Strongly Landlord-Friendly · R+5
- County
- — inherits STATE
- City
- — inherits STATE
ZIP-level market 78701
- Home prices YoY
- -0.2%
- Rents YoY
- 2.5%
- Active inventory
- 301
- Price-to-rent
- 11.4×
Monthly cashflow live
- Estimated rent
- $3,078 high interval (Pro) →
- Mortgage (P&I)
- −$2,203
- Tax from tax record
- −$699 /mo · $8,389/yr
- Insurance
- −$175
- Flood insurance flood zone
- −$66 /mo · $798/yr
- HOA
- −$458
- Vacancy / Maint / Mgmt
- −$646
- Net cashflow
- $-1,169
Break-even live
Sensitivity live
| Price | -10% $-932 | -5% $-1,050 | +0% $-1,169 | +5% $-1,288 | +10% $-1,407 |
|---|---|---|---|---|---|
| Rent | -10% $-1,412 | -5% $-1,291 | +0% $-1,169 | +5% $-1,048 | +10% $-926 |
| Rate | -1.0pp $-958 | -0.5pp $-1,063 | base $-1,169 | +0.5pp $-1,278 | +1.0pp $-1,389 |
UW: 25.0% down · 7.5% · 30yr · 1.5% tax · 5.0% vac · 8.0% maint · 8.0% mgmt
Financing live
Cash to close
- Down payment
- $105,000
- Closing costs
- $12,600
- Reserves months
- —
- Total cash needed
- —
Loan-product check · same deal, 3 products live
Conventional
25% down · 7.5% · 30yr
- Down + closing
- —
- Monthly P&I
- —
- Monthly cashflow
- —
- DSCR
- —
- Eligible?
- —
Personal DTI + credit; lowest rate.
DSCR
20% down · 8.5% · 30yr
- Down + closing
- —
- Monthly P&I
- —
- Monthly cashflow
- —
- DSCR
- —
- Eligible?
- —
No personal income docs; deal must DSCR.
Hard money
10% down · 12.0% · 12mo
- Down + closing
- —
- Monthly P&I
- —
- Monthly cashflow
- —
- DSCR
- —
- Eligible?
- —
Short-term bridge; refi at stabilization.
Rent comps 40 comps
| Address | Beds | Baths | Sqft | Rent | $/sqft | DOM | Units | Dist |
|---|---|---|---|---|---|---|---|---|
| 80 Rainey St Austin, TX | 3.0 | 1.0–3.5 | 1205 | $17,048 | $14.15 | 0d | 106 | 0.02mi |
| 70 Rainey St Unit 2C-7 Austin, TX | 1.0 | 1.0 | 902 | $2,224 | $2.47 | 45d | 1 | 0.02mi |
| 603 Davis St Unit 725 Austin, TX | 1.0 | 1.0 | 836 | $1,800 | $2.15 | 45d | 1 | 0.04mi |
| 79 Rainey St Austin, TX | 1.0 | 1.0 | 1049 | $5,025 | $4.79 | 45d | 1 | 0.04mi |
| 70 Rainey St Unit 1135 Austin, TX | 1.0 | 1.0 | 924 | $2,450 | $2.65 | 45d | 1 | 0.04mi |
| 700 River St Austin, TX | 1.0–3.0 | 1.0–3.5 | 1708 | $3,504 | $2.05 | 0d | 69 | 0.07mi |
| 84 N Interstate 35 Austin, TX | 1.0 | 2.0 | 1058 | $3,625 | $3.43 | 45d | 1 | 0.10mi |
| 84 N Interstate 35 #2708 Austin, TX | 1.0 | 1.0 | 667 | $2,900 | $4.35 | 45d | 1 | 0.10mi |
| 84 N Interstate 35 #3707 Austin, TX | 1.0 | 1.0 | 727 | $2,950 | $4.06 | 6d | 1 | 0.10mi |
| 84 N Interstate 35 #2302 Austin, TX | 1.0 | 1.0 | 697 | $3,035 | $4.35 | 16d | 1 | 0.10mi |
| 84 N Interstate 35 #2807 Austin, TX | 1.0 | 1.0 | 697 | $2,550 | $3.66 | 45d | 1 | 0.10mi |
| 84 N Interstate 35 #2102 Austin, TX | 1.0 | 1.0 | 697 | $2,700 | $3.87 | 21d | 1 | 0.10mi |
| 84 N Interstate 35 #1510 Austin, TX | 1.0 | 2.0 | 1058 | $4,035 | $3.81 | 16d | 1 | 0.10mi |
| 84 N Interstate 35 #2203 Austin, TX | 2.0 | 2.0 | 969 | $3,990 | $4.12 | 16d | 1 | 0.10mi |
| 84 N Interstate 35 #2003 Austin, TX | 2.0 | 2.0 | 969 | $3,450 | $3.56 | 45d | 1 | 0.10mi |
| 84 N Interstate 35 #2903 Austin, TX | 2.0 | 2.0 | 969 | $3,500 | $3.61 | 45d | 1 | 0.10mi |
| 84 N Interstate 35 #2508 Austin, TX | 1.0 | 1.0 | 667 | $2,525 | $3.79 | 45d | 1 | 0.10mi |
| 84 N Interstate 35 #1803 Austin, TX | 2.0 | 2.0 | 969 | $3,400 | $3.51 | 25d | 1 | 0.10mi |
| 610 Davis St Unit 2204 Austin, TX | 2.0 | 2.0 | 978 | $4,200 | $4.29 | 45d | 1 | 0.10mi |
| 610 Davis St Unit 5206 Austin, TX | 1.0 | 1.0 | 662 | $3,500 | $5.29 | 46d | 1 | 0.10mi |
| 610 Davis St Unit 2304 Austin, TX | 2.0 | 2.0 | 978 | $4,500 | $4.60 | 19d | 1 | 0.10mi |
| 610 Davis St Unit 1809 Austin, TX | 1.0 | 1.0 | 660 | $2,750 | $4.17 | 25d | 1 | 0.10mi |
| 610 Davis St Unit 3004 Austin, TX | 2.0 | 2.0 | 978 | $5,750 | $5.88 | 45d | 1 | 0.10mi |
| 610 Davis St Unit 2909 Austin, TX | 1.0 | 1.0 | 662 | $3,100 | $4.68 | 45d | 1 | 0.10mi |
| 610 Davis St Unit 2503 Austin, TX | 2.0 | 2.0 | 978 | $4,500 | $4.60 | 16d | 1 | 0.10mi |
| 610 Davis St #2003 Austin, TX | 2.0 | 2.0 | 978 | $4,300 | $4.40 | 45d | 1 | 0.10mi |
| 610 Davis St Austin, TX | 1.0 | 1.0 | 613 | $3,000 | $4.89 | 45d | 1 | 0.10mi |
| 59 Rainey St Austin, TX | 2.0 | 2.0 | 1029 | $3,345 | $3.25 | 45d | 1 | 0.10mi |
| 91 Red River St Austin, TX | 3.0 | 1.0–2.0 | 1317 | $3,550 | $2.69 | 0d | 17 | 0.10mi |
| 91 Red River St Unit 106 Austin, TX | 1.0 | 1.0 | 749 | $2,524 | $3.37 | 45d | 1 | 0.12mi |
| 55 Rainey St Unit 716 Austin, TX | 2.0 | 2.0 | 1079 | $3,290 | $3.05 | 19d | 1 | 0.13mi |
| 55 Rainey St Unit 703 Austin, TX | 1.0 | 1.0 | 679 | $2,490 | $3.67 | 45d | 1 | 0.13mi |
| 51 Rainey St Austin, TX | 1.0 | 1.0 | 729 | $2,845 | $3.90 | 45d | 1 | 0.13mi |
| 51 Rainey St Unit 93 Austin, TX | 1.0 | 1.0 | 618 | $2,214 | $3.58 | 0d | 1 | 0.14mi |
| 51 Rainey St Unit 66 Austin, TX | 1.0 | 1.0 | 679 | $2,435 | $3.59 | 16d | 1 | 0.14mi |
| 51 Rainey St Unit 66 Austin, TX | 1.0 | 1.0 | 655 | $2,099 | $3.20 | 0d | 1 | 0.14mi |
| 51 Rainey St Unit 74 Austin, TX | 2.0 | 2.0 | 1079 | $2,854 | $2.65 | 0d | 1 | 0.14mi |
| 99 Rainey St Austin, TX | 1.0 | 1.0 | 799 | $2,009 | $2.51 | 45d | 1 | 0.14mi |
| 91 Rainey St Austin, TX | 1.0–2.0 | 1.0–2.0 | 1033 | $2,089 | $2.02 | 0d | 6 | 0.14mi |
| 51 Rainey St Austin, TX | 1.0 | 1.0 | 692 | $2,472 | $3.57 | 14d | 2 | 0.14mi |
HOA detail condo
- Monthly dues
- $458 · $5,496/yr
- Likely covers
- poolgymdoorman
- Assessments
- None detected in remarks — confirm with the listing agent.
Listing history 38 events
-
2026-06-21days on market $420,000 Active 155 DOM
-
2026-06-18days on market $420,000 Active 152 DOM
-
2026-06-17days on market $420,000 Active 151 DOM
-
2026-06-16days on market $420,000 Active 150 DOM
-
2026-06-15days on market $420,000 Active 149 DOM
-
2026-06-13days on market $420,000 Active 147 DOM
-
2026-06-09days on market $420,000 Active 143 DOM
-
2026-06-08days on market $420,000 Active 142 DOM
-
2026-06-07days on market $420,000 Active 141 DOM
-
2026-06-05days on market $420,000 Active 138 DOM
-
2026-06-03days on market $420,000 Active 137 DOM
-
2026-06-02days on market $420,000 Active 136 DOM
-
2026-06-01days on market $420,000 Active 135 DOM
-
2026-05-31days on market $420,000 Active 134 DOM
-
2026-04-29price $420,000 1475-char remark
Show marketing remark (1475 chars)
Live in the center of the Rainey Street District at The Shore—an iconic, established downtown building known for livable floorplans and a polished ownership experience. Residence #907 offers an open layout plus a rare bonus room you can style as a home office, gym/yoga studio, media space, or an oversized walk-in closet. Recent improvements include new wood floors, fresh paint throughout, and blackout linen curtains with a French return in both the living room and bedroom for true, edge-to-edge light control. The kitchen features stainless steel appliances and quartz countertops, flowing seamlessly into the main living space. This east-facing home enjoys an added layer of separation thanks to a nearby sound-barrier building, creating a more peaceful interior vibe while keeping you steps from Austin’s best dining, nightlife, and the lakefront trail. Building perks include concierge service, pool and fitness center, and direct access to Austin’s iconic Hike-and-Bike Trail. From the pool level, enjoy convenient access to the adjacent Hotel Van Zandt for a hotel-adjacent lifestyle next door. Reserved parking: P3 #173. A major plus: as one of Rainey’s original luxury condo buildings, The Shore delivers a proven HOA and professional, full-service management that owners appreciate. 1 bed | 1 bath | bonus room | 879 SF | built 2006 | AISD Per seller/building, the building maintained power during the 2021 winter storm; buyer to verify.
-
2026-04-27historical $2,200
-
2026-04-25status Active 1475-char remark
Show marketing remark (1475 chars)
Live in the center of the Rainey Street District at The Shore—an iconic, established downtown building known for livable floorplans and a polished ownership experience. Residence #907 offers an open layout plus a rare bonus room you can style as a home office, gym/yoga studio, media space, or an oversized walk-in closet. Recent improvements include new wood floors, fresh paint throughout, and blackout linen curtains with a French return in both the living room and bedroom for true, edge-to-edge light control. The kitchen features stainless steel appliances and quartz countertops, flowing seamlessly into the main living space. This east-facing home enjoys an added layer of separation thanks to a nearby sound-barrier building, creating a more peaceful interior vibe while keeping you steps from Austin’s best dining, nightlife, and the lakefront trail. Building perks include concierge service, pool and fitness center, and direct access to Austin’s iconic Hike-and-Bike Trail. From the pool level, enjoy convenient access to the adjacent Hotel Van Zandt for a hotel-adjacent lifestyle next door. Reserved parking: P3 #173. A major plus: as one of Rainey’s original luxury condo buildings, The Shore delivers a proven HOA and professional, full-service management that owners appreciate. 1 bed | 1 bath | bonus room | 879 SF | built 2006 | AISD Per seller/building, the building maintained power during the 2021 winter storm; buyer to verify.
-
2026-03-31$2,200
-
2025-12-22$490,000 Active 1475-char remark
Show marketing remark (1475 chars)
Live in the center of the Rainey Street District at The Shore—an iconic, established downtown building known for livable floorplans and a polished ownership experience. Residence #907 offers an open layout plus a rare bonus room you can style as a home office, gym/yoga studio, media space, or an oversized walk-in closet. Recent improvements include new wood floors, fresh paint throughout, and blackout linen curtains with a French return in both the living room and bedroom for true, edge-to-edge light control. The kitchen features stainless steel appliances and quartz countertops, flowing seamlessly into the main living space. This east-facing home enjoys an added layer of separation thanks to a nearby sound-barrier building, creating a more peaceful interior vibe while keeping you steps from Austin’s best dining, nightlife, and the lakefront trail. Building perks include concierge service, pool and fitness center, and direct access to Austin’s iconic Hike-and-Bike Trail. From the pool level, enjoy convenient access to the adjacent Hotel Van Zandt for a hotel-adjacent lifestyle next door. Reserved parking: P3 #173. A major plus: as one of Rainey’s original luxury condo buildings, The Shore delivers a proven HOA and professional, full-service management that owners appreciate. 1 bed | 1 bath | bonus room | 879 SF | built 2006 | AISD Per seller/building, the building maintained power during the 2021 winter storm; buyer to verify.
-
2025-04-24Active
-
2022-08-12status Active
-
2022-08-11status Pending
-
2022-06-17price
-
2022-05-13Active
-
2021-07-19soldstatus Closed
-
2021-07-19soldstatus
-
2021-06-22historical Active Under Contract
-
2021-06-18$445,000 Active
-
2015-12-11soldstatus Sold
-
2015-12-11soldstatus
-
2015-11-06status Pending - Taking Backups
-
2015-10-24price $355,000
-
2015-10-21status Active
-
2015-10-20status Pending - Taking Backups
-
2015-09-18$360,000 Active
-
2009-06-22historical
-
2009-06-22soldstatus
-
2009-03-28$234,000
ⓘ Source: listings_history table (triggers on properties + properties_extension) + one-shot
backfill from property_details.listing_events for pre-trigger history.
Tax reassessment forecast TX · Resets to sale price
- Current annual tax
- $8,389 · $699/mo
- Projected year-2 tax
- $8,389 · $699/mo
- Expected delta
- $0/yr ($0/mo · 0.0%)
ⓘ Screening estimate from a state-policy table — verify with the county assessor before closing.
Climate risk First Street
- Flood 7/10 Severe FEMA zone X (shaded) · 78% chance over 30 yrs
- Wildfire 1/10 Low
- Heat 8/10 Severe 6 d/yr ≥108°F today · 19 d/yr by 30 yrs out
- Wind 8/10 Severe 80% chance of damaging wind over 30 yrs
- Air quality 2/10 Low 1 unhealthy d/yr today · 1 by 30 yrs out
Nearby sold comps map
Loading sold comps map…
Walkable amenities ~0.75 mi
Loading nearby amenities…
Taxation est. · year 1
- Rental income
- $36,938
- − Mortgage interest
- −$23,527
- − Property taxes
- −$8,389
- − Insurance
- −$2,898
- − Repairs & maintenance
- −$2,955
- − Management
- −$2,955
- − HOA
- −$5,496
- − Depreciation
- −$12,218
- Taxable loss
- −$21,499
- Est. tax savings @ 24.0%
- +$5,160
- After-tax cash flow
- $-8,872/yr
For passive investors: Depreciation is non-cash, so a rental often shows a tax loss while cash-flowing — sheltering income. Rental losses are passive: they offset passive income freely, and up to $25,000/yr can offset ordinary (W-2) income if you actively participate and your MAGI is under $100k (phasing out to $0 by $150k); unused losses carry forward. On sale, claimed depreciation is recaptured at up to 25%, and gains may owe capital-gains tax (a 1031 exchange can defer both). Figures are a year-1 estimate at your 24.0% rate — not tax advice; consult a CPA.
Schools (NCES district)
- District
- Austin ISD
- NCES district ID
- 4808940
- Math proficiency
- 33% ▼ -19.00%
- Reading proficiency
- 44% ▼ -7.00%
- Median HH income
- $54,627
- Composite
- 33.65/100
- National rank
- #5397
- State rank
- #431 of 826 in TX
Livability — Austin
- Score
- 82/100
- State rank
- #16
- US rank
- #1208
Category grades
Schools grade is shown separately in the Schools card above.
Census & demographics
- Census place
- Austin, TX
- County
- Travis County · 1,299,254 people
- City population
- 1,066,854
- Metro
- Austin-Round Rock-Georgetown, TX
- Population (ZIP)
- 11,824
- Household income
- $162,168
- Rent vs Own
- Severe rent burden
- 678.0
Population outlook (Travis County) Hauer SSP2
- Today (2025)
- 1,545,133 people
- By 2030
- 1,729,269 · +11.9%
- By 2040
- 2,097,596 · +35.8%
- By 2050
- 2,463,890 · +59.5%
- By 2075
- 3,249,374 · +110.3%
- By 2100
- 3,801,868 · +146.1%
Race, ethnicity, and origin ACS 2023
- Neighborhood character
- Predominantly White (68%)
- Race & ethnicity
- White 68% Hispanic / Latino 17% Two or more races 12% Asian 6% Black 3%
- Hispanic origin (detail)
- Mexican 10%
- Common ancestry
- Lithuanian 4% Romanian 4% Slovak 3%
- Foreign-born
- 13% · Canada, China, Dominican Republic
- Languages at home
- 83% English-only · Spanish 10% Other Indo-European 3% Chinese 1%
Political lean MEDSL · Travis
- 2024 margin
- Solid D (+39.3) · D 68.8% · R 29.4% · Other 1.8%
- 2008→2024 swing
- +9.9pp toward D · 2008: 29.4pp · 2024: 39.3pp
- All cycles
- 2024: D+39.3 2020: D+45.0 2016: D+38.9 2012: D+23.9 2008: D+29.4
Not yet ingested
- Civics
- —
Market trends
- HPI YoY
- ▼ -0.46%
- Current HPI
- 183.8877
- Rent YoY
- ▲ 2.54%
- Metro
- Austin-Round Rock-Georgetown, TX
- State GDP YoY
- ▲ 3.95%
- F500 in state
- 110
Industry mix (Fortune 500 HQ in TX)
| Industry | F500 HQs | Revenue |
|---|---|---|
| Energy | 16 | $1,198B |
|
||
| Technology | 5 | $198B |
|
||
| Engineering / Construction | 4 | $72B |
|
||
| Energy Services | 3 | $60B |
|
||
| Utilities | 3 | $41B |
|
||
| Healthcare | 2 | $330B |
|
||
Price history
+79.5% since first listed24 events — show timeline
- 2026-04-29 Price Changed $420,000 Unlock MLS
- 2026-04-27 Rental Removed $2,200 ACTRIS
- 2026-04-25 Relisted — Unlock MLS
- 2026-03-31 Listed for Rent $2,200 ACTRIS
- 2025-12-22 Listed $490,000 Unlock MLS
- 2025-04-24 Listed — Unlock MLS
- 2022-08-12 Relisted — Unlock MLS
- 2022-08-11 Pending — Unlock MLS
- 2022-06-17 Price Changed — Unlock MLS
- 2022-05-13 Listed — Unlock MLS
- 2021-07-19 Sold (Public Records) — Public Records
- 2021-07-19 Sold (MLS) — Unlock MLS
- 2021-06-22 Contingent — Unlock MLS
- 2021-06-18 Listed $445,000 Unlock MLS
- 2015-12-11 Sold (Public Records) — Public Records
- 2015-12-11 Sold (MLS) — Unlock MLS
- 2015-11-06 Pending — Unlock MLS
- 2015-10-24 Price Changed $355,000 Unlock MLS
- 2015-10-21 Relisted — Unlock MLS
- 2015-10-20 Pending — Unlock MLS
- 2015-09-18 Listed $360,000 Unlock MLS
- 2009-06-22 Sold (MLS) — Unlock MLS
- 2009-06-22 Delisted — Unlock MLS
- 2009-03-28 Listed $234,000 Unlock MLS
Property tax history
+3.1%/yrLatest (2026): $8,389 · -9.5% YoY. Source: county tax records.
Cash-flow waterfall
monthlySold comps — $/sqft
last 12 mo · ≤1 miLoading sold comps…