8235 Lobster Bay Ct · Jacksonville, FL
Flood risk 1/10 · Minimal
- FEMA flood zone
- X (unshaded)
- Chance of flooding over 30 yrs
- 0.0%
- Est. flood insurance / yr
- $507 – $1,088
Fire risk 2/10 · Minimal
- Est. fire insurance / yr
- $947 – $1,759
Heat risk 9/10 · Severe
- Hot days now (above 107°F)
- 7 days/yr
- Hot days in 30 yrs
- 21 days/yr
Wind risk 9/10 · Severe
- Chance of severe wind over 30 yrs
- 99.0%
Air-quality risk 4/10 · Minor
- Unhealthy air days now
- 4 days/yr
- Unhealthy air days in 30 yrs
- 6 days/yr
Risk factors via First Street. Map © Google.
Why this score? — see what drove the C grade
The composite is a weighted blend of 9 inputs, each scored 0–100. Each bar is that input's sub-score; the figure is the points it added to the 100-point composite (weight × sub-score).
- Cash flow +21.3/30.0
- ARV discount +7.5/15.0
- DSCR +6.8/10.0
- 1% rule +5.6/10.0
- Appreciation +4.2/10.0
- Livability +4.2/5.0
- Schools +3.9/10.0
- Condition / age +3.8/5.0
- Rent growth +2.6/5.0
$149,000
🖨 Deal sheet (PDF) 📄 Offer letter ✓ Due diligence
Listing remarks
NO CARPET !! Completed updated unit with CUSTOM BATH , Glass Doors , Exotic Countertops Kitchen and Baths. Best option fully upgrades at the lowest pricing ! Hurry up ! It will sell fast !!!
Key facts
- Exotic countertops
- Custom bath
- Built 2007
Tags
Neighborhood map
What this means for you Summary
Snapshot
- This is a 2-bed/2.0-bath other listed at $149k. Condition is rated good.
Deal economics
- At list price, monthly cash flow is $217 ($3k/yr) — positive.
- The deal already cash-flows at list — no discount required.
- Meets the 1% rule at list price ($2k rent vs $149k).
- Recommended offer: $147k (1.5% below list) — sets the bar for market timing.
- Cap rate 8.0% vs local median 3.9% in Jacksonville — top-decile yield for the area; either an underpriced asset or a hidden risk that comps aren't pricing in. Stress-test before assuming the spread holds.
Location & tenants
- Location reads 83/100 on livability (#50 in FL, #911 nationally) — a professional / high-income tenant draw. Strengths: amenities A+, commute A+, housing A+.
- Duval (urban): math 46% / reading 45% proficiency, ranked #48 of 73 in FL (top 66%) — families likely to look elsewhere, expect single-tenant / working-renter base with shorter leases.
- Zoned schools: Greenfield Elementary School (math 51% / reading 44%, grade D, #1,182 of 2,144 statewide, top 55%, 592 students, 56% FRL); Southside Middle School (math 24% / reading 22%, grade F, #542 of 571 statewide, top 95%, 844 students, 57% FRL); Englewood High School (math 21% / reading 21%, grade F, #551 of 667 statewide, top 83%, 1,741 students, 58% FRL).
- Zoned-school proficiency averages 30% at this address vs 46% district-wide (-15 pts) — the specific schools serving this property underperform the Duval average; the district grade overstates school quality for this exact location.
- Market conditions: Rents flat; 520 active listings in the ZIP; 40 comparable units currently listed for rent nearby; rentals leasing fast (median 9d on market — plan ~1-2 weeks tenant-placement turnaround); 6,503 units permitted in Duval County in 2024 (1,131 in 5+ unit buildings).
Forward outlook
- Local home prices are declining (-1.6%/yr); year-one equity from $1k of loan paydown is wiped out by about $2k of value loss. Plan a longer hold.
- Duval County population projected at +19% by 2050 — long-run rental-demand tailwind backs the buy-and-hold thesis.
Negotiation context
- It's been on market 20 days — a 2% lower offer ($147k) is reasonable based on typical stale-listing flexibility.
- 4 sale attempts since 2y ago with the ask held roughly flat each time — persistent listings suggest the price (not the market) is what's stuck; bring a comps-based counter.
Risks & watch-outs
- Climate carrying-cost: severe wind risk, 99% chance of damaging wind over 30y; extreme-heat days projected 7→21/yr by 2055 (HVAC capex compounding) — expect insurance premiums to compound above CPI over the hold.
Questions for the listing agent
- Is there a deadline driving the sale (1031 exchange, divorce, estate, relocation)? That informs how much negotiation room exists.
- Schools are B-rated — typically a magnet for longer-tenancy family renters. What's the average tenant stay here, and is there a school-zone premium baked into asking?
- What's the average days-on-market for RENTAL listings here right now (not sales)? A rising rental-DOM trend means longer vacancies and softer asking-rent achievability than the comps imply.
- What's the recent tenant-quality profile in this submarket — average credit score on applications, eviction rate, late-payment / NSF rate, and stable-employment percentage? A property-management company in the area should have these aggregated.
- How much new for-sale + rental construction is in the pipeline within 1–3 miles? Heavy new supply typically softens prices + rents 12–24 months out; constrained supply supports both.
Investment metrics
- 1% rule
- 1.06% ✓
- Cap rate
- 8.04%
- Cash-on-cash
- 6.24%
- DSCR
- 1.28
- GRM
- 7.9
CMA / ARV
No comps found within radius.
Projected returns pro-forma
-1.58% appreciation · 0.39% rent growth · sell at horizon
- IRR
- -3.1%
- Equity multiple
- 0.87×
- Total profit
- $-5,255
- Equity at exit
- $31,876
- IRR
- 1.8%
- Equity multiple
- 1.14×
- Total profit
- $5,869
- Equity at exit
- $30,100
Cash invested: $41,720 (down + closing). Projections, not guarantees.
Landlord ↔ Tenant lean methodology
- Overall (STATE)
- 87 Strongly Landlord-Friendly
- State Florida
- 87 Strongly Landlord-Friendly · R+3
- County
- — inherits STATE
- City
- — inherits STATE
ZIP-level market 32256
- Home prices YoY
- -0.7%
- Rents YoY
- 0.4%
- Active inventory
- 520
- Price-to-rent
- 7.9×
Monthly cashflow live
- Estimated rent
- $1,578 high interval (Pro) →
- Mortgage (P&I)
- −$781
- Tax est. 1.5%
- −$186 /mo · $2,235/yr
- Insurance
- −$62
- HOA
- −$0
- Vacancy / Maint / Mgmt
- −$331
- Net cashflow
- $217
Break-even live
Sensitivity live
| Price | -10% $320 | -5% $269 | +0% $217 | +5% $166 | +10% $114 |
|---|---|---|---|---|---|
| Rent | -10% $92 | -5% $155 | +0% $217 | +5% $279 | +10% $342 |
| Rate | -1.0pp $292 | -0.5pp $255 | base $217 | +0.5pp $178 | +1.0pp $139 |
UW: 25.0% down · 7.5% · 30yr · 1.5% tax · 5.0% vac · 8.0% maint · 8.0% mgmt
Financing live
Cash to close
- Down payment
- $37,250
- Closing costs
- $4,470
- Reserves months
- —
- Total cash needed
- —
Loan-product check · same deal, 3 products live
Conventional
25% down · 7.5% · 30yr
- Down + closing
- —
- Monthly P&I
- —
- Monthly cashflow
- —
- DSCR
- —
- Eligible?
- —
Personal DTI + credit; lowest rate.
DSCR
20% down · 8.5% · 30yr
- Down + closing
- —
- Monthly P&I
- —
- Monthly cashflow
- —
- DSCR
- —
- Eligible?
- —
No personal income docs; deal must DSCR.
Hard money
10% down · 12.0% · 12mo
- Down + closing
- —
- Monthly P&I
- —
- Monthly cashflow
- —
- DSCR
- —
- Eligible?
- —
Short-term bridge; refi at stabilization.
Rent comps 40 comps
| Address | Beds | Baths | Sqft | Rent | $/sqft | DOM | Units | Dist |
|---|---|---|---|---|---|---|---|---|
| 5006 Key Lime Dr Jacksonville, FL | 2.0 | 2.0 | 1068 | $1,335 | $1.25 | 23d | 2 | 0.07mi |
| 5006 Key Lime Dr Jacksonville, FL | 2.0 | 2.0 | 1068 | $1,335 | $1.25 | 22d | 2 | 0.07mi |
| 8215 Green Parrot Rd #103 Jacksonville, FL | 2.0 | 2.0 | 978 | $1,429 | $1.46 | 13d | 1 | 0.12mi |
| 4974 Key Lime Dr Jacksonville, FL | 2.0 | 2.0 | 927 | $1,650 | $1.78 | 25d | 1 | 0.15mi |
| 8649 A C Skinner Pkwy Jacksonville, FL | 1.0–3.0 | 1.0–2.0 | 1093 | $1,710 | $1.56 | 3d | 21 | 0.17mi |
| 4931 Key Lime Dr #205 Jacksonville, FL | 2.0 | 2.0 | 927 | $1,350 | $1.46 | 23d | 1 | 0.18mi |
| 8681 A C Skinner Pkwy Jacksonville, FL | 1.0–3.0 | 1.0–2.0 | 1103 | $1,744 | $1.58 | 3d | 22 | 0.18mi |
| 8409 Zenith Cir Jacksonville, FL | 2.0 | 2.5 | 1110 | $1,695 | $1.53 | 25d | 1 | 0.30mi |
| 8362 Retrograde Rd Unit 1 Jacksonville, FL | 2.0 | 2.5 | 1009 | $1,650 | $1.64 | 18d | 1 | 0.36mi |
| 8362 Retrograde Rd Jacksonville, FL | 2.0 | 3.0 | 1009 | $1,650 | $1.64 | 5d | 1 | 0.36mi |
| 8330 Zenith Cir Unit 1 Jacksonville, FL | 2.0 | 2.5 | 1109 | $1,650 | $1.49 | 25d | 1 | 0.38mi |
| 8330 Zenith Cir Jacksonville, FL | 2.0 | 3.0 | 1109 | $1,650 | $1.49 | 25d | 1 | 0.38mi |
| 8319 Zenith Cir Jacksonville, FL | 2.0 | 2.5 | 1110 | $1,700 | $1.53 | 16d | 1 | 0.39mi |
| 8317 Asteroid St Jacksonville, FL | 2.0 | 2.5 | 1109 | $1,650 | $1.49 | 25d | 1 | 0.40mi |
| 8876 A C Skinner Pkwy Jacksonville, FL | 3.0 | 1.0–3.0 | 1050 | $2,048 | $1.95 | 4d | 35 | 0.40mi |
| 8181 A C Skinner Pkwy Jacksonville, FL | 3.0 | 1.0–3.0 | 1055 | $2,641 | $2.50 | 5d | 40 | 0.59mi |
| 7524 Southside Blvd Jacksonville, FL | 1.0–2.0 | 1.0–2.0 | 775 | $1,350 | $1.74 | 18d | 10 | 0.64mi |
| 8450 Gate Pkwy W Jacksonville, FL | 1.0–3.0 | 1.0–2.0 | 1194 | $1,676 | $1.40 | 5d | 19 | 0.71mi |
| 9734 Tapestry Park Cir Jacksonville, FL | 1.0–3.0 | 1.0–2.0 | 1094 | $1,762 | $1.61 | 3d | 41 | 0.72mi |
| 8539 Gate Pkwy W Jacksonville, FL | 1.0–3.0 | 1.0–2.0 | 995 | $1,548 | $1.56 | 15d | 6 | 0.74mi |
| 8539 Gate Pkwy W Jacksonville, FL | 1.0–3.0 | 1.0–2.0 | 995 | $1,597 | $1.61 | 19d | 7 | 0.74mi |
| 8539 Gate Pkwy W Jacksonville, FL | 1.0–3.0 | 1.0–2.0 | 995 | $1,599 | $1.61 | 16d | 5 | 0.74mi |
| 8539 Gate Pkwy W Jacksonville, FL | 1.0–3.0 | 1.0–2.0 | 995 | $1,548 | $1.56 | 6d | 4 | 0.74mi |
| 7738 A C Skinner Pkwy Jacksonville, FL | 2.0 | 1.0–2.0 | 960 | $2,187 | $2.28 | 3d | 13 | 0.77mi |
| 4870 Deer Lake Dr E Jacksonville, FL | 3.0 | 1.0–2.0 | 953 | $1,754 | $1.84 | 3d | 1 | 0.83mi |
| 7595 Baymeadows Cir W Jacksonville, FL | 1.0–3.0 | 1.0–2.0 | 1027 | $1,402 | $1.37 | 3d | 29 | 0.86mi |
| 8451 Gate Pkwy W Jacksonville, FL | 1.0–3.0 | 1.0–2.0 | 1107 | $1,802 | $1.63 | 12d | 21 | 0.90mi |
| 9803 Creekfront Rd Jacksonville, FL | 1.0–3.0 | 1.0–2.0 | 1084 | $1,534 | $1.41 | 4d | 79 | 0.91mi |
| 8290 Gate Pkwy W Jacksonville, FL | 1.0–2.0 | 1.0–2.0 | 946 | $1,450 | $1.53 | 3d | 8 | 1.02mi |
| 8290 Gate Pkwy W Jacksonville, FL | 1.0–2.0 | 1.0–2.0 | 1007 | $1,600 | $1.59 | 25d | 5 | 1.02mi |
| 7740 Southside Blvd Jacksonville, FL | 1.0–3.0 | 1.0–2.0 | 1125 | $1,541 | $1.37 | 4d | 9 | 1.07mi |
| 10010 Skinner Lake Dr Jacksonville, FL | 1.0–3.0 | 1.0–2.0 | 1001 | $1,574 | $1.57 | 3d | 14 | 1.14mi |
| 7816 Southside Blvd Jacksonville, FL | 1.0–3.0 | 1.0–2.0 | 1115 | $2,182 | $1.96 | 3d | 1 | 1.15mi |
| 10640 Satori Ln Jacksonville, FL | 1.0–2.0 | 1.0–2.0 | 933 | $1,913 | $2.05 | 6d | 24 | 1.17mi |
| 9825 Gate Pkwy N Jacksonville, FL | 1.0–3.0 | 1.0–2.0 | 1281 | $1,790 | $1.40 | 3d | 29 | 1.27mi |
| 10000 Gate Pkwy N Jacksonville, FL | 1.0–2.0 | 1.0–2.0 | 920 | $1,550 | $1.68 | 9d | 1 | 1.28mi |
| 7915 Baymeadows Cir E Jacksonville, FL | 1.0–3.0 | 1.0–2.5 | 1142 | $1,402 | $1.23 | 3d | 59 | 1.28mi |
| 7932 Southside Blvd Jacksonville, FL | 1.0–2.0 | 1.0–1.5 | 925 | $1,525 | $1.65 | 25d | 1 | 1.41mi |
| 9800 Touchton Rd Jacksonville, FL | 1.0–3.0 | 1.0–2.0 | 1160 | $1,662 | $1.43 | 25d | 1 | 1.45mi |
| 5116 Gate Pkwy Jacksonville, FL | 2.0 | 1.0–2.0 | 952 | $1,981 | $2.08 | 4d | 12 | 1.50mi |
Listing history 11 events
-
2026-06-21days on market $149,000 Active 20 DOM
-
2026-06-18days on market $149,000 Active 17 DOM
-
2026-06-17days on market $149,000 Active 16 DOM
-
2026-06-16days on market $149,000 Active 15 DOM
-
2026-06-15days on market $149,000 Active 14 DOM
-
2026-06-10days on market $149,000 Active 8 DOM
-
2026-06-08days on market $149,000 Active 7 DOM
-
2026-06-08days on market $149,000 Active 6 DOM
-
2026-06-03days on market $149,000 Active 2 DOM
-
2026-06-02remarks 190-char remark
-
2026-06-02$149,000 Active 1 DOM
ⓘ Source: listings_history table (triggers on properties + properties_extension) + one-shot
backfill from property_details.listing_events for pre-trigger history.
Climate risk First Street
- Flood 1/10 Low FEMA zone X (unshaded) · 0% chance over 30 yrs
- Wildfire 2/10 Low
- Heat 9/10 Extreme 7 d/yr ≥107°F today · 21 d/yr by 30 yrs out
- Wind 9/10 Extreme 99% chance of damaging wind over 30 yrs
- Air quality 4/10 Moderate 4 unhealthy d/yr today · 6 by 30 yrs out
Nearby sold comps map
Loading sold comps map…
Walkable amenities ~0.75 mi
Loading nearby amenities…
Taxation est. · year 1
- Rental income
- $18,938
- − Mortgage interest
- −$8,346
- − Property taxes
- −$2,235
- − Insurance
- −$745
- − Repairs & maintenance
- −$1,515
- − Management
- −$1,515
- − Depreciation
- −$4,335
- Taxable income
- $247
- Est. tax owed @ 24.0%
- −$59
- After-tax cash flow
- $2,545/yr
For passive investors: Depreciation is non-cash, so a rental often shows a tax loss while cash-flowing — sheltering income. Rental losses are passive: they offset passive income freely, and up to $25,000/yr can offset ordinary (W-2) income if you actively participate and your MAGI is under $100k (phasing out to $0 by $150k); unused losses carry forward. On sale, claimed depreciation is recaptured at up to 25%, and gains may owe capital-gains tax (a 1031 exchange can defer both). Figures are a year-1 estimate at your 24.0% rate — not tax advice; consult a CPA.
Condition & rehab AI · 1 photo
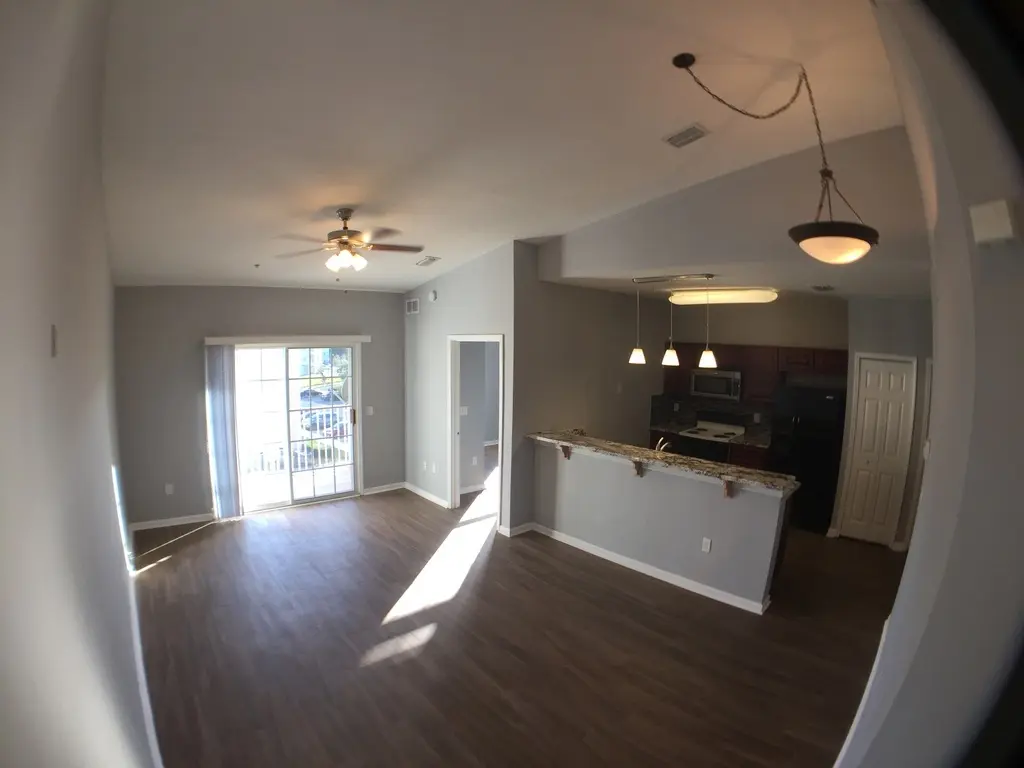
This fully updated unit with custom features and hardwood floors is in excellent condition and ready for move-in.
Value-add opportunities
- Both Painting the exterior and landscaping — Enhances curb appeal and resale value.
- Resale Upgrading the kitchen appliances — Modernizes the kitchen and attracts more buyers.
- Both Installing smart home features — Improves convenience and adds value for both buyers and renters.
Renovation cost estimate screening
Value-add ROI direction
- Both Painting the exterior and landscaping — Enhances curb appeal and resale value. ↑
- Resale Upgrading the kitchen appliances — Modernizes the kitchen and attracts more buyers. ↑
- Both Installing smart home features — Improves convenience and adds value for both buyers and renters. ↑
ⓘ Cost ranges are severity-bucket heuristics (US national rule-of-thumb). Get contractor quotes + a written scope before underwriting a rehab budget.
Schools (NCES district)
- District
- Duval
- NCES district ID
- 1200480
- Math proficiency
- 46% ▼ -11.00%
- Reading proficiency
- 45% ▼ -4.00%
- Median HH income
- $48,987
- Composite
- 38.97/100
- National rank
- #4076
- State rank
- #48 of 73 in FL
Livability — Jacksonville
- Score
- 83/100
- State rank
- #50
- US rank
- #911
Category grades
Schools grade is shown separately in the Schools card above.
Census & demographics
- Census place
- Jacksonville, FL
- County
- Duval County · 1,015,274 people
- City population
- 979,034
- Metro
- Jacksonville, FL
- Population (ZIP)
- 58,192
- Household income
- $73,570
- Rent vs Own
- Severe rent burden
- 2706.0
Population outlook (Duval County) Hauer SSP2
- Today (2025)
- 1,013,010 people
- By 2030
- 1,059,228 · +4.6%
- By 2040
- 1,141,439 · +12.7%
- By 2050
- 1,205,258 · +19.0%
- By 2075
- 1,324,282 · +30.7%
- By 2100
- 1,319,620 · +30.3%
Race, ethnicity, and origin ACS 2023
- Neighborhood character
- Diverse neighborhood (Simpson 0.68)
- Race & ethnicity
- White 51% Black 18% Asian 13% Hispanic / Latino 11% Two or more races 10%
- Hispanic origin (detail)
- Puerto Rican 4% Cuban 1%
- Common ancestry
- Italian 4% Lithuanian 2% Romanian 2%
- Foreign-born
- 22% · Canada, Jamaica, China
- Languages at home
- 73% English-only · Spanish 9% Other Indo-European 6% Other Asian/Pacific 3%
Political lean MEDSL · Duval
- 2024 margin
- Toss-up / Even · D 48.7% · R 50.1% · Other 1.2%
- 2008→2024 swing
- +0.4pp no change · 2008: -1.9pp · 2024: -1.5pp
- All cycles
- 2024: R+1.5 2020: D+3.8 2016: R+1.5 2012: R+3.6 2008: R+1.9
Not yet ingested
- Civics
- —
Market trends
- HPI YoY
- ▼ -1.58%
- Current HPI
- 216.5115
- Rent YoY
- ▲ 0.39%
- Metro
- Jacksonville, FL
- State GDP YoY
- ▲ 3.28%
- F500 in state
- 36
Industry mix (Fortune 500 HQ in FL)
| Industry | F500 HQs | Revenue |
|---|---|---|
| Industrial Technology | 2 | $29B |
|
||
| Insurance | 2 | $17B |
|
||
| Retail | 1 | $60B |
|
||
| Technology Distribution | 1 | $58B |
|
||
| Homebuilding | 1 | $35B |
|
||
| Technology Manufacturing | 1 | $35B |
|
||
Price history
+8664.7% since first listed10 events — show timeline
- 2026-06-01 Listed $149,000 FSBO.com
- 2025-10-12 Rental Removed $1,499 APPFOLIO
- 2025-10-04 Price Changed $1,499 APPFOLIO
- 2025-09-04 Price Changed $1,500 APPFOLIO
- 2025-08-28 Listed for Rent $1,599 APPFOLIO
- 2025-07-20 Rental Removed $1,650 RENTALBEAST
- 2025-07-19 Listed for Rent $1,650 RENTALBEAST
- 2025-01-20 Rental Removed $1,600 BUILDIUM
- 2024-12-04 Price Changed $1,600 BUILDIUM
- 2024-11-03 Listed for Rent $1,700 BUILDIUM
Cash-flow waterfall
monthlySold comps — $/sqft
last 12 mo · ≤1 miLoading sold comps…