1333 N Concord Ave · Springfield, MO
Flood risk 1/10 · Minimal
- FEMA flood zone
- X (unshaded)
- Chance of flooding over 30 yrs
- 0.0%
- Est. flood insurance / yr
- $473 – $860
Fire risk 1/10 · Minimal
- Est. fire insurance / yr
- $1,054 – $1,958
Heat risk 5/10 · Moderate
- Hot days now (above 104°F)
- 7 days/yr
- Hot days in 30 yrs
- 18 days/yr
Wind risk 2/10 · Minimal
- Chance of severe wind over 30 yrs
- —
Air-quality risk 2/10 · Minimal
- Unhealthy air days now
- 1 days/yr
- Unhealthy air days in 30 yrs
- 2 days/yr
Risk factors via First Street. Map © Google.
Why this score? — see what drove the B- grade
The composite is a weighted blend of 9 inputs, each scored 0–100. Each bar is that input's sub-score; the figure is the points it added to the 100-point composite (weight × sub-score).
- Cash flow +25.7/30.0
- ARV discount +12.4/15.0
- DSCR +8.6/10.0
- 1% rule +6.0/10.0
- Livability +3.8/5.0
- Rent growth +3.7/5.0
- Schools +3.2/10.0
- Condition / age +2.5/5.0
- Appreciation +0.0/10.0
$115,000
🖨 Deal sheet 📄 Offer letter ✓ Due diligence
Listing remarks MLS
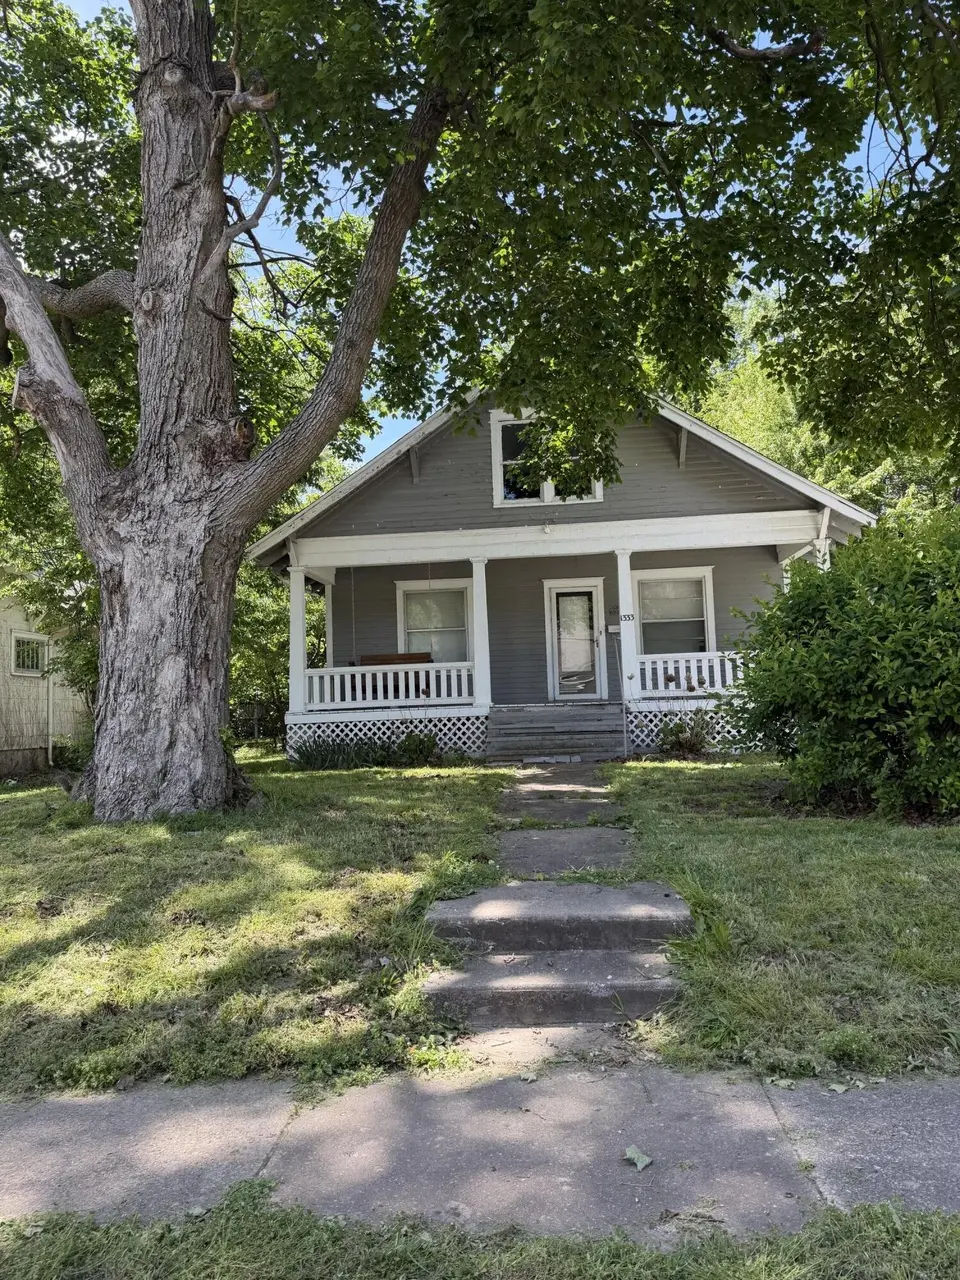
1333 N. Concord Ave. , Springfield MO 65802 has 2 bedrooms on main floor additional rooms in basement. New Dishwasher, New furnace & high efficient air unit installed in 08. Original hardwood floors & built -ins will be very handy and are beautiful. A huge hard maple tree that towers over the home gracing it with shade in the summer time and beauty in the fall with its golden leaves a splendor. The main level has 2 bedrooms one being a master suite. You will enjoy entertaining with a huge open dining / living area. Finished Basement boasts a 2nd living area/recreation room with vent-less heater and 3 additional rooms and storage area. Upstairs level is unfinished storage space with a full staircase leading up to it. You will find a large back deck to enjoy BBQ and a mature shade tree.
Key facts
- 6,534 sq ft lot
- Built 1912
- Listed 35 days
Property features AI
Finance
- Other: Annual tax amount: $844.45
Exterior
- Utilities: Public water; Public sewer
- Home design: Single-family residence; Residential property
- Construction: 1,512 above-grade finished square feet
- Exterior features: 0.15-acre lot; Subdivision: Hendricks & Jones; Directions: From Kearney St, turn south on N Concord Ave; go about 0.2 miles; property will be on the right
Interior
- Bathrooms: 1 full bathroom
- Heating & cooling: Has heating; No cooling
- Interior features: Has heating; Heating type: Other
Neighborhood map
What this means for you Summary
Snapshot
- This is a 2-bed/1.0-bath single-family listed at $115k.
Deal economics
- At list price, monthly cash flow is $276 ($3k/yr) — positive.
- The deal already cash-flows at list — no discount required.
- Meets the 1% rule at list price ($1k rent vs $115k).
- Recommended offer: $112k (3.0% below list) — sets the bar for market timing.
- Cap rate 9.2% vs local median 4.6% in Springfield — top-decile yield for the area; either an underpriced asset or a hidden risk that comps aren't pricing in. Stress-test before assuming the spread holds.
Location & tenants
- Location reads 75/100 on livability (#57 in MO, #4,121 nationally) — a middle-class / working-renter tenant base. Strengths: commute A+, cost of living A+, housing A+; Watch: crime F, employment F.
- Springfield R-XII (urban): math 32% / reading 46% proficiency, ranked #174 of 324 in MO (top 54%) — families likely to look elsewhere, expect single-tenant / working-renter base with shorter leases.
- Zoned schools: Robberson Elem. (math 27% / reading 32%, grade F, #813 of 1,115 statewide, top 75%, 166 students, 89% FRL); Central High (math 42% / reading 62%, grade D+, #92 of 521 statewide, top 20%, 1,464 students, 51% FRL) — zoned schools average 70% FRL vs 46% district-wide (23 pts higher); higher-poverty schools than district average — tighter screening recommended.
- Market conditions: Rents rising fast (+4.8%/yr); 512 active listings in the ZIP; 18 comparable units currently listed for rent nearby; rentals at typical pace (median 23d on market — plan ~3-4 weeks tenant-placement turnaround); 44% of comp listings sitting > 30 days — soft ceiling on asking rent; 1,302 units permitted in Greene County in 2024 (250 in 5+ unit buildings).
Forward outlook
- Local home prices are declining (-3.0%/yr); year-one equity from $795 of loan paydown is wiped out by about $3k of value loss. Plan a longer hold.
- Greene County population projected at +25% by 2050 — long-run rental-demand tailwind backs the buy-and-hold thesis.
- At projected returns (-3.0% appreciation + 4.8% rent growth), your $32k cash investment doubles in ~9 years — after that, you're playing with house money.
Negotiation context
- It's been on market 35 days — a 3% lower offer ($112k) is reasonable based on typical stale-listing flexibility.
- 4 sale attempts since 10y ago with the ask held roughly flat each time — persistent listings suggest the price (not the market) is what's stuck; bring a comps-based counter.
Risks & watch-outs
- Watch-outs: built in 1912 — expect roof / HVAC / electrical / plumbing capex.
- Climate carrying-cost: extreme-heat days projected 7→18/yr by 2055 (HVAC capex compounding) — expect insurance premiums to compound above CPI over the hold.
Questions for the listing agent
- It's been on market 35 days. Have you received any prior offers? Is the seller open to a 3% concession, seller financing, or rate buy-down credit?
- Built in 1912 — when were the roof, HVAC, electrical panel, plumbing, and water heater last replaced?
- Is there a deadline driving the sale (1031 exchange, divorce, estate, relocation)? That informs how much negotiation room exists.
- Crime grade is F in this area — have there been break-ins, vandalism, or insurance claims at this property in the last 3 years? What carrier currently insures it and at what premium?
- What's the average days-on-market for RENTAL listings here right now (not sales)? A rising rental-DOM trend means longer vacancies and softer asking-rent achievability than the comps imply.
- What's the recent tenant-quality profile in this submarket — average credit score on applications, eviction rate, late-payment / NSF rate, and stable-employment percentage? A property-management company in the area should have these aggregated.
- How much new for-sale + rental construction is in the pipeline within 1–3 miles? Heavy new supply typically softens prices + rents 12–24 months out; constrained supply supports both.
Investment metrics
- 1% rule
- 1.10% ✓
- Cap rate
- 9.17%
- Cash-on-cash
- 10.27%
- DSCR
- 1.46
- GRM
- 7.6
CMA / ARV
- ARV (median comp)
- $128,943
- List price
- $115,000
- Delta
- -10.81%
- Verdict
- UNDERPRICED
- Comps
- 20 within 1.0 mi
Show comp detail 12 sales within ~0.75 mi
| Address | Dist | Beds/Ba | Sqft | Sold | Price | $/sf | Match |
|---|---|---|---|---|---|---|---|
| 1344 N Grant Ave | 0.04mi | 2/1.0 | 1,454 (-4%) | 19mo | $120,000 | $83 | 76 |
| 637 W Scott St | 0.20mi | 3/2.5 (+1) | 1,508 (-0%) | 15mo | $189,900 | $126 | 67 |
| 628 W Lynn St | 0.04mi | 3/2.0 (+1) | 1,352 (-11%) | 9mo | $199,900 | $148 | 64 |
| 1534 N Grant Ave | 0.28mi | 3/1.0 (+1) | 1,349 (-11%) | 4mo | $80,000 | $59 | 61 |
| 1120 N Concord Ave | 0.18mi | 3/1.0 (+1) | 1,331 (-12%) | 14mo | $149,900 | $113 | 55 |
| 606 W Locust St | 0.28mi | 2/2.0 | 1,713 (+13%) | 10mo | $150,000 | $88 | 52 |
| 758 N Grant Ave | 0.47mi | 3/2.0 (+1) | 1,392 (-8%) | 4mo | $154,900 | $111 | 52 |
| 1156 W Lynn St | 0.49mi | 3/1.0 (+1) | 1,383 (-8%) | 10mo | $170,000 | $123 | 50 |
| 1322 N Benton Ave | 0.58mi | 2/2.0 | 1,386 (-8%) | 13mo | $209,900 | $151 | 44 |
| 1107 W Nichols St | 0.51mi | 3/1.5 (+1) | 1,302 (-14%) | 9mo | $145,000 | $111 | 38 |
| 1209 N Jefferson Ave | 0.46mi | 3/2.0 (+1) | 1,298 (-14%) | 16mo | $300,000 | $231 | 33 |
| 1871 N Douglas Ave | 0.59mi | 3/2.0 (+1) | 1,738 (+15%) | 11mo | $219,500 | $126 | 30 |
Match score weights: distance 35% · size 25% · config 20% · recency 20%. Top-matched comps best support the ARV.
Projected returns pro-forma
-3.0% appreciation · 4.82% rent growth · sell at horizon
- IRR
- 1.0%
- Equity multiple
- 1.04×
- Total profit
- $1,242
- Equity at exit
- $17,147
- IRR
- 12.2%
- Equity multiple
- 2.04×
- Total profit
- $33,595
- Equity at exit
- $9,943
Cash invested: $32,200 (down + closing). Projections, not guarantees.
Landlord ↔ Tenant lean methodology
- Overall (STATE)
- 81 Strongly Landlord-Friendly
- State Missouri
- 81 Strongly Landlord-Friendly · R+10
- County
- — inherits STATE
- City
- — inherits STATE
ZIP-level market 65802
- Home prices YoY
- -31.9%
- Rents YoY
- 4.8%
- Active inventory
- 512
- Price-to-rent
- 7.6×
Monthly cashflow live
- Estimated rent
- $1,262 high interval (Pro) →
- Mortgage (P&I)
- −$603
- Tax from tax record
- −$70 /mo · $844/yr
- Insurance
- −$48
- HOA
- −$0
- Vacancy / Maint / Mgmt
- −$265
- Net cashflow
- $276
Break-even live
UW: 25.0% down · 7.5% · 30yr · 1.5% tax · 5.0% vac · 8.0% maint · 8.0% mgmt
Financing live
Cash to close
- Down payment
- $28,750
- Closing costs
- $3,450
- Reserves months
- —
- Total cash needed
- —
Loan-product check · same deal, 3 products live
Conventional
25% down · 7.5% · 30yr
- Down + closing
- —
- Monthly P&I
- —
- Monthly cashflow
- —
- DSCR
- —
- Eligible?
- —
Personal DTI + credit; lowest rate.
DSCR
20% down · 8.5% · 30yr
- Down + closing
- —
- Monthly P&I
- —
- Monthly cashflow
- —
- DSCR
- —
- Eligible?
- —
No personal income docs; deal must DSCR.
Hard money
10% down · 12.0% · 12mo
- Down + closing
- —
- Monthly P&I
- —
- Monthly cashflow
- —
- DSCR
- —
- Eligible?
- —
Short-term bridge; refi at stabilization.
Rent comps 18 comps
| Address | Beds | Baths | Sqft | Rent | $/sqft | DOM | Units | Dist |
|---|---|---|---|---|---|---|---|---|
| 616 W Webster St Springfield, MO | 2.0 | 1.5 | 1178 | $1,050 | $0.89 | 13d | 1 | 0.16mi |
| 1530 N Robberson Ave Springfield, MO | 3.0 | 2.0 | 1122 | $1,425 | $1.27 | 43d | 1 | 0.51mi |
| 235 N Market Ave Springfield, MO | 1.0–4.0 | 1.0–2.0 | 1350 | $1,267 | $0.94 | 13d | 4 | 0.94mi |
| 235 N Market Ave Springfield, MO | 1.0–4.0 | 1.0–2.0 | 1350 | $1,267 | $0.94 | 23d | 5 | 0.94mi |
| 520 W Olive St Springfield, MO | 3.0 | 2.0 | 1445 | $1,538 | $1.06 | 13d | 5 | 0.94mi |
| 138 Park Central Sq Springfield, MO | 1.0–2.0 | 1.0–2.0 | 1083 | $2,489 | $2.30 | 13d | 8 | 0.98mi |
| 518 W College St Unit UBL 106 Springfield, MO | 2.0 | 2.0 | 1200 | $1,375 | $1.15 | 43d | 1 | 1.00mi |
| 211 S Market Ave Springfield, MO | 2.0–4.0 | 1.0–2.0 | 1442 | $1,425 | $0.99 | 23d | 5 | 1.02mi |
| 211 S Market Ave Springfield, MO | 2.0–4.0 | 1.0–2.0 | 1442 | $1,425 | $0.99 | 21d | 5 | 1.02mi |
| 1442 N Texas Ave Springfield, MO | 3.0 | 2.0 | 1626 | $1,400 | $0.86 | 43d | 1 | 1.05mi |
| 535 W Walnut St Springfield, MO | 2.0 | 2.0 | 1096 | $1,495 | $1.36 | 43d | 1 | 1.06mi |
| 623 W Walnut St Springfield, MO | 2.0 | 2.0 | 1180 | $1,300 | $1.10 | 43d | 1 | 1.06mi |
| 2230 N Campbell Ave Springfield, MO | 2.0 | 1.0 | 1084 | $1,095 | $1.01 | 43d | 1 | 1.07mi |
| 1306 N Frisco Ave Apt A Springfield, MO | 2.0 | 1.5–2.0 | 970 | $995 | $1.03 | 13d | 19 | 1.09mi |
| 710 W Walnut St Springfield, MO | 3.0 | 2.0 | 1350 | $1,695 | $1.26 | 43d | 1 | 1.11mi |
| 630 S Market Ave Springfield, MO | 3.0 | 2.0 | 1758 | $2,150 | $1.22 | 43d | 1 | 1.37mi |
| 539 S Fort Ave Springfield, MO | 2.0 | 1.0 | 1500 | $1,025 | $0.68 | 13d | 1 | 1.39mi |
| 1339 E Division St Springfield, MO | 3.0 | 2.0 | 1186 | $1,350 | $1.14 | 23d | 1 | 1.44mi |
Listing history 21 events
-
2026-06-18days on market $115,000 Active 35 DOM
-
2026-06-17days on market $115,000 Active 34 DOM
-
2026-06-16days on market $115,000 Active 33 DOM
-
2026-06-15days on market $115,000 Active 32 DOM
-
2026-06-14days on market $115,000 Active 30 DOM
-
2026-06-10days on market $115,000 Active 27 DOM
-
2026-06-09days on market $115,000 Active 26 DOM
-
2026-06-08days on market $115,000 Active 25 DOM
-
2026-06-07days on market $115,000 Active 24 DOM
-
2026-06-03days on market $115,000 Active 20 DOM
-
2026-06-02days on market $115,000 Active 19 DOM
-
2026-06-01days on market $115,000 Active 18 DOM
-
2026-05-31days on market $115,000 Active 17 DOM
-
2026-05-30days on market $115,000 Active 16 DOM
-
2026-05-14$115,000 Active 25-char remark
-
2023-09-10historical $925
-
2023-09-04$925
-
2017-07-12$84,900
-
2016-06-17soldstatus
-
2016-06-16soldstatus
Show marketing remark (807 chars)
1333 N. Concord Ave. , Springfield MO 65802 has 2 bedrooms on main floor additional rooms in basement. New Dishwasher, New furnace & high efficient air unit installed in 08. Original hardwood floors & built -ins will be very handy and are beautiful. A huge hard maple tree that towers over the home gracing it with shade in the summer time and beauty in the fall with its golden leaves a splendor. The main level has 2 bedrooms one being a master suite. You will enjoy entertaining with a huge open dining / living area. Finished Basement boasts a 2nd living area/recreation room with vent-less heater and 3 additional rooms and storage area. Upstairs level is unfinished storage space with a full staircase leading up to it. You will find a large back deck to enjoy BBQ and a mature shade tree.
-
2016-01-08$83,000
Show marketing remark (807 chars)
1333 N. Concord Ave. , Springfield MO 65802 has 2 bedrooms on main floor additional rooms in basement. New Dishwasher, New furnace & high efficient air unit installed in 08. Original hardwood floors & built -ins will be very handy and are beautiful. A huge hard maple tree that towers over the home gracing it with shade in the summer time and beauty in the fall with its golden leaves a splendor. The main level has 2 bedrooms one being a master suite. You will enjoy entertaining with a huge open dining / living area. Finished Basement boasts a 2nd living area/recreation room with vent-less heater and 3 additional rooms and storage area. Upstairs level is unfinished storage space with a full staircase leading up to it. You will find a large back deck to enjoy BBQ and a mature shade tree.
ⓘ Source: listings_history table (triggers on properties + properties_extension) + one-shot
backfill from property_details.listing_events for pre-trigger history.
Tax reassessment forecast MO · Resets to sale price
- Current annual tax
- $844 · $70/mo
- Projected year-2 tax
- $1,116 · $93/mo
- Expected delta
- +$271/yr (+$23/mo · 32.1%)
ⓘ Screening estimate from a state-policy table — verify with the county assessor before closing.
Climate risk First Street
- Flood 1/10 Low FEMA zone X (unshaded) · 0% chance over 30 yrs
- Wildfire 1/10 Low
- Heat 5/10 Major 7 d/yr ≥104°F today · 18 d/yr by 30 yrs out
- Wind 2/10 Low
- Air quality 2/10 Low 1 unhealthy d/yr today · 2 by 30 yrs out
Nearby sold comps map
Loading sold comps map…
Walkable amenities ~0.75 mi
Loading nearby amenities…
Taxation est. · year 1
- Rental income
- $15,143
- − Mortgage interest
- −$6,442
- − Property taxes
- −$844
- − Insurance
- −$575
- − Repairs & maintenance
- −$1,211
- − Management
- −$1,211
- − Depreciation
- −$3,345
- Taxable income
- $1,513
- Est. tax owed @ 24.0%
- −$363
- After-tax cash flow
- $2,943/yr
For passive investors: Depreciation is non-cash, so a rental often shows a tax loss while cash-flowing — sheltering income. Rental losses are passive: they offset passive income freely, and up to $25,000/yr can offset ordinary (W-2) income if you actively participate and your MAGI is under $100k (phasing out to $0 by $150k); unused losses carry forward. On sale, claimed depreciation is recaptured at up to 25%, and gains may owe capital-gains tax (a 1031 exchange can defer both). Figures are a year-1 estimate at your 24.0% rate — not tax advice; consult a CPA.
Schools (NCES district)
- District
- Springfield R-XII
- NCES district ID
- 2928860
- Math proficiency
- 32% ▼ -2.00%
- Reading proficiency
- 46% ▼ -3.00%
- Median HH income
- $37,886
- Composite
- 32.45/100
- National rank
- #5717
- State rank
- #174 of 324 in MO
Livability — Springfield
- Score
- 75/100
- State rank
- #57
- US rank
- #4121
Category grades
Schools grade is shown separately in the Schools card above.
Census & demographics
- Census place
- Springfield, MO
- County
- Greene County · 244,327 people
- City population
- 223,044
- Metro
- Springfield, MO
- Population (ZIP)
- 46,739
- Household income
- $55,019
- Rent vs Own
- Severe rent burden
- 1818.0
Population outlook (Greene County) Hauer SSP2
- Today (2025)
- 319,054 people
- By 2030
- 335,135 · +5.0%
- By 2040
- 366,186 · +14.8%
- By 2050
- 397,431 · +24.6%
- By 2075
- 477,035 · +49.5%
- By 2100
- 520,828 · +63.2%
Race, ethnicity, and origin ACS 2023
- Neighborhood character
- Predominantly White (81%)
- Race & ethnicity
- White 81% Two or more races 8% Hispanic / Latino 5% Black 4% Asian 2%
- Common ancestry
- Slovak 2% Lithuanian 2% Italian 2%
- Foreign-born
- 3% · Canada, Vietnam
- Languages at home
- 95% English-only · Spanish 2% Vietnamese 1% Other Indo-European 1%
Political lean MEDSL · Greene
- 2024 margin
- Strong R (+20.8) · D 38.9% · R 59.7% · Other 1.4%
- 2008→2024 swing
- -5.0pp toward R · 2008: -15.8pp · 2024: -20.8pp
- All cycles
- 2024: R+20.8 2020: R+20.1 2016: R+27.4 2012: R+24.4 2008: R+15.8
Not yet ingested
- Civics
- —
Market trends
- HPI YoY
- ▼ -99.72%
- Current HPI
- 212.9826
- Rent YoY
- ▲ 4.82%
- Metro
- Springfield, MO
- State GDP YoY
- ▲ 1.84%
- F500 in state
- 20
Industry mix (Fortune 500 HQ in MO)
| Industry | F500 HQs | Revenue |
|---|---|---|
| Healthcare | 1 | $163B |
|
||
| Insurance | 1 | $21B |
|
||
| Industrial Technology | 1 | $17B |
|
||
| Retail | 1 | $16B |
|
||
| Industrial Distribution | 1 | $10B |
|
||
| Utilities | 1 | $9B |
|
||
Price history
+38.6% since first listed7 events — show timeline
- 2026-05-14 Listed $115,000 SOMO
- 2023-09-10 Rental Removed $925 APPFOLIO
- 2023-09-04 Listed for Rent $925 APPFOLIO
- 2017-07-12 Listed $84,900 SOMO
- 2016-06-17 Sold (Public Records) — Public Records
- 2016-06-16 Sold (MLS) — SOMO
- 2016-01-08 Listed $83,000 SOMO
Property tax history
+3.1%/yrLatest (2025): $844 · +17.4% YoY. Source: county tax records.
Cash-flow waterfall
monthlySold comps — $/sqft
last 12 mo · ≤1 miLoading sold comps…