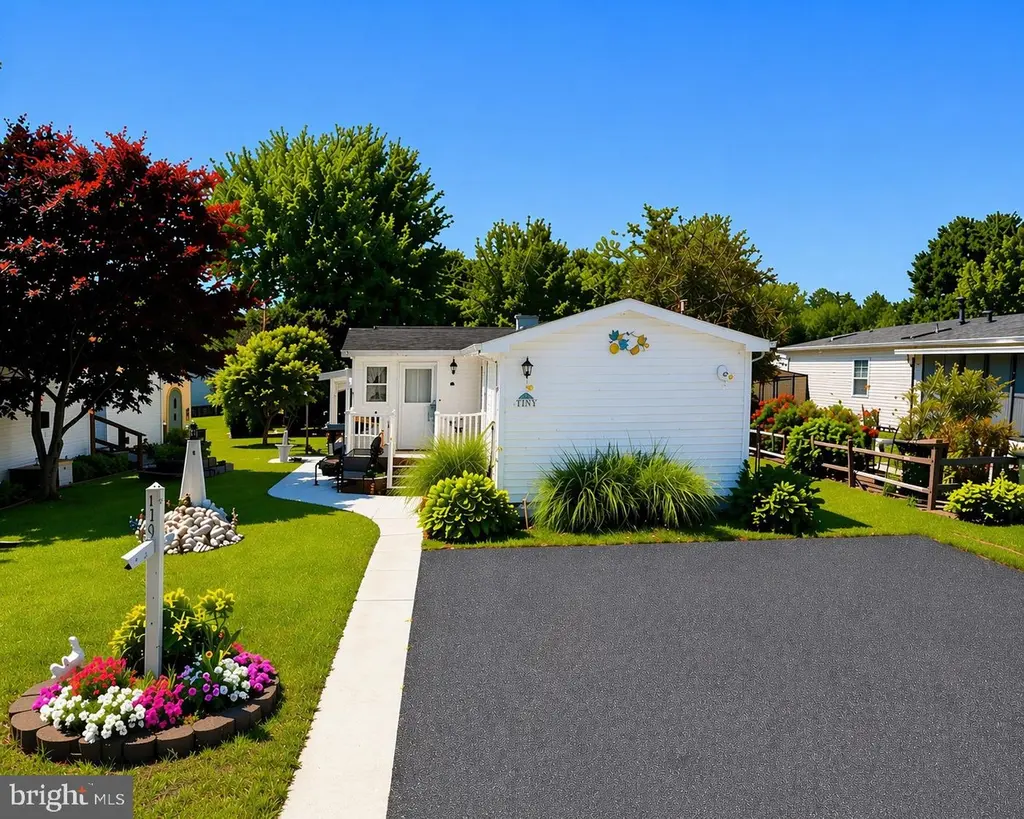
33500 Buttercup St · Lewes, DE
Flood risk 1/10 · Minimal
- FEMA flood zone
- X (unshaded)
- Chance of flooding over 30 yrs
- 0.0%
- Est. flood insurance / yr
- $473 – $860
Fire risk 1/10 · Minimal
- Est. fire insurance / yr
- $476 – $884
Heat risk 8/10 · Major
- Hot days now (above 102°F)
- 7 days/yr
- Hot days in 30 yrs
- 17 days/yr
Wind risk 8/10 · Major
- Chance of severe wind over 30 yrs
- 80.0%
Air-quality risk 2/10 · Minimal
- Unhealthy air days now
- 1 days/yr
- Unhealthy air days in 30 yrs
- 1 days/yr
Risk factors via First Street. Map © Google.
Why this score? — see what drove the C+ grade
The composite is a weighted blend of 9 inputs, each scored 0–100. Each bar is that input's sub-score; the figure is the points it added to the 100-point composite (weight × sub-score).
- Cash flow +30.0/30.0
- DSCR +10.0/10.0
- 1% rule +9.0/10.0
- Schools +4.2/10.0
- Livability +3.4/5.0
- Rent growth +2.7/5.0
- Condition / age +2.5/5.0
- ARV discount +0.0/15.0
- Appreciation +0.0/10.0
$149,900
🖨 Deal sheet 📄 Offer letter ✓ Due diligence
Listing remarks MLS
Located in Angola Beach & Estates, one of the most amenity-rich and well-maintained leased-land communities in the area, this 2 bedroom, 2 bath, comes fully furnished and offers a bright, beachy, comfortable living space, complemented by luxury vinyl plank flooring throughout. The split floor plan provides privacy with an owner’s suite and attached bath on the opposite side of the house from the guest bedroom. Used as a vacation home, it has been lightly lived in and well cared for. Large screened-in porch with two ceiling fans, a porch swing, oversized couch and family table. Plus a storage shed to house all those outdoor activities. Community amenities include two swimming pools, a floating-dock marina ideal for tidal waters, a fishing pier, boat storage yard, playgrounds, tennis courts, basketball court, and a large, recently renovated community center that hosts planned events throughout the year. Water, sewer, and trash are included in the lot rent. See it today!
Key facts
- Two swimming pools
- Split floor plan
- Storage shed
Tags
Neighborhood map
What this means for you Summary
Snapshot
- This is a 2-bed/2.0-bath manufactured listed at $150k.
Deal economics
- At list price, monthly cash flow is $626 ($8k/yr) — positive.
- The deal already cash-flows at list — no discount required.
- Meets the 1% rule at list price ($2k rent vs $150k).
- Recommended offer: $145k (3.0% below list) — sets the bar for market timing.
- Cap rate 11.3% vs local median 1.7% in Lewes — top-decile yield for the area; either an underpriced asset or a hidden risk that comps aren't pricing in. Stress-test before assuming the spread holds.
Location & tenants
- Location reads 67/100 on livability (#40 in DE) — a middle-class / working-renter tenant base. Strengths: crime A+, employment A+, health & safety A+; Watch: commute F, cost of living F.
- Cape Henlopen School District (town): math 42% / reading 55% proficiency, ranked #5 of 26 in DE (top 19%) — families likely to look elsewhere, expect single-tenant / working-renter base with shorter leases.
- Market conditions: Rents flat; 818 active listings in the ZIP; 3 comparable units currently listed for rent nearby; rentals leasing fast (median 13d on market — plan ~1-2 weeks tenant-placement turnaround); solid renter incomes; 4,354 units permitted in Sussex County in 2024 (344 in 5+ unit buildings).
Forward outlook
- Local home prices are declining (-3.0%/yr); year-one equity from $1k of loan paydown is wiped out by about $4k of value loss. Plan a longer hold.
- Sussex County population projected at +25% by 2050 — long-run rental-demand tailwind backs the buy-and-hold thesis.
- At projected returns (-3.0% appreciation + 0.8% rent growth), your $42k cash investment doubles in ~9 years — after that, you're playing with house money.
Negotiation context
- It's been on market 42 days — a 3% lower offer ($145k) is reasonable based on typical stale-listing flexibility.
Risks & watch-outs
- Climate carrying-cost: severe wind risk, 80% chance of damaging wind over 30y; extreme-heat days projected 7→17/yr by 2055 (HVAC capex compounding) — expect insurance premiums to compound above CPI over the hold.
Questions for the listing agent
- It's been on market 42 days. Have you received any prior offers? Is the seller open to a 3% concession, seller financing, or rate buy-down credit?
- Is there a deadline driving the sale (1031 exchange, divorce, estate, relocation)? That informs how much negotiation room exists.
- Schools are B-rated — typically a magnet for longer-tenancy family renters. What's the average tenant stay here, and is there a school-zone premium baked into asking?
- What's the average days-on-market for RENTAL listings here right now (not sales)? A rising rental-DOM trend means longer vacancies and softer asking-rent achievability than the comps imply.
- What's the recent tenant-quality profile in this submarket — average credit score on applications, eviction rate, late-payment / NSF rate, and stable-employment percentage? A property-management company in the area should have these aggregated.
- How much new for-sale + rental construction is in the pipeline within 1–3 miles? Heavy new supply typically softens prices + rents 12–24 months out; constrained supply supports both.
Investment metrics
- 1% rule
- 1.40% ✓
- Cap rate
- 11.31%
- Cash-on-cash
- 17.90%
- DSCR
- 1.80
- GRM
- 5.9
CMA / ARV
- ARV (median comp)
- $119,338
- List price
- $149,900
- Delta
- 25.61%
- Verdict
- OVERPRICED
- Comps
- 20 within 1.0 mi
Show comp detail 2 sales within ~0.75 mi
| Address | Dist | Beds/Ba | Sqft | Sold | Price | $/sf | Match |
|---|---|---|---|---|---|---|---|
| 33302 Marlin Ct | 0.20mi | 2/1.5 | 900 (-3%) | 10mo | $75,000 | $83 | 76 |
| 33305 Marlin Ct | 0.19mi | 2/1.0 | 980 (+6%) | 23mo | $70,000 | $71 | 58 |
Match score weights: distance 35% · size 25% · config 20% · recency 20%. Top-matched comps best support the ARV.
Projected returns pro-forma
-3.0% appreciation · 0.77% rent growth · sell at horizon
- IRR
- 6.9%
- Equity multiple
- 1.26×
- Total profit
- $11,003
- Equity at exit
- $22,351
- IRR
- 14.2%
- Equity multiple
- 2.02×
- Total profit
- $42,941
- Equity at exit
- $12,961
Cash invested: $41,972 (down + closing). Projections, not guarantees.
Landlord ↔ Tenant lean methodology
- Overall (STATE)
- 70 Landlord-Friendly
- State Delaware
- 70 Landlord-Friendly · D+7
- County
- — inherits STATE
- City
- — inherits STATE
ZIP-level market 19958
- Rents YoY
- 0.8%
- Active inventory
- 818
- Price-to-rent
- 5.9×
Monthly cashflow live
- Estimated rent
- $2,104 medium interval (Pro) →
- Mortgage (P&I)
- −$786
- Tax est. 1.5%
- −$187 /mo · $2,248/yr
- Insurance
- −$62
- HOA
- −$0
- Vacancy / Maint / Mgmt
- −$442
- Net cashflow
- $626
Break-even live
UW: 25.0% down · 7.5% · 30yr · 1.5% tax · 5.0% vac · 8.0% maint · 8.0% mgmt
Financing live
Cash to close
- Down payment
- $37,475
- Closing costs
- $4,497
- Reserves months
- —
- Total cash needed
- —
Loan-product check · same deal, 3 products live
Conventional
25% down · 7.5% · 30yr
- Down + closing
- —
- Monthly P&I
- —
- Monthly cashflow
- —
- DSCR
- —
- Eligible?
- —
Personal DTI + credit; lowest rate.
DSCR
20% down · 8.5% · 30yr
- Down + closing
- —
- Monthly P&I
- —
- Monthly cashflow
- —
- DSCR
- —
- Eligible?
- —
No personal income docs; deal must DSCR.
Hard money
10% down · 12.0% · 12mo
- Down + closing
- —
- Monthly P&I
- —
- Monthly cashflow
- —
- DSCR
- —
- Eligible?
- —
Short-term bridge; refi at stabilization.
Rent comps 3 comps
| Address | Beds | Baths | Sqft | Rent | $/sqft | DOM | Units | Dist |
|---|---|---|---|---|---|---|---|---|
| 33135 Woodland Ct N Lewes, DE | 3.0 | 2.0 | 1120 | $2,250 | $2.01 | 13d | 1 | 0.57mi |
| 22828 Sycamore Dr Lewes, DE | 2.0 | 2.0 | 1100 | $2,400 | $2.18 | 13d | 1 | 0.97mi |
| 22806 Sycamore Dr Lewes, DE | 2.0 | 1.5 | 840 | $1,550 | $1.85 | 13d | 1 | 1.00mi |
Listing history 11 events
-
2026-06-17days on market $149,900 Active 42 DOM
-
2026-06-16days on market $149,900 Active 41 DOM
-
2026-06-15days on market $149,900 Active 40 DOM
-
2026-06-14days on market $149,900 Active 38 DOM
-
2026-06-13days on market $149,900 Active 37 DOM
-
2026-06-10days on market $149,900 Active 35 DOM
-
2026-06-09days on market $149,900 Active 34 DOM
-
2026-06-08days on market $149,900 Active 33 DOM
-
2026-06-07pricestatusdays on market $149,900 Active 32 DOM
-
2026-05-16historical Active Under Contract 994-char remark
Show marketing remark (994 chars)
Located in Angola Beach & Estates, one of the most amenity-rich and well-maintained leased-land communities in the area, this 2 bedroom, 2 bath, comes fully furnished and offers a bright, beachy, comfortable living space, complemented by luxury vinyl plank flooring throughout. The split floor plan provides privacy with an owner’s suite and attached bath on the opposite side of the house from the guest bedroom. Used as a vacation home, it has been lightly lived in and well cared for. Large screened-in porch with two ceiling fans, a porch swing, oversized couch and family table. Plus a storage shed to house all those outdoor activities. Community amenities include two swimming pools, a floating-dock marina ideal for tidal waters, a fishing pier, boat storage yard, playgrounds, tennis courts, basketball court, and a large, recently renovated community center that hosts planned events throughout the year. Water, sewer, and trash are included in the lot rent. See it today!
-
2026-04-16$149,999 Active 994-char remark
Show marketing remark (994 chars)
Located in Angola Beach & Estates, one of the most amenity-rich and well-maintained leased-land communities in the area, this 2 bedroom, 2 bath, comes fully furnished and offers a bright, beachy, comfortable living space, complemented by luxury vinyl plank flooring throughout. The split floor plan provides privacy with an owner’s suite and attached bath on the opposite side of the house from the guest bedroom. Used as a vacation home, it has been lightly lived in and well cared for. Large screened-in porch with two ceiling fans, a porch swing, oversized couch and family table. Plus a storage shed to house all those outdoor activities. Community amenities include two swimming pools, a floating-dock marina ideal for tidal waters, a fishing pier, boat storage yard, playgrounds, tennis courts, basketball court, and a large, recently renovated community center that hosts planned events throughout the year. Water, sewer, and trash are included in the lot rent. See it today!
ⓘ Source: listings_history table (triggers on properties + properties_extension) + one-shot
backfill from property_details.listing_events for pre-trigger history.
Climate risk First Street
- Flood 1/10 Low FEMA zone X (unshaded) · 0% chance over 30 yrs
- Wildfire 1/10 Low
- Heat 8/10 Severe 7 d/yr ≥102°F today · 17 d/yr by 30 yrs out
- Wind 8/10 Severe 80% chance of damaging wind over 30 yrs
- Air quality 2/10 Low 1 unhealthy d/yr today · 1 by 30 yrs out
Nearby sold comps map
Loading sold comps map…
Walkable amenities ~0.75 mi
Loading nearby amenities…
Taxation est. · year 1
- Rental income
- $25,247
- − Mortgage interest
- −$8,397
- − Property taxes
- −$2,248
- − Insurance
- −$750
- − Repairs & maintenance
- −$2,020
- − Management
- −$2,020
- − Depreciation
- −$4,361
- Taxable income
- $5,452
- Est. tax owed @ 24.0%
- −$1,308
- After-tax cash flow
- $6,205/yr
For passive investors: Depreciation is non-cash, so a rental often shows a tax loss while cash-flowing — sheltering income. Rental losses are passive: they offset passive income freely, and up to $25,000/yr can offset ordinary (W-2) income if you actively participate and your MAGI is under $100k (phasing out to $0 by $150k); unused losses carry forward. On sale, claimed depreciation is recaptured at up to 25%, and gains may owe capital-gains tax (a 1031 exchange can defer both). Figures are a year-1 estimate at your 24.0% rate — not tax advice; consult a CPA.
Schools (NCES district)
- District
- Cape Henlopen School District
- NCES district ID
- 1000170
- Math proficiency
- 42% ▼ -14.00%
- Reading proficiency
- 55% ▼ -10.00%
- Median HH income
- $60,196
- Composite
- 42.47/100
- National rank
- #3214
- State rank
- #5 of 26 in DE
Livability — Lewes
- Score
- 67/100
- State rank
- #40
- US rank
- #11077
Category grades
Schools grade is shown separately in the Schools card above.
Census & demographics
- County
- Sussex County · 82,708 people
- City population
- 31,938
- Metro
- Salisbury, MD-DE
- Population (ZIP)
- 31,938
- Household income
- $97,197
- Rent vs Own
- Severe rent burden
- 545.0
Population outlook (Sussex County) Hauer SSP2
- Today (2025)
- 248,853 people
- By 2030
- 264,464 · +6.3%
- By 2040
- 290,980 · +16.9%
- By 2050
- 311,259 · +25.1%
- By 2075
- 352,488 · +41.6%
- By 2100
- 367,406 · +47.6%
Race, ethnicity, and origin ACS 2023
- Neighborhood character
- Predominantly White (88%)
- Race & ethnicity
- White 88% Two or more races 6% Hispanic / Latino 4% Black 2% Asian 2%
- Common ancestry
- Romanian 6% Slovak 3% Italian 2%
- Foreign-born
- 6% · Canada
- Languages at home
- 93% English-only · Spanish 3% Other Indo-European 1% Russian/Polish/Slavic 1%
Political lean MEDSL · Sussex
- 2024 margin
- R (+11.0) · D 43.9% · R 54.9% · Other 1.2%
- 2008→2024 swing
- -2.4pp toward R · 2008: -8.6pp · 2024: -11.0pp
- All cycles
- 2024: R+11.0 2020: R+11.2 2016: R+22.0 2012: R+13.0 2008: R+8.6
Not yet ingested
- Civics
- —
Market trends
- HPI YoY
- ▼ -204.07%
- Current HPI
- 299.0736
- Rent YoY
- ▲ 0.77%
- Metro
- Salisbury, MD-DE
- State GDP YoY
- —
- F500 in state
- 0
Price history
2 events — show timeline
- 2026-05-16 Contingent — BRIGHT MLS
- 2026-04-16 Listed $149,999 BRIGHT MLS
Property tax history
-12.3%/yrLatest (2025): $165 · -70.3% YoY. Source: county tax records.
Cash-flow waterfall
monthlySold comps — $/sqft
last 12 mo · ≤1 miLoading sold comps…