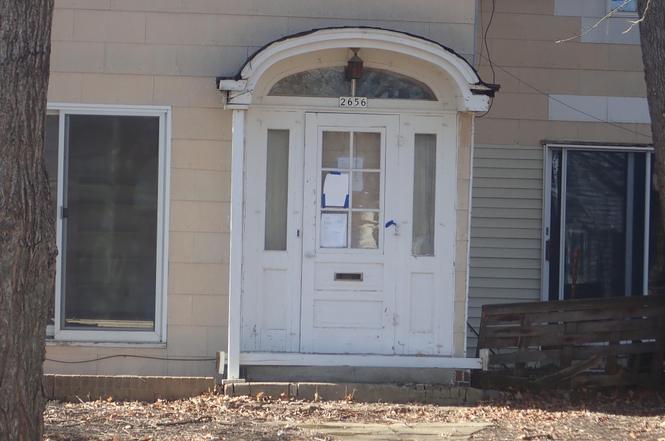
2656 Norwood Ave · Slayton, MN
Flood risk No data
- FEMA flood zone
- —
- Chance of flooding over 30 yrs
- —
- Est. flood insurance / yr
- —
Fire risk No data
- Est. fire insurance / yr
- —
Heat risk No data
- Hot days now (above threshold)
- —
- Hot days in 30 yrs
- —
Wind risk No data
- Chance of severe wind over 30 yrs
- —
Air-quality risk No data
- Unhealthy air days now
- —
- Unhealthy air days in 30 yrs
- —
Risk factors via First Street. Map © Google.
Why this score? — see what drove the D+ grade
The composite is a weighted blend of 9 inputs, each scored 0–100. Each bar is that input's sub-score; the figure is the points it added to the 100-point composite (weight × sub-score).
- Cash flow +15.0/30.0
- ARV discount +7.5/15.0
- Schools +5.5/10.0
- 1% rule +5.0/10.0
- DSCR +5.0/10.0
- Livability +3.9/5.0
- Rent growth +2.5/5.0
- Condition / age +2.5/5.0
- Appreciation +0.0/10.0
$19,900
🖨 Deal sheet (PDF) 📄 Offer letter ✓ Due diligence
Key facts
- Forced-air heating
- Generous lot
- Functional layout
Tags
Property features AI
Finance
- Other: Approximately 0.321-acre lot
Exterior
- Parking: Attached 1-car garage
- Utilities: City water connected; City sewer connected; Natural gas service
- Home design: Residential property; Two levels; No-stairs external accessibility feature
- Construction: Block and frame construction; Asphalt roof; Built on a foundation with approximate dimensions 30 x 20
- Exterior features: Medium tree coverage; Level topography; Publicly maintained paved city streets and city street frontage; Lot dimensions approximately 100 x 140 feet
Interior
- Kitchen: Kitchen on the main level
- Bedrooms: 3 bedrooms (includes upper/main level placement where specified)
- Bathrooms: One three-quarter bathroom (upper level)
- Heating & cooling: Forced air heating; No central air
- Interior features: Living/dining room combination; 3 bedrooms on one level; Crawl space basement
- Laundry & utility: Dedicated laundry room
Neighborhood map
What this means for you Summary
Snapshot
- This is a 3-bed/1.0-bath single-family listed at $20k.
Deal economics
- At list price, monthly cash flow is $621 ($7k/yr) — positive.
- The deal already cash-flows at list — no discount required.
- Meets the 1% rule at list price ($963 rent vs $20k).
Location & tenants
- Location reads 77/100 on livability (#141 in MN, #3,076 nationally) — a middle-class / working-renter tenant base. Strengths: crime A+, cost of living A+, housing A+; Watch: employment D+, amenities F, commute F.
- Murray County Central School District (rural): math 68% / reading 60% proficiency, ranked #28 of 301 in MN (top 9%) — acceptable for families but not a draw, mixed tenant base, ~2y average lease.
- Market conditions: 43 active listings in the ZIP; 21 units permitted in Murray County in 2024 (0 in 5+ unit buildings).
Forward outlook
- Local home prices are declining (-3.0%/yr); year-one equity from $138 of loan paydown is wiped out by about $597 of value loss. Plan a longer hold.
- Murray County population projected at -14% by 2050 — secular population decline; favor cash flow + early exit over multi-decade hold.
- At projected returns (-3.0% appreciation + 3.0% rent growth), your $6k cash investment doubles in ~1 year — after that, you're playing with house money.
Negotiation context
- Only 4 days on market — expect competitive offers; lowballing is unlikely to land.
- 5 sale attempts with the ask held roughly flat each time — persistent listings suggest the price (not the market) is what's stuck; bring a comps-based counter.
Risks & watch-outs
- Watch-outs: built in 1910 — expect roof / HVAC / electrical / plumbing capex.
Questions for the listing agent
- Built in 1910 — when were the roof, HVAC, electrical panel, plumbing, and water heater last replaced?
- Is there a deadline driving the sale (1031 exchange, divorce, estate, relocation)? That informs how much negotiation room exists.
- The area grade is low — what's the realistic commute time and amenity access for the typical tenant pool here? Any planned neighborhood developments (good or bad) we should know about?
- What's the average days-on-market for RENTAL listings here right now (not sales)? A rising rental-DOM trend means longer vacancies and softer asking-rent achievability than the comps imply.
- What's the recent tenant-quality profile in this submarket — average credit score on applications, eviction rate, late-payment / NSF rate, and stable-employment percentage? A property-management company in the area should have these aggregated.
- How much new for-sale + rental construction is in the pipeline within 1–3 miles? Heavy new supply typically softens prices + rents 12–24 months out; constrained supply supports both.
Investment metrics
- 1% rule
- 4.84% ✓
- Cap rate
- 43.72%
- Cash-on-cash
- 133.67%
- DSCR
- 6.95
- GRM
- 1.7
CMA / ARV
No comps found within radius.
Projected returns pro-forma
-3.0% appreciation · 3.0% rent growth · sell at horizon
- IRR
- —
- Equity multiple
- 7.52×
- Total profit
- $36,323
- Equity at exit
- $2,967
- IRR
- —
- Equity multiple
- 15.82×
- Total profit
- $82,597
- Equity at exit
- $1,721
Cash invested: $5,572 (down + closing). Projections, not guarantees.
Landlord ↔ Tenant lean methodology
- Overall (STATE)
- 46 Balanced
- State Minnesota
- 46 Balanced · D+2
- County
- — inherits STATE
- City
- — inherits STATE
ZIP-level market 56172
- Home prices YoY
- -14.9%
- Active inventory
- 43
- Price-to-rent
- 1.7×
Monthly cashflow live
- Estimated rent
- $963 medium interval (Pro) →
- Mortgage (P&I)
- −$104
- Tax from tax record
- −$27 /mo · $328/yr
- Insurance
- −$8
- HOA
- −$0
- Vacancy / Maint / Mgmt
- −$202
- Net cashflow
- $621
Break-even live
Sensitivity live
| Price | -10% $632 | -5% $626 | +0% $621 | +5% $615 | +10% $609 |
|---|---|---|---|---|---|
| Rent | -10% $545 | -5% $583 | +0% $621 | +5% $659 | +10% $697 |
| Rate | -1.0pp $631 | -0.5pp $626 | base $621 | +0.5pp $616 | +1.0pp $610 |
UW: 25.0% down · 7.5% · 30yr · 1.5% tax · 5.0% vac · 8.0% maint · 8.0% mgmt
Financing live
Cash to close
- Down payment
- $4,975
- Closing costs
- $597
- Reserves months
- —
- Total cash needed
- —
Loan-product check · same deal, 3 products live
Conventional
25% down · 7.5% · 30yr
- Down + closing
- —
- Monthly P&I
- —
- Monthly cashflow
- —
- DSCR
- —
- Eligible?
- —
Personal DTI + credit; lowest rate.
DSCR
20% down · 8.5% · 30yr
- Down + closing
- —
- Monthly P&I
- —
- Monthly cashflow
- —
- DSCR
- —
- Eligible?
- —
No personal income docs; deal must DSCR.
Hard money
10% down · 12.0% · 12mo
- Down + closing
- —
- Monthly P&I
- —
- Monthly cashflow
- —
- DSCR
- —
- Eligible?
- —
Short-term bridge; refi at stabilization.
Listing history 13 events
-
2026-06-21days on market $19,900 Active 4 DOM
-
2026-06-18days on market $19,900 Active 2 DOM
-
2026-06-17pricestatusdays on market $19,900 Active 1 DOM
-
2026-05-07status Pending
-
2026-05-07soldstatus $24,900 Sold
-
2026-04-30$24,900 Active
-
2026-04-18historical
-
2026-04-09$24,900 Active
-
2026-03-01historical
-
2025-12-26status Active
-
2025-12-24historical
-
2025-12-23$24,900
-
2023-02-16soldstatus $15,000
ⓘ Source: listings_history table (triggers on properties + properties_extension) + one-shot
backfill from property_details.listing_events for pre-trigger history.
Tax reassessment forecast MN · Partial reset (capped growth)
- Current annual tax
- $328 · $27/mo
- Projected year-2 tax
- $328 · $27/mo
- Expected delta
- $0/yr ($0/mo · 0.0%)
ⓘ Screening estimate from a state-policy table — verify with the county assessor before closing.
Nearby sold comps map
Loading sold comps map…
Walkable amenities ~0.75 mi
Loading nearby amenities…
Taxation est. · year 1
- Rental income
- $11,554
- − Mortgage interest
- −$1,115
- − Property taxes
- −$328
- − Insurance
- −$100
- − Repairs & maintenance
- −$924
- − Management
- −$924
- − Depreciation
- −$579
- Taxable income
- $7,585
- Est. tax owed @ 24.0%
- −$1,820
- After-tax cash flow
- $5,628/yr
For passive investors: Depreciation is non-cash, so a rental often shows a tax loss while cash-flowing — sheltering income. Rental losses are passive: they offset passive income freely, and up to $25,000/yr can offset ordinary (W-2) income if you actively participate and your MAGI is under $100k (phasing out to $0 by $150k); unused losses carry forward. On sale, claimed depreciation is recaptured at up to 25%, and gains may owe capital-gains tax (a 1031 exchange can defer both). Figures are a year-1 estimate at your 24.0% rate — not tax advice; consult a CPA.
Schools (NCES district)
- District
- Murray County Central School District
- NCES district ID
- 2700090
- Math proficiency
- 68% ▲ 8.00%
- Reading proficiency
- 60% ▼ -6.00%
- Median HH income
- $50,848
- Composite
- 54.52/100
- National rank
- #1344
- State rank
- #28 of 301 in MN
Livability — Slayton
- Score
- 77/100
- State rank
- #141
- US rank
- #3076
Category grades
Schools grade is shown separately in the Schools card above.
Census & demographics
- Census place
- Slayton, MN
- Population (ZIP)
- 2,954
Population outlook (Murray County) Hauer SSP2
- Today (2025)
- 7,978 people
- By 2030
- 7,715 · -3.3%
- By 2040
- 7,213 · -9.6%
- By 2050
- 6,820 · -14.5%
- By 2075
- 6,371 · -20.1%
- By 2100
- 5,729 · -28.2%
Race, ethnicity, and origin ACS 2023
- Neighborhood character
- Predominantly White (93%)
- Race & ethnicity
- White 93% Hispanic / Latino 3% Two or more races 2%
- Common ancestry
- Portuguese 18% Iranian 8% Lithuanian 2%
- Foreign-born
- 2% · Canada
- Languages at home
- 96% English-only · German/W. Germanic 2% Spanish 2%
Political lean MEDSL · Murray
- 2024 margin
- Solid R (+42.4) · D 27.9% · R 70.4% · Other 1.7%
- 2008→2024 swing
- -42.9pp toward R · 2008: 0.5pp · 2024: -42.4pp
- All cycles
- 2024: R+42.4 2020: R+39.1 2016: R+36.2 2012: R+7.2 2008: D+0.5
Not yet ingested
- Civics
- —
Market trends
- HPI YoY
- ▼ -35.54%
- Current HPI
- 202.9418
- Rent YoY
- —
- Metro
- —
- State GDP YoY
- ▲ 2.41%
- F500 in state
- 34
Industry mix (Fortune 500 HQ in MN)
| Industry | F500 HQs | Revenue |
|---|---|---|
| Healthcare | 2 | $407B |
|
||
| Retail | 2 | $150B |
|
||
| Consumer Goods | 2 | $32B |
|
||
| Industrial Machinery | 2 | $6B |
|
||
| Agriculture | 1 | $40B |
|
||
| Healthcare / Medical Devices | 1 | $32B |
|
||
Price history
+32.7% since first listed11 events — show timeline
- 2026-06-15 Listed $19,900 NORTHSTARMLS as Distributed by MLS Grid
- 2026-05-07 Pending — NORTHSTARMLS as Distributed by MLS Grid
- 2026-05-07 Sold (MLS) $24,900 NORTHSTARMLS as Distributed by MLS Grid
- 2026-04-30 Listed $24,900 NORTHSTARMLS as Distributed by MLS Grid
- 2026-04-18 Listing Removed — NORTHSTARMLS as Distributed by MLS Grid
- 2026-04-09 Listed $24,900 NORTHSTARMLS as Distributed by MLS Grid
- 2026-03-01 Listing Removed — NORTHSTARMLS as Distributed by MLS Grid
- 2025-12-26 Relisted — NORTHSTARMLS as Distributed by MLS Grid
- 2025-12-24 Listing Removed — NORTHSTARMLS as Distributed by MLS Grid
- 2025-12-23 Listed $24,900 NORTHSTARMLS as Distributed by MLS Grid
- 2023-02-16 Sold (Public Records) $15,000 Public Records
Property tax history
+1.2%/yrLatest (2026): $328 · -12.3% YoY. Source: county tax records.
Cash-flow waterfall
monthlySold comps — $/sqft
last 12 mo · ≤1 miLoading sold comps…