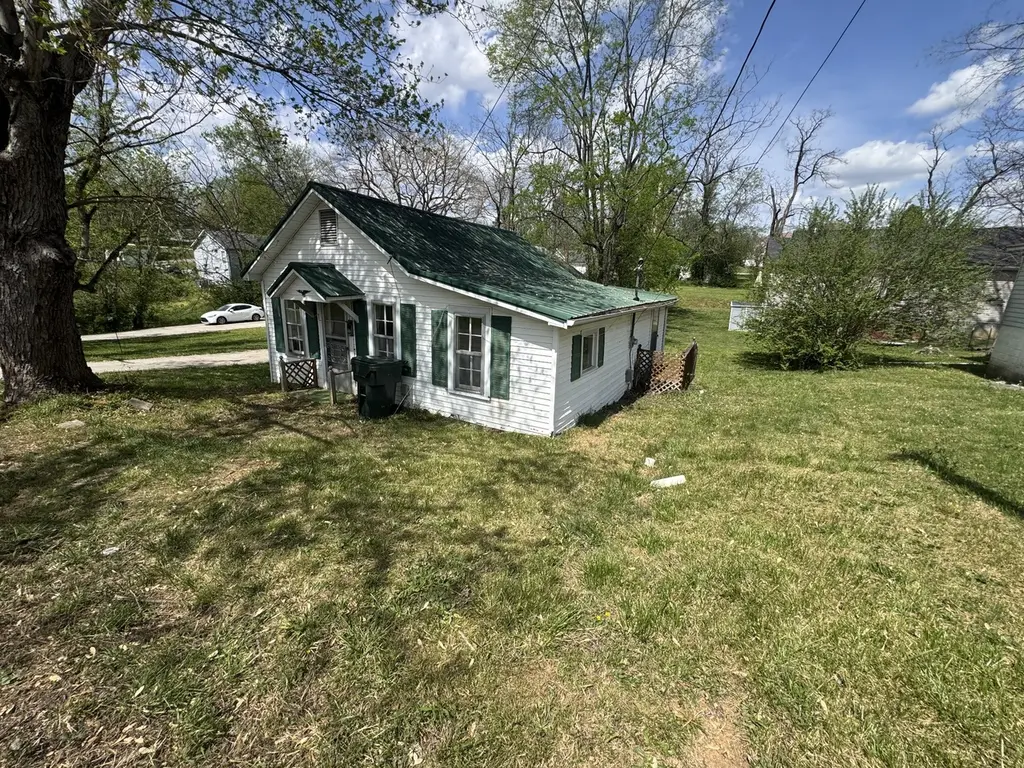
501 W Chestnut St · Dickson, TN
Flood risk 9/10 · Severe
- FEMA flood zone
- X (unshaded)
- Chance of flooding over 30 yrs
- 0.99%
- Est. flood insurance / yr
- $507 – $1,088
Fire risk 4/10 · Minor
- Est. fire insurance / yr
- $949 – $1,763
Heat risk 5/10 · Moderate
- Hot days now (above 109°F)
- 7 days/yr
- Hot days in 30 yrs
- 19 days/yr
Wind risk 4/10 · Minor
- Chance of severe wind over 30 yrs
- 10.0%
Air-quality risk 2/10 · Minimal
- Unhealthy air days now
- 0 days/yr
- Unhealthy air days in 30 yrs
- 1 days/yr
Risk factors via First Street. Map © Google.
Why this score? — see what drove the B- grade
The composite is a weighted blend of 9 inputs, each scored 0–100. Each bar is that input's sub-score; the figure is the points it added to the 100-point composite (weight × sub-score).
- Cash flow +30.0/30.0
- DSCR +10.0/10.0
- 1% rule +8.2/10.0
- ARV discount +7.5/15.0
- Livability +3.1/5.0
- Schools +2.7/10.0
- Rent growth +2.5/5.0
- Condition / age +2.5/5.0
- Appreciation +0.0/10.0
$99,000
🖨 Deal sheet 📄 Offer letter ✓ Due diligence
Listing remarks
Located Just Blocks from Downtown Dickson Makes for a Perfect Location to Remodel this Home to Your Liking. * Home in need of Full Remodel/Restoration
Key facts
- 3,049 sq ft lot
- Built 1920
- Listed 2 days
Property features AI
Finance
- Financial info: $609 annual tax (listed)
Exterior
- Parking: No covered parking; No parking spaces listed
- Utilities: Public water; Public sewer; Water service available
- Home design: Single-family residence; One level
- Construction: Frame construction; Metal roof; Built approximately (year not specified)
- Exterior features: Lot dimensions approximately 45 x 80; Lot area about 0.07 acres
Interior
- Kitchen: No appliances listed
- Bedrooms: Two bedrooms, both on the main level
- Flooring: Other
- Bathrooms: One full bathroom
- Heating & cooling: Has heating (type listed as Other); No central cooling
- Interior features: Crawl space basement; Other flooring
- Laundry & utility: No laundry appliances listed
Neighborhood map
What this means for you Summary
Snapshot
- This is a 2-bed/1.0-bath single-family listed at $99k.
Deal economics
- At list price, monthly cash flow is $353 ($4k/yr) — positive.
- The deal already cash-flows at list — no discount required.
- Meets the 1% rule at list price ($1k rent vs $99k).
- Cap rate 11.4% vs local median 2.8% in Dickson — top-decile yield for the area; either an underpriced asset or a hidden risk that comps aren't pricing in. Stress-test before assuming the spread holds.
Location & tenants
- Location reads 62/100 on livability (#219 in TN) — a middle-class / working-renter tenant base. Strengths: cost of living A+, housing A+; Watch: employment C-, crime F, amenities F.
- Dickson County (rural): math 30% / reading 33% proficiency, ranked #39 of 139 in TN (top 28%) — families likely to look elsewhere, expect single-tenant / working-renter base with shorter leases.
- Zoned schools: Dickson Elementary (math 22% / reading 32%, grade F, #496 of 952 statewide, top 55%, 242 students, 0% FRL); Dickson County High School (math 6% / reading 41%, grade F, #145 of 332 statewide, top 44%, 1,472 students, 0% FRL) — zoned schools average 0% FRL vs 45% district-wide (45 pts lower); this property's tenant base skews higher-income than the district average.
- Market conditions: 296 active listings in the ZIP; 11 comparable units currently listed for rent nearby; rentals at typical pace (median 17d on market — plan ~3-4 weeks tenant-placement turnaround); 376 units permitted in Dickson County in 2024 (5 in 5+ unit buildings).
Forward outlook
- Local home prices are declining (-3.0%/yr); year-one equity from $684 of loan paydown is wiped out by about $3k of value loss. Plan a longer hold.
- Dickson County population projected at +7% by 2050 — modest demand growth; plan on rents tracking national, not racing it.
- At projected returns (-3.0% appreciation + 3.0% rent growth), your $28k cash investment doubles in ~8 years — after that, you're playing with house money.
Negotiation context
- Only 2 days on market — expect competitive offers; lowballing is unlikely to land.
- 3 sale attempts with the ask held roughly flat each time — persistent listings suggest the price (not the market) is what's stuck; bring a comps-based counter.
- Current owner paid $5k; list at $99k implies a 1880% gain — meaningful room to come down on a strong offer.
Risks & watch-outs
- Watch-outs: flood insurance adds $66/mo; built in 1920 — expect roof / HVAC / electrical / plumbing capex.
- Climate carrying-cost: severe flood risk; extreme-heat days projected 7→19/yr by 2055 (HVAC capex compounding) — expect insurance premiums to compound above CPI over the hold.
Questions for the listing agent
- Built in 1920 — when were the roof, HVAC, electrical panel, plumbing, and water heater last replaced?
- What's the actual annual flood-insurance premium (NFIP or private), and is the property in a SFHA with mandatory coverage?
- Is there a deadline driving the sale (1031 exchange, divorce, estate, relocation)? That informs how much negotiation room exists.
- Schools are D-rated, which usually means shorter tenancies and higher turnover. Who's the typical renter profile here, and what's been the actual vacancy rate?
- Crime grade is F in this area — have there been break-ins, vandalism, or insurance claims at this property in the last 3 years? What carrier currently insures it and at what premium?
- What's the average days-on-market for RENTAL listings here right now (not sales)? A rising rental-DOM trend means longer vacancies and softer asking-rent achievability than the comps imply.
- What's the recent tenant-quality profile in this submarket — average credit score on applications, eviction rate, late-payment / NSF rate, and stable-employment percentage? A property-management company in the area should have these aggregated.
- How much new for-sale + rental construction is in the pipeline within 1–3 miles? Heavy new supply typically softens prices + rents 12–24 months out; constrained supply supports both.
Investment metrics
- 1% rule
- 1.32% ✓
- Cap rate
- 11.38%
- Cash-on-cash
- 18.16%
- DSCR
- 1.81
- GRM
- 6.3
CMA / ARV
- ARV (median comp)
- $244,570
- List price
- $99,000
- Delta
- -57.89%
- Verdict
- UNDERPRICED
- Comps
- 20 within 1.0 mi
Show comp detail 7 sales within ~0.75 mi
| Address | Dist | Beds/Ba | Sqft | Sold | Price | $/sf | Match |
|---|---|---|---|---|---|---|---|
| 103 Freeman Ave | 0.10mi | 2/1.0 | 891 (+7%) | 2mo | $245,000 | $275 | 82 |
| 805 W 2nd St | 0.35mi | 2/1.0 | 855 (+3%) | 4mo | $122,000 | $143 | 75 |
| 709 W Walnut St | 0.14mi | 2/1.0 | 720 (-14%) | 7mo | $192,000 | $267 | 65 |
| 702 W 2nd St W | 0.34mi | 2/1.0 | 900 (+8%) | 12mo | $160,000 | $178 | 61 |
| 211 Central High St | 0.67mi | 2/1.0 | 788 (-5%) | 1mo | $169,900 | $216 | 59 |
| 104 S Charlotte St | 0.28mi | 2/1.0 | 952 (+14%) | 11mo | $245,000 | $257 | 53 |
| 405 Dull St | 0.63mi | 2/1.0 | 882 (+6%) | 21mo | $249,900 | $283 | 43 |
Match score weights: distance 35% · size 25% · config 20% · recency 20%. Top-matched comps best support the ARV.
Projected returns pro-forma
-3.0% appreciation · 3.0% rent growth · sell at horizon
- IRR
- 6.0%
- Equity multiple
- 1.23×
- Total profit
- $6,461
- Equity at exit
- $14,761
- IRR
- 15.4%
- Equity multiple
- 2.25×
- Total profit
- $34,646
- Equity at exit
- $8,560
Cash invested: $27,720 (down + closing). Projections, not guarantees.
Landlord ↔ Tenant lean methodology
- Overall (STATE)
- 87 Strongly Landlord-Friendly
- State Tennessee
- 87 Strongly Landlord-Friendly · R+13
- County
- — inherits STATE
- City
- — inherits STATE
ZIP-level market 37055
- Home prices YoY
- -20.8%
- Active inventory
- 296
- Price-to-rent
- 6.3×
Monthly cashflow live
- Estimated rent
- $1,305 high interval (Pro) →
- Mortgage (P&I)
- −$519
- Tax from tax record
- −$51 /mo · $609/yr
- Insurance
- −$41
- Flood insurance flood zone
- −$66 /mo · $798/yr
- HOA
- −$0
- Vacancy / Maint / Mgmt
- −$274
- Net cashflow
- $353
Break-even live
UW: 25.0% down · 7.5% · 30yr · 1.5% tax · 5.0% vac · 8.0% maint · 8.0% mgmt
Financing live
Cash to close
- Down payment
- $24,750
- Closing costs
- $2,970
- Reserves months
- —
- Total cash needed
- —
Loan-product check · same deal, 3 products live
Conventional
25% down · 7.5% · 30yr
- Down + closing
- —
- Monthly P&I
- —
- Monthly cashflow
- —
- DSCR
- —
- Eligible?
- —
Personal DTI + credit; lowest rate.
DSCR
20% down · 8.5% · 30yr
- Down + closing
- —
- Monthly P&I
- —
- Monthly cashflow
- —
- DSCR
- —
- Eligible?
- —
No personal income docs; deal must DSCR.
Hard money
10% down · 12.0% · 12mo
- Down + closing
- —
- Monthly P&I
- —
- Monthly cashflow
- —
- DSCR
- —
- Eligible?
- —
Short-term bridge; refi at stabilization.
Rent comps 11 comps
| Address | Beds | Baths | Sqft | Rent | $/sqft | DOM | Units | Dist |
|---|---|---|---|---|---|---|---|---|
| 104 Reeves St Unit 104A Dickson, TN | 2.0 | 1.0 | 1035 | $1,300 | $1.26 | 16d | 1 | 0.42mi |
| 206 Reeves St Dickson, TN | 2.0 | 1.5 | 1100 | $1,495 | $1.36 | 43d | 1 | 0.58mi |
| 213 E Walnut St Unit C Dickson, TN | 2.0 | 1.0 | 875 | $975 | $1.11 | 23d | 1 | 0.60mi |
| 301 E Walnut St Dickson, TN | 3.0 | 1.0 | 600 | $1,193 | $1.99 | 1d | 2 | 0.64mi |
| 201 Sylvis St Apt 7 Dickson, TN | 2.0 | 1.0 | 800 | $1,350 | $1.69 | 23d | 1 | 0.76mi |
| 300 Spring St Unit 8 Dickson, TN | 2.0 | 1.5 | 949 | $1,199 | $1.26 | 17d | 1 | 0.91mi |
| 112 Miller St Unit B Dickson, TN | 3.0 | 2.0 | 960 | $1,500 | $1.56 | 4d | 1 | 0.95mi |
| 405 Spring St Dickson, TN | 1.0–2.0 | 1.0–1.5 | 675 | $999 | $1.48 | 1d | 1 | 1.08mi |
| 150 Autumn Way Dickson, TN | 1.0–3.0 | 1.0–2.0 | 1085 | $1,574 | $1.45 | 1d | 9 | 1.11mi |
| 108 Blurton Dr Unit 207 Dickson, TN | 1.0 | 1.0 | 622 | $1,050 | $1.69 | 23d | 1 | 1.20mi |
| 118 Saw Mill Rd Unit B Dickson, TN | 2.0 | 1.5 | 1000 | $1,550 | $1.55 | 23d | 1 | 1.40mi |
Listing history 11 events
-
2026-06-18days on market $99,000 Active 2 DOM
-
2026-06-17pricedays on market $99,000 Active 1 DOM
-
2026-06-03days on market $103,000 Active 60 DOM
-
2026-06-02days on market $103,000 Active 59 DOM
-
2026-06-01days on market $103,000 Active 58 DOM
-
2026-05-31days on market $103,000 Active 57 DOM
-
2026-05-15status Active 150-char remark
-
2026-05-08historical Active Under Contract 150-char remark
-
2026-04-21price $108,900 150-char remark
-
2026-04-04$113,900 Active 150-char remark
-
1988-11-22soldstatus $5,000
ⓘ Source: listings_history table (triggers on properties + properties_extension) + one-shot
backfill from property_details.listing_events for pre-trigger history.
Tax reassessment forecast TN · Resets to sale price
- Current annual tax
- $609 · $51/mo
- Projected year-2 tax
- $703 · $59/mo
- Expected delta
- +$94/yr (+$8/mo · 15.4%)
ⓘ Screening estimate from a state-policy table — verify with the county assessor before closing.
Climate risk First Street
- Flood 9/10 Extreme FEMA zone X (unshaded) · 99% chance over 30 yrs
- Wildfire 4/10 Moderate
- Heat 5/10 Major 7 d/yr ≥109°F today · 19 d/yr by 30 yrs out
- Wind 4/10 Moderate 10% chance of damaging wind over 30 yrs
- Air quality 2/10 Low 0 unhealthy d/yr today · 1 by 30 yrs out
Nearby sold comps map
Loading sold comps map…
Walkable amenities ~0.75 mi
Loading nearby amenities…
Taxation est. · year 1
- Rental income
- $15,656
- − Mortgage interest
- −$5,546
- − Property taxes
- −$609
- − Insurance
- −$1,292
- − Repairs & maintenance
- −$1,252
- − Management
- −$1,252
- − Depreciation
- −$2,880
- Taxable income
- $2,824
- Est. tax owed @ 24.0%
- −$678
- After-tax cash flow
- $3,559/yr
For passive investors: Depreciation is non-cash, so a rental often shows a tax loss while cash-flowing — sheltering income. Rental losses are passive: they offset passive income freely, and up to $25,000/yr can offset ordinary (W-2) income if you actively participate and your MAGI is under $100k (phasing out to $0 by $150k); unused losses carry forward. On sale, claimed depreciation is recaptured at up to 25%, and gains may owe capital-gains tax (a 1031 exchange can defer both). Figures are a year-1 estimate at your 24.0% rate — not tax advice; consult a CPA.
Schools (NCES district)
- District
- Dickson County
- NCES district ID
- 4701020
- Math proficiency
- 30% ▼ -15.00%
- Reading proficiency
- 33% ▼ -6.00%
- Median HH income
- $45,458
- Composite
- 27.01/100
- National rank
- #7064
- State rank
- #39 of 139 in TN
Livability — Dickson
- Score
- 62/100
- State rank
- #219
- US rank
- #16541
Category grades
Schools grade is shown separately in the Schools card above.
Census & demographics
- Census place
- Dickson, TN
- County
- Dickson County · 29,035 people
- City population
- 29,035
- Metro
- Nashville-Davidson--Murfreesboro--Franklin, TN
- Population (ZIP)
- 29,035
- Household income
- $69,821
- Rent vs Own
- Severe rent burden
- 394.0
Population outlook (Dickson County) Hauer SSP2
- Today (2025)
- 55,013 people
- By 2030
- 56,448 · +2.6%
- By 2040
- 58,508 · +6.4%
- By 2050
- 59,076 · +7.4%
- By 2075
- 58,343 · +6.1%
- By 2100
- 52,900 · -3.8%
Race, ethnicity, and origin ACS 2023
- Neighborhood character
- Predominantly White (84%)
- Race & ethnicity
- White 84% Hispanic / Latino 6% Black 5% Two or more races 5%
- Hispanic origin (detail)
- Mexican 4%
- Common ancestry
- Italian 8% Slovak 3% Romanian 2%
- Foreign-born
- 3% · Canada
- Languages at home
- 97% English-only · Spanish 3%
Political lean MEDSL · Dickson
- 2024 margin
- Solid R (+51.9) · D 23.5% · R 75.4% · Other 1.1%
- 2008→2024 swing
- -30.6pp toward R · 2008: -21.4pp · 2024: -51.9pp
- All cycles
- 2024: R+51.9 2020: R+47.4 2016: R+45.6 2012: R+28.4 2008: R+21.4
Not yet ingested
- Civics
- —
Market trends
- HPI YoY
- ▼ -79.59%
- Current HPI
- 303.5997
- Rent YoY
- —
- Metro
- Nashville-Davidson--Murfreesboro--Franklin, TN
- State GDP YoY
- ▲ 2.78%
- F500 in state
- 22
Industry mix (Fortune 500 HQ in TN)
| Industry | F500 HQs | Revenue |
|---|---|---|
| Healthcare | 3 | $91B |
|
||
| Retail | 3 | $72B |
|
||
| Transportation / Logistics | 1 | $88B |
|
||
| Paper / Packaging | 1 | $19B |
|
||
| Insurance | 1 | $13B |
|
||
| Energy | 1 | $12B |
|
||
Price history
+1880.0% since first listed8 events — show timeline
- 2026-06-16 Listed $99,000 REALTRACS as Distributed by MLS Grid
- 2026-06-03 Listing Removed — REALTRACS as Distributed by MLS Grid
- 2026-05-22 Price Changed $103,000 REALTRACS as Distributed by MLS Grid
- 2026-05-15 Relisted — REALTRACS as Distributed by MLS Grid
- 2026-05-08 Contingent — REALTRACS as Distributed by MLS Grid
- 2026-04-21 Price Changed $108,900 REALTRACS as Distributed by MLS Grid
- 2026-04-04 Listed $113,900 REALTRACS as Distributed by MLS Grid
- 1988-11-22 Sold (Public Records) $5,000 Public Records
Property tax history
+6.6%/yrLatest (2025): $609 · +0.0% YoY. Source: county tax records.
Cash-flow waterfall
monthlySold comps — $/sqft
last 12 mo · ≤1 miLoading sold comps…