 🏷️ Likely Rental
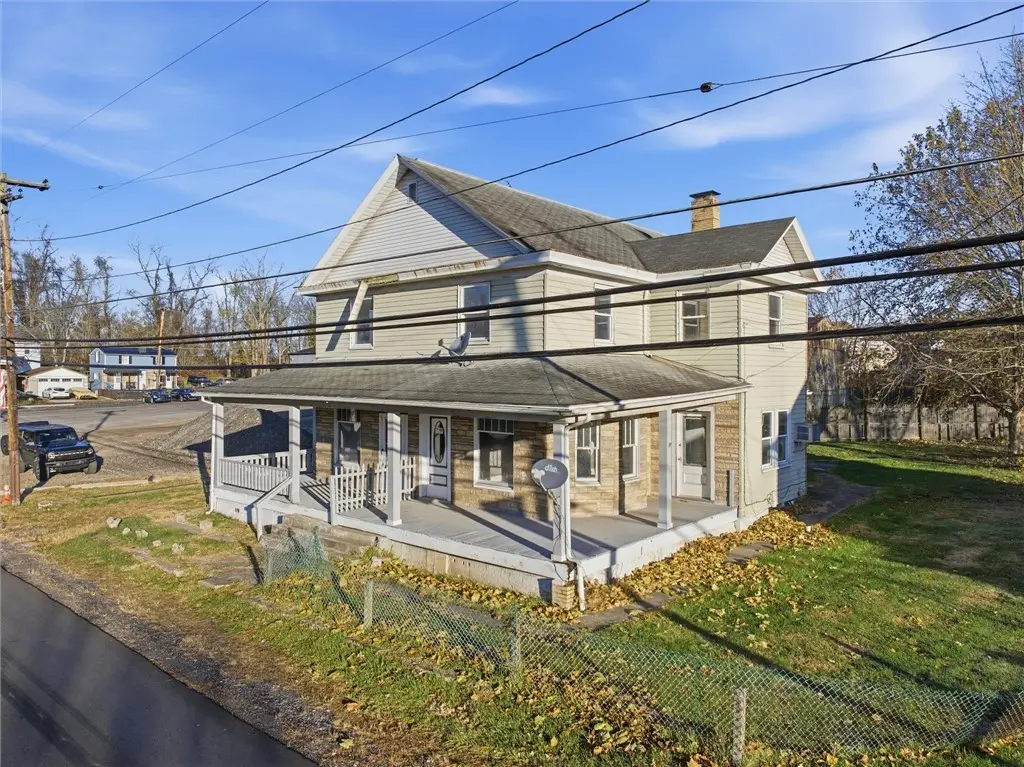
201 Filbert Orient Rd · Redstone, PA
Flood risk 1/10 · Minimal
- FEMA flood zone
- X (unshaded)
- Chance of flooding over 30 yrs
- 0.0%
- Est. flood insurance / yr
- $473 – $860
Fire risk 1/10 · Minimal
- Est. fire insurance / yr
- $511 – $949
Heat risk 4/10 · Minor
- Hot days now (above 97°F)
- 7 days/yr
- Hot days in 30 yrs
- 19 days/yr
Wind risk 2/10 · Minimal
- Chance of severe wind over 30 yrs
- —
Air-quality risk 2/10 · Minimal
- Unhealthy air days now
- 1 days/yr
- Unhealthy air days in 30 yrs
- 2 days/yr
Risk factors via First Street. Map © Google.
Why this score? — see what drove the B grade
The composite is a weighted blend of 9 inputs, each scored 0–100. Each bar is that input's sub-score; the figure is the points it added to the 100-point composite (weight × sub-score).
- Cash flow +30.0/30.0
- 1% rule +10.0/10.0
- DSCR +10.0/10.0
- ARV discount +7.5/15.0
- Appreciation +5.2/10.0
- Rent growth +2.5/5.0
- Livability +2.5/5.0
- Condition / age +2.5/5.0
- Schools +2.1/10.0
$45,000
🖨 Deal sheet 📄 Offer letter ✓ Due diligence
Multi-family units
County records classify this as Multi-Family (2-4 Unit). Listing-text estimate: 1 unit. estimate disagrees with records
Listing remarks MLS
Investment property! Both of the duplex sides are being sold together. 199 is vacant and was recently painted. New carpeting throughout. 201 is currently rented and tenant occupied. Great opportunity! Live in one side and rent the other, just needs some TLC!
Key facts
- Fresh interior paint
- Detached garage
- 0.24 acre lot
Tags
Property features AI
Exterior
- Parking: Detached garage
- Utilities: Public water; Public sewer
- Home design: 2-story home
- Construction: Aluminum siding; Vinyl siding; Asphalt roof
- Exterior features: Lot dimensions approximately 101' x 124' x 164' x 61'; Lot area about 0.24 acres; Resale property
Interior
- Flooring: Carpet
- Bathrooms: 1 full bathroom
- Heating & cooling: Gas heating; Hot water heating; Heating present
- Interior features: Basement present; Carpet flooring
Neighborhood map
What this means for you Summary
Snapshot
- This is a 1-bed/1.0-bath multifamily listed at $45k.
Deal economics
- At list price, monthly cash flow is $425 ($5k/yr) — positive.
- The deal already cash-flows at list — no discount required.
- Meets the 1% rule at list price ($949 rent vs $45k).
- Recommended offer: $44k (3.0% below list) — sets the bar for market timing.
Location & tenants
- Location reads: area grade B — affects rentability + tenant quality, not the cash-flow math above.
- Brownsville Area SD (rural): math 17% / reading 34% proficiency, ranked #472 of 539 in PA (top 88%) — low school quality limits family demand, transient renter base, plan for 1-2y turnover.
- Market conditions: 15 active listings in the ZIP; 201 units permitted in Fayette County in 2024 (10 in 5+ unit buildings).
Forward outlook
- In year one you build about $519 of equity ($311 loan paydown + $208 appreciation (0.5% local appreciation)).
- Fayette County population projected at -19% by 2050 — secular population decline; favor cash flow + early exit over multi-decade hold.
- At projected returns (0.5% appreciation + 3.0% rent growth), your $13k cash investment doubles in ~3 years — after that, you're playing with house money.
Negotiation context
- It's been on market 51 days — a 3% lower offer ($44k) is reasonable based on typical stale-listing flexibility.
- 2 sale attempts since 4y ago; this cycle's ask has dropped $15k (25%) from the opening price — seller is motivated, your offer sets the floor, not the list.
- Current owner paid $20k; list at $45k implies a 125% gain — meaningful room to come down on a strong offer.
Risks & watch-outs
- Watch-outs: built in 1940 — expect roof / HVAC / electrical / plumbing capex.
Questions for the listing agent
- It's been on market 51 days. Have you received any prior offers? Is the seller open to a 3% concession, seller financing, or rate buy-down credit?
- Built in 1940 — when were the roof, HVAC, electrical panel, plumbing, and water heater last replaced?
- Is there a deadline driving the sale (1031 exchange, divorce, estate, relocation)? That informs how much negotiation room exists.
- What's the average days-on-market for RENTAL listings here right now (not sales)? A rising rental-DOM trend means longer vacancies and softer asking-rent achievability than the comps imply.
- What's the recent tenant-quality profile in this submarket — average credit score on applications, eviction rate, late-payment / NSF rate, and stable-employment percentage? A property-management company in the area should have these aggregated.
- How much new apartment / multifamily construction is in the pipeline within 1–3 miles? Heavy new supply (>2% of stock underway) typically softens rents 12–24 months out; light construction supports rent growth.
Investment metrics
- 1% rule
- 2.11% ✓
- Cap rate
- 17.62%
- Cash-on-cash
- 40.46%
- DSCR
- 2.80
- GRM
- 4.0
CMA / ARV
- ARV (median comp)
- $125,118
- List price
- $45,000
- Delta
- -64.03%
- Verdict
- UNDERPRICED
- Comps
- 20 within 1.0 mi
Projected returns pro-forma
0.46% appreciation · 3.0% rent growth · sell at horizon
- IRR
- 42.2%
- Equity multiple
- 3.12×
- Total profit
- $26,752
- Equity at exit
- $14,116
- IRR
- 44.7%
- Equity multiple
- 6.18×
- Total profit
- $65,271
- Equity at exit
- $17,829
Cash invested: $12,600 (down + closing). Projections, not guarantees.
Landlord ↔ Tenant lean methodology
- Overall (STATE)
- 62 Landlord-Friendly
- State Pennsylvania
- 62 Landlord-Friendly · EVEN
- County
- — inherits STATE
- City
- — inherits STATE
ZIP-level market 15468
- Home prices YoY
- 0.3%
- Active inventory
- 15
- Price-to-rent
- 4.0×
Monthly cashflow live
- Estimated rent
- $949 medium interval (Pro) →
- Mortgage (P&I)
- −$236
- Tax from tax record
- −$70 /mo · $837/yr
- Insurance
- −$19
- HOA
- −$0
- Vacancy / Maint / Mgmt
- −$199
- Net cashflow
- $425
Break-even live
UW: 25.0% down · 7.5% · 30yr · 1.5% tax · 5.0% vac · 8.0% maint · 8.0% mgmt
Financing live
Cash to close
- Down payment
- $11,250
- Closing costs
- $1,350
- Reserves months
- —
- Total cash needed
- —
Loan-product check · same deal, 3 products live
Conventional
25% down · 7.5% · 30yr
- Down + closing
- —
- Monthly P&I
- —
- Monthly cashflow
- —
- DSCR
- —
- Eligible?
- —
Personal DTI + credit; lowest rate.
DSCR
20% down · 8.5% · 30yr
- Down + closing
- —
- Monthly P&I
- —
- Monthly cashflow
- —
- DSCR
- —
- Eligible?
- —
No personal income docs; deal must DSCR.
Hard money
10% down · 12.0% · 12mo
- Down + closing
- —
- Monthly P&I
- —
- Monthly cashflow
- —
- DSCR
- —
- Eligible?
- —
Short-term bridge; refi at stabilization.
Listing history 19 events
-
2026-06-18days on market $45,000 Active 51 DOM
-
2026-06-17days on market $45,000 Active 50 DOM
-
2026-06-16days on market $45,000 Active 49 DOM
-
2026-06-16price $45,000 Active 48 DOM
-
2026-06-15days on market $60,000 Active 48 DOM
-
2026-06-13days on market $60,000 Active 46 DOM
-
2026-06-12days on market $60,000 Active 45 DOM
-
2026-06-09days on market $60,000 Active 42 DOM
-
2026-06-08days on market $60,000 Active 41 DOM
-
2026-06-08days on market $60,000 Active 40 DOM
-
2026-06-04days on market $60,000 Active 36 DOM
-
2026-06-02days on market $60,000 Active 35 DOM
-
2026-06-01days on market $60,000 Active 34 DOM
-
2026-05-31days on market $60,000 Active 33 DOM
-
2026-04-27$60,000 Active 261-char remark
-
2023-08-03historical Expired 258-char remark
Show marketing remark (258 chars)
Investment property! Both of the duplex sides are being sold together. 199 is vacant and was recently painted. New carpeting throughout. 201 is currently rented and tenant occupied. Great opportunity! Live in one side and rent the other, just needs some TLC!
-
2022-10-19price $79,900 258-char remark
Show marketing remark (258 chars)
Investment property! Both of the duplex sides are being sold together. 199 is vacant and was recently painted. New carpeting throughout. 201 is currently rented and tenant occupied. Great opportunity! Live in one side and rent the other, just needs some TLC!
-
2022-08-03$84,900 Active 258-char remark
Show marketing remark (258 chars)
Investment property! Both of the duplex sides are being sold together. 199 is vacant and was recently painted. New carpeting throughout. 201 is currently rented and tenant occupied. Great opportunity! Live in one side and rent the other, just needs some TLC!
-
2001-07-02soldstatus $20,000
ⓘ Source: listings_history table (triggers on properties + properties_extension) + one-shot
backfill from property_details.listing_events for pre-trigger history.
Tax reassessment forecast PA · Partial reset (capped growth)
- Current annual tax
- $837 · $70/mo
- Projected year-2 tax
- $837 · $70/mo
- Expected delta
- $0/yr ($0/mo · 0.0%)
ⓘ Screening estimate from a state-policy table — verify with the county assessor before closing.
Climate risk First Street
- Flood 1/10 Low FEMA zone X (unshaded) · 0% chance over 30 yrs
- Wildfire 1/10 Low
- Heat 4/10 Moderate 7 d/yr ≥97°F today · 19 d/yr by 30 yrs out
- Wind 2/10 Low
- Air quality 2/10 Low 1 unhealthy d/yr today · 2 by 30 yrs out
Nearby sold comps map
Loading sold comps map…
Walkable amenities ~0.75 mi
Loading nearby amenities…
Taxation est. · year 1
- Rental income
- $11,382
- − Mortgage interest
- −$2,521
- − Property taxes
- −$837
- − Insurance
- −$225
- − Repairs & maintenance
- −$911
- − Management
- −$911
- − Depreciation
- −$1,309
- Taxable income
- $4,670
- Est. tax owed @ 24.0%
- −$1,121
- After-tax cash flow
- $3,978/yr
For passive investors: Depreciation is non-cash, so a rental often shows a tax loss while cash-flowing — sheltering income. Rental losses are passive: they offset passive income freely, and up to $25,000/yr can offset ordinary (W-2) income if you actively participate and your MAGI is under $100k (phasing out to $0 by $150k); unused losses carry forward. On sale, claimed depreciation is recaptured at up to 25%, and gains may owe capital-gains tax (a 1031 exchange can defer both). Figures are a year-1 estimate at your 24.0% rate — not tax advice; consult a CPA.
Schools (NCES district)
- District
- Brownsville Area SD
- NCES district ID
- 4204080
- Math proficiency
- 17% ▼ -3.00%
- Reading proficiency
- 34% ▼ -5.00%
- Median HH income
- $34,500
- Composite
- 20.93/100
- National rank
- #8481
- State rank
- #472 of 539 in PA
Livability — Redstone
No livability data for this city. (Only ~50 U.S. cities are tracked.)
Census & demographics
- Population (ZIP)
- 2,230
Population outlook (Fayette County) Hauer SSP2
- Today (2025)
- 127,561 people
- By 2030
- 123,206 · -3.4%
- By 2040
- 113,232 · -11.2%
- By 2050
- 103,468 · -18.9%
- By 2075
- 83,185 · -34.8%
- By 2100
- 62,384 · -51.1%
Race, ethnicity, and origin ACS 2023
- Neighborhood character
- Predominantly White (88%)
- Race & ethnicity
- White 88% Two or more races 9% Hispanic / Latino 2%
- Common ancestry
- Romanian 13% Lithuanian 9% Italian 4%
- Foreign-born
- 1% · Canada
- Languages at home
- 99% English-only · Spanish 1%
Political lean MEDSL · Fayette
- 2024 margin
- Solid R (+37.9) · D 30.8% · R 68.7%
- 2008→2024 swing
- -37.5pp toward R · 2008: -0.4pp · 2024: -37.9pp
- All cycles
- 2024: R+37.9 2020: R+33.5 2016: R+31.0 2012: R+8.3 2008: R+0.4
Not yet ingested
- Civics
- —
Market trends
- HPI YoY
- ▲ 0.46%
- Current HPI
- 135.7723
- Rent YoY
- —
- Metro
- —
- State GDP YoY
- ▲ 1.68%
- F500 in state
- 34
Industry mix (Fortune 500 HQ in PA)
| Industry | F500 HQs | Revenue |
|---|---|---|
| Healthcare | 2 | $309B |
|
||
| Insurance | 2 | $27B |
|
||
| Telecommunications / Media | 1 | $124B |
|
||
| Industrial Distribution | 1 | $22B |
|
||
| Financial Services | 1 | $20B |
|
||
| Chemicals / Materials | 1 | $18B |
|
||
Price history
+125.0% since first listed6 events — show timeline
- 2026-06-15 Price Changed $45,000 West Penn MLS
- 2026-04-27 Listed $60,000 West Penn MLS
- 2023-08-03 Delisted — West Penn MLS
- 2022-10-19 Price Changed $79,900 West Penn MLS
- 2022-08-03 Listed $84,900 West Penn MLS
- 2001-07-02 Sold (Public Records) $20,000 Public Records
Property tax history
+2.6%/yrLatest (2026): $837 · +0.0% YoY. Source: county tax records.
Cash-flow waterfall
monthlySold comps — $/sqft
last 12 mo · ≤1 miLoading sold comps…