22202 Maplewood Dr · Houston, TX
Flood risk 5/10 · Moderate
- FEMA flood zone
- X (unshaded)
- Chance of flooding over 30 yrs
- 0.65%
- Est. flood insurance / yr
- $507 – $1,088
Fire risk 2/10 · Minimal
- Est. fire insurance / yr
- $1,222 – $2,270
Heat risk 9/10 · Severe
- Hot days now (above 110°F)
- 7 days/yr
- Hot days in 30 yrs
- 22 days/yr
Wind risk 9/10 · Severe
- Chance of severe wind over 30 yrs
- 99.0%
Air-quality risk 2/10 · Minimal
- Unhealthy air days now
- 1 days/yr
- Unhealthy air days in 30 yrs
- 1 days/yr
Risk factors via First Street. Map © Google.
Why this score? — see what drove the C grade
The composite is a weighted blend of 9 inputs, each scored 0–100. Each bar is that input's sub-score; the figure is the points it added to the 100-point composite (weight × sub-score).
- Cash flow +17.2/30.0
- ARV discount +11.1/15.0
- Schools +5.7/10.0
- DSCR +5.4/10.0
- Appreciation +4.4/10.0
- 1% rule +4.2/10.0
- Livability +3.7/5.0
- Condition / age +2.5/5.0
- Rent growth +1.8/5.0
$264,000
🖨 Deal sheet (PDF) 📄 Offer letter ✓ Due diligence
Listing remarks MLS
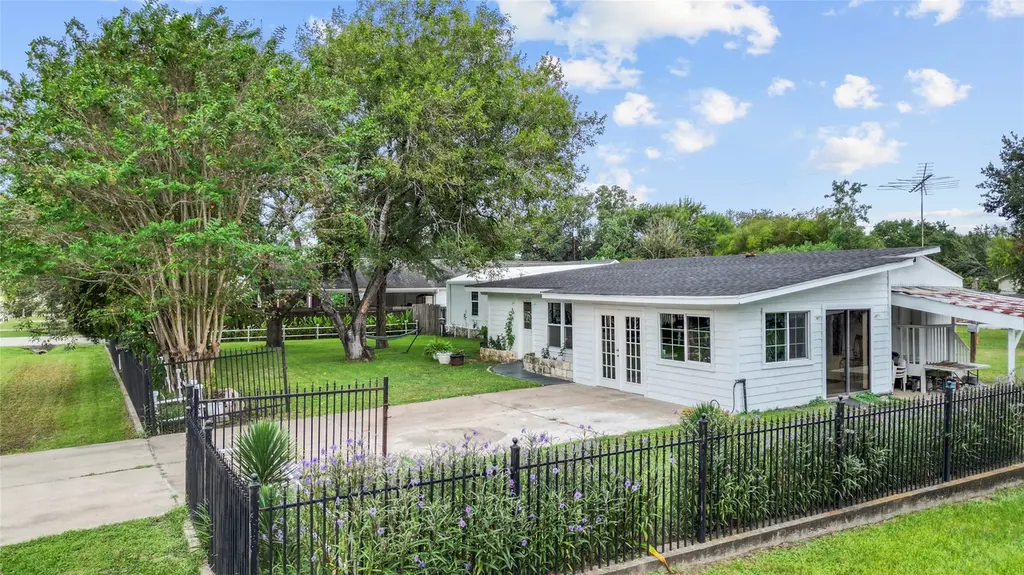
Discover a prime opportunity along Grand Parkway 99, one of the fastest-growing corridors in the Houston area. This beautifully remodeled property combines modern updates with a peaceful country-style setting while remaining minutes from major highways, shopping, dining, and new developments. Situated on a spacious, private lot surrounded by mature trees, the home offers a serene outdoor environment with a bright, welcoming feel. Large windows and French doors allow abundant natural light and create a seamless connection to the outdoor patio area—perfect for entertaining or relaxing. The expansive yard provides excellent flexibility for outdoor living, future expansion, or value-add improvements. The property is fully fenced, offering privacy and security while maintaining its tranquil atmosphere. Located directly along the highly desirable Grand Parkway 99 corridor, this property sits in the path of rapid commercial and residential growth.
Key facts
- Private lot
- Fully fenced
- Expansive yard
Tags
Neighborhood map
What this means for you Summary
Snapshot
- This is a 3-bed/2.0-bath manufactured listed at $264k.
Deal economics
- At list price, monthly cash flow is $188 ($2k/yr) — positive.
- The deal already cash-flows at list — no discount required.
- To meet the 1% rule (rent ≥ 1% of price), the offer needs to be $242k (8.2% below list).
- Recommended offer: $240k (9.0% below list) — sets the bar for market timing.
- Cap rate 7.1% vs local median 3.2% in Houston — top-decile yield for the area; either an underpriced asset or a hidden risk that comps aren't pricing in. Stress-test before assuming the spread holds.
Location & tenants
- Location reads 74/100 on livability (#184 in TX, #4,771 nationally) — a middle-class / working-renter tenant base. Strengths: amenities A+, cost of living A+, housing A+; Watch: schools D, crime F.
- Katy ISD (suburban): math 61% / reading 63% proficiency, ranked #29 of 826 in TX (top 4%) — acceptable for families but not a draw, mixed tenant base, ~2y average lease.
- Market conditions: Rents soft (-2.9%/yr); 744 active listings in the ZIP; 39 comparable units currently listed for rent nearby; rentals at typical pace (median 18d on market — plan ~3-4 weeks tenant-placement turnaround); solid renter incomes; 29,883 units permitted in Harris County in 2024 (8,621 in 5+ unit buildings).
- This rent runs 33% of the median local income ($88k/yr) — at the standard rent-burdened threshold; future hikes will face affordability resistance.
Forward outlook
- Local home prices are declining (-1.3%/yr); year-one equity from $2k of loan paydown is wiped out by about $3k of value loss. Plan a longer hold.
- Harris County population projected at +47% by 2050 — long-run rental-demand tailwind backs the buy-and-hold thesis.
Negotiation context
- It's been on market 103 days — a 9% lower offer ($240k) is reasonable based on typical stale-listing flexibility.
- 5 sale attempts since 12y ago with the ask held roughly flat each time — persistent listings suggest the price (not the market) is what's stuck; bring a comps-based counter.
Risks & watch-outs
- Climate carrying-cost: moderate flood risk; severe wind risk, 99% chance of damaging wind over 30y; extreme-heat days projected 7→22/yr by 2055 (HVAC capex compounding) — expect insurance premiums to compound above CPI over the hold.
Questions for the listing agent
- It's been on market 103 days. Have you received any prior offers? Is the seller open to a 9% concession, seller financing, or rate buy-down credit?
- What does the HOA fee cover, when was the last increase, and are there any pending special assessments or reserve-fund shortfalls?
- Why hasn't it sold? Are there any deal-killer items the seller is aware of (foundation, flood, title, zoning, code violations)?
- Is there a deadline driving the sale (1031 exchange, divorce, estate, relocation)? That informs how much negotiation room exists.
- Schools are D-rated, which usually means shorter tenancies and higher turnover. Who's the typical renter profile here, and what's been the actual vacancy rate?
- Crime grade is F in this area — have there been break-ins, vandalism, or insurance claims at this property in the last 3 years? What carrier currently insures it and at what premium?
- What's the average days-on-market for RENTAL listings here right now (not sales)? A rising rental-DOM trend means longer vacancies and softer asking-rent achievability than the comps imply.
- What's the recent tenant-quality profile in this submarket — average credit score on applications, eviction rate, late-payment / NSF rate, and stable-employment percentage? A property-management company in the area should have these aggregated.
- How much new for-sale + rental construction is in the pipeline within 1–3 miles? Heavy new supply typically softens prices + rents 12–24 months out; constrained supply supports both.
Investment metrics
- 1% rule
- 0.92% ✗
- Cap rate
- 7.15%
- Cash-on-cash
- 3.06%
- DSCR
- 1.14
- GRM
- 9.1
CMA / ARV
- ARV (median comp)
- $287,283
- List price
- $264,000
- Delta
- -8.10%
- Verdict
- FAIR
- Comps
- 2 within 2.0 mi
Projected returns pro-forma
-1.27% appreciation · 0.0% rent growth · sell at horizon
- IRR
- -5.9%
- Equity multiple
- 0.75×
- Total profit
- $-18,224
- Equity at exit
- $60,311
- IRR
- -1.6%
- Equity multiple
- 0.87×
- Total profit
- $-9,732
- Equity at exit
- $60,466
Cash invested: $73,920 (down + closing). Projections, not guarantees.
Landlord ↔ Tenant lean methodology
- Overall (STATE)
- 87 Strongly Landlord-Friendly
- State Texas
- 87 Strongly Landlord-Friendly · R+5
- County
- — inherits STATE
- City
- — inherits STATE
ZIP-level market 77449
- Home prices YoY
- -0.5%
- Rents YoY
- -2.9%
- Active inventory
- 744
- Price-to-rent
- 9.1×
Monthly cashflow live
- Estimated rent
- $2,422 high interval (Pro) →
- Mortgage (P&I)
- −$1,384
- Tax from tax record
- −$191 /mo · $2,293/yr
- Insurance
- −$110
- HOA
- −$40
- Vacancy / Maint / Mgmt
- −$509
- Net cashflow
- $188
Break-even live
Sensitivity live
| Price | -10% $338 | -5% $263 | +0% $188 | +5% $113 | +10% $39 |
|---|---|---|---|---|---|
| Rent | -10% $-3 | -5% $93 | +0% $188 | +5% $284 | +10% $380 |
| Rate | -1.0pp $321 | -0.5pp $255 | base $188 | +0.5pp $120 | +1.0pp $50 |
UW: 25.0% down · 7.5% · 30yr · 1.5% tax · 5.0% vac · 8.0% maint · 8.0% mgmt
Financing live
Cash to close
- Down payment
- $66,000
- Closing costs
- $7,920
- Reserves months
- —
- Total cash needed
- —
Loan-product check · same deal, 3 products live
Conventional
25% down · 7.5% · 30yr
- Down + closing
- —
- Monthly P&I
- —
- Monthly cashflow
- —
- DSCR
- —
- Eligible?
- —
Personal DTI + credit; lowest rate.
DSCR
20% down · 8.5% · 30yr
- Down + closing
- —
- Monthly P&I
- —
- Monthly cashflow
- —
- DSCR
- —
- Eligible?
- —
No personal income docs; deal must DSCR.
Hard money
10% down · 12.0% · 12mo
- Down + closing
- —
- Monthly P&I
- —
- Monthly cashflow
- —
- DSCR
- —
- Eligible?
- —
Short-term bridge; refi at stabilization.
Rent comps 39 comps
| Address | Beds | Baths | Sqft | Rent | $/sqft | DOM | Units | Dist |
|---|---|---|---|---|---|---|---|---|
| 22614 Terrazzo Dr Katy, TX | 4.0 | 3.0 | 1873 | $2,539 | $1.36 | 13d | 1 | 0.84mi |
| 22616 Terrazzo Dr Katy, TX | 4.0 | 3.0 | 1865 | $2,539 | $1.36 | 15d | 1 | 0.84mi |
| 22622 Terrazzo Dr Katy, TX | 4.0 | 3.0 | 1873 | $2,569 | $1.37 | 44d | 1 | 0.87mi |
| 22628 Terrazzo Dr Katy, TX | 4.0 | 2.5 | 2017 | $2,659 | $1.32 | 15d | 1 | 0.87mi |
| 22624 Terrazzo Dr Katy, TX | 4.0 | 3.0 | 1865 | $2,569 | $1.38 | 44d | 1 | 0.87mi |
| 22712 Terrazzo Dr Katy, TX | 3.0 | 2.5 | 1464 | $2,179 | $1.49 | 24d | 1 | 0.88mi |
| 22626 Terrazzo Dr Katy, TX | 4.0 | 2.5 | 2004 | $2,699 | $1.35 | 44d | 1 | 0.88mi |
| 22728 Terrazzo Dr Katy, TX | 3.0 | 2.5 | 1667 | $2,369 | $1.42 | 24d | 1 | 0.89mi |
| 22716 Terrazzo Dr Katy, TX | 4.0 | 3.0 | 1865 | $2,439 | $1.31 | 5d | 1 | 0.89mi |
| 22718 Terrazzo Dr Katy, TX | 4.0 | 3.0 | 1873 | $2,439 | $1.30 | 5d | 1 | 0.90mi |
| 22617 Terrazzo Dr Katy, TX | 3.0 | 2.5 | 1464 | $2,279 | $1.56 | 44d | 1 | 0.90mi |
| 22720 Terrazzo Dr Katy, TX | 4.0 | 2.5 | 2004 | $2,559 | $1.28 | 18d | 1 | 0.91mi |
| 22615 Terrazzo Dr Katy, TX | 4.0 | 3.0 | 1865 | $2,569 | $1.38 | 44d | 1 | 0.91mi |
| 22722 Terrazzo Dr Katy, TX | 4.0 | 2.5 | 2017 | $2,559 | $1.27 | 17d | 1 | 0.91mi |
| 22738 Terrazzo Dr Katy, TX | 4.0 | 3.0 | 1873 | $2,539 | $1.36 | 20d | 1 | 0.91mi |
| 22613 Terrazzo Dr Katy, TX | 4.0 | 3.0 | 1873 | $2,569 | $1.37 | 44d | 1 | 0.91mi |
| 22611 Terrazzo Dr Katy, TX | 4.0 | 3.0 | 1865 | $2,569 | $1.38 | 44d | 1 | 0.92mi |
| 22717 Terrazzo Dr Katy, TX | 4.0 | 2.5 | 2017 | $2,629 | $1.30 | 5d | 1 | 0.92mi |
| 22627 Terrazzo Dr Katy, TX | 3.0 | 2.5 | 1464 | $2,239 | $1.53 | 5d | 1 | 0.93mi |
| 22629 Terrazzo Dr Katy, TX | 3.0 | 2.5 | 1464 | $2,239 | $1.53 | 5d | 1 | 0.93mi |
| 22719 Terrazzo Dr Katy, TX | 4.0 | 2.5 | 2004 | $2,559 | $1.28 | 18d | 1 | 0.93mi |
| 22824 Frassino Pl Katy, TX | 4.0 | 2.5 | 2017 | $2,629 | $1.30 | 2d | 1 | 0.94mi |
| 22713 Terrazzo Dr Katy, TX | 3.0 | 2.5 | 1667 | $2,419 | $1.45 | 13d | 1 | 0.94mi |
| 22737 Terrazzo Dr Katy, TX | 4.0 | 3.0 | 1873 | $2,649 | $1.41 | 44d | 1 | 0.95mi |
| 22808 Terrazzo Dr Katy, TX | 4.0 | 2.5 | 2004 | $2,529 | $1.26 | 17d | 1 | 0.96mi |
| 21522 Violet Ridge Rd Katy, TX | 3.0 | 4.0 | 1597 | $2,200 | $1.38 | 44d | 1 | 0.99mi |
| 23030 Cunningham Falls Trl Katy, TX | 1.0–3.0 | 1.0–2.0 | 1213 | $2,900 | $2.39 | 5d | 244 | 1.01mi |
| 22851 Terazzo Dr Katy, TX | 3.0–4.0 | 2.5–3.0 | 1740 | $2,239 | $1.29 | 1d | 1 | 1.02mi |
| 22841 Terrazzo Dr Katy, TX | 3.0 | 2.5 | 1464 | $2,249 | $1.54 | 5d | 1 | 1.03mi |
| 22865 Terrazzo Dr Katy, TX | 4.0 | 2.5 | 2017 | $2,759 | $1.37 | 15d | 1 | 1.04mi |
| 22855 Terrazzo Dr Katy, TX | 3.0 | 2.5 | 1667 | $2,399 | $1.44 | 13d | 1 | 1.04mi |
| 22700 Elyson Falls Dr Katy, TX | 2.0–4.0 | 2.0–3.0 | 1658 | $2,448 | $1.48 | 3d | 1 | 1.06mi |
| 21331 Hartford Hollow Ln Katy, TX | 3.0 | 2.0 | 1820 | $1,500 | $0.82 | 20d | 1 | 1.08mi |
| 5710 Fresh View Ct Katy, TX | 4.0 | 2.5 | 2313 | $2,495 | $1.08 | 2d | 1 | 1.16mi |
| 5103 Visionary Dr Katy, TX | 3.0–4.0 | 2.0–2.5 | 1692 | $2,121 | $1.25 | 2d | 9 | 1.27mi |
| 4411 Andorno Dr Katy, TX | 4.0 | 2.0 | 2094 | $2,221 | $1.06 | 24d | 1 | 1.36mi |
| 5107 Jasper Garden Cir Katy, TX | 3.0 | 2.0 | 1412 | $1,825 | $1.29 | 21d | 1 | 1.43mi |
| 22843 Castello Lakes Dr Katy, TX | 4.0 | 2.0 | 2036 | $2,148 | $1.06 | 22d | 1 | 1.45mi |
| 21627 Calico Bush Trl Katy, TX | 3.0 | 2.0 | 1423 | $3,800 | $2.67 | 17d | 1 | 1.49mi |
HOA detail
- Monthly dues
- $40 · $480/yr
- Likely covers
- security
Listing history 30 events
-
2026-06-18days on market $264,000 Active 103 DOM
-
2026-06-17days on market $264,000 Active 102 DOM
-
2026-06-16days on market $264,000 Active 101 DOM
-
2026-06-15days on market $264,000 Active 100 DOM
-
2026-06-13days on market $264,000 Active 98 DOM
-
2026-06-09days on market $264,000 Active 94 DOM
-
2026-06-08days on market $264,000 Active 93 DOM
-
2026-06-07days on market $264,000 Active 92 DOM
-
2026-06-04days on market $264,000 Active 89 DOM
-
2026-06-03days on market $264,000 Active 88 DOM
-
2026-06-02days on market $264,000 Active 87 DOM
-
2026-06-01days on market $264,000 Active 86 DOM
-
2026-05-31days on market $264,000 Active 85 DOM
-
2026-03-07$274,999 Active 960-char remark
Show marketing remark (960 chars)
Discover a prime opportunity along Grand Parkway 99, one of the fastest-growing corridors in the Houston area. This beautifully remodeled property combines modern updates with a peaceful country-style setting while remaining minutes from major highways, shopping, dining, and new developments. Situated on a spacious, private lot surrounded by mature trees, the home offers a serene outdoor environment with a bright, welcoming feel. Large windows and French doors allow abundant natural light and create a seamless connection to the outdoor patio area—perfect for entertaining or relaxing. The expansive yard provides excellent flexibility for outdoor living, future expansion, or value-add improvements. The property is fully fenced, offering privacy and security while maintaining its tranquil atmosphere. Located directly along the highly desirable Grand Parkway 99 corridor, this property sits in the path of rapid commercial and residential growth.
-
2026-03-05historical
-
2026-02-11$279,999 Active
-
2025-12-27historical
-
2025-09-26$285,000 Active
-
2022-04-25soldstatus Sold
-
2022-04-25soldstatus
-
2022-04-12status Pending
-
2022-03-28price $199,000
-
2022-01-25price $2,130
-
2021-11-11$230,000 Active
-
2014-11-04historical
-
2014-11-04soldstatus
-
2014-11-03soldstatus Sold
-
2014-10-14status Pending
-
2014-09-20$99,000 Active
-
1993-07-20soldstatus
ⓘ Source: listings_history table (triggers on properties + properties_extension) + one-shot
backfill from property_details.listing_events for pre-trigger history.
Tax reassessment forecast TX · Resets to sale price
- Current annual tax
- $2,293 · $191/mo
- Projected year-2 tax
- $4,831 · $403/mo
- Expected delta
- +$2,538/yr (+$212/mo · 110.7%)
ⓘ Screening estimate from a state-policy table — verify with the county assessor before closing.
Climate risk First Street
- Flood 5/10 Major FEMA zone X (unshaded) · 65% chance over 30 yrs
- Wildfire 2/10 Low
- Heat 9/10 Extreme 7 d/yr ≥110°F today · 22 d/yr by 30 yrs out
- Wind 9/10 Extreme 99% chance of damaging wind over 30 yrs
- Air quality 2/10 Low 1 unhealthy d/yr today · 1 by 30 yrs out
Nearby sold comps map
Loading sold comps map…
Walkable amenities ~0.75 mi
Loading nearby amenities…
Taxation est. · year 1
- Rental income
- $29,070
- − Mortgage interest
- −$14,788
- − Property taxes
- −$2,293
- − Insurance
- −$1,320
- − Repairs & maintenance
- −$2,326
- − Management
- −$2,326
- − HOA
- −$480
- − Depreciation
- −$7,680
- Taxable loss
- −$2,143
- Est. tax savings @ 24.0%
- +$514
- After-tax cash flow
- $2,773/yr
For passive investors: Depreciation is non-cash, so a rental often shows a tax loss while cash-flowing — sheltering income. Rental losses are passive: they offset passive income freely, and up to $25,000/yr can offset ordinary (W-2) income if you actively participate and your MAGI is under $100k (phasing out to $0 by $150k); unused losses carry forward. On sale, claimed depreciation is recaptured at up to 25%, and gains may owe capital-gains tax (a 1031 exchange can defer both). Figures are a year-1 estimate at your 24.0% rate — not tax advice; consult a CPA.
Schools (NCES district)
- District
- Katy ISD
- NCES district ID
- 4825170
- Math proficiency
- 61% ▼ -7.00%
- Reading proficiency
- 63% ▼ -3.00%
- Median HH income
- $90,312
- Composite
- 56.59/100
- National rank
- #1146
- State rank
- #29 of 826 in TX
Livability — Houston
- Score
- 74/100
- State rank
- #184
- US rank
- #4771
Category grades
Schools grade is shown separately in the Schools card above.
Census & demographics
- County
- Harris County · 4,702,590 people
- City population
- 3,226,434
- Metro
- Houston-The Woodlands-Sugar Land, TX
- Population (ZIP)
- 130,028
- Household income
- $87,808
- Rent vs Own
- Severe rent burden
- 3088.0
Population outlook (Harris County) Hauer SSP2
- Today (2025)
- 5,571,493 people
- By 2030
- 6,089,821 · +9.3%
- By 2040
- 7,142,806 · +28.2%
- By 2050
- 8,185,864 · +46.9%
- By 2075
- 10,574,329 · +89.8%
- By 2100
- 12,109,958 · +117.4%
Race, ethnicity, and origin ACS 2023
- Neighborhood character
- Diverse neighborhood (Simpson 0.68)
- Race & ethnicity
- Hispanic / Latino 49% Two or more races 22% Black 20% White 19% Asian 6%
- Hispanic origin (detail)
- Mexican 26% Puerto Rican 1% Cuban 4%
- Common ancestry
- Lithuanian 1% Italian 1%
- Foreign-born
- 32% · Canada, Jamaica, Vietnam
- Languages at home
- 48% English-only · Spanish 40% Other Indo-European 3% Vietnamese 1%
Political lean MEDSL · Harris
- 2024 margin
- Lean D (+5.5) · D 52.0% · R 46.4% · Other 1.6%
- 2008→2024 swing
- +3.9pp toward D · 2008: 1.6pp · 2024: 5.5pp
- All cycles
- 2024: D+5.5 2020: D+13.3 2016: D+12.4 2012: D+0.1 2008: D+1.6
Not yet ingested
- Civics
- —
Market trends
- HPI YoY
- ▼ -1.27%
- Current HPI
- 254.6622
- Rent YoY
- ▼ -2.86%
- Metro
- Houston-The Woodlands-Sugar Land, TX
- State GDP YoY
- ▲ 3.95%
- F500 in state
- 110
Industry mix (Fortune 500 HQ in TX)
| Industry | F500 HQs | Revenue |
|---|---|---|
| Energy | 16 | $1,198B |
|
||
| Technology | 5 | $198B |
|
||
| Engineering / Construction | 4 | $72B |
|
||
| Energy Services | 3 | $60B |
|
||
| Utilities | 3 | $41B |
|
||
| Healthcare | 2 | $330B |
|
||
Price history
+177.8% since first listed17 events — show timeline
- 2026-03-07 Listed $274,999 HARMLS
- 2026-03-05 Listing Removed — HARMLS
- 2026-02-11 Listed $279,999 HARMLS
- 2025-12-27 Listing Removed — HARMLS
- 2025-09-26 Listed $285,000 HARMLS
- 2022-04-25 Sold (Public Records) — Public Records
- 2022-04-25 Sold (MLS) — HARMLS
- 2022-04-12 Pending — HARMLS
- 2022-03-28 Price Changed $199,000 HARMLS
- 2022-01-25 Price Changed $2,130 RENT.
- 2021-11-11 Listed $230,000 HARMLS
- 2014-11-04 Listing Removed — HARMLS
- 2014-11-04 Sold (Public Records) — Public Records
- 2014-11-03 Sold (MLS) — HARMLS
- 2014-10-14 Pending — HARMLS
- 2014-09-20 Listed $99,000 HARMLS
- 1993-07-20 Sold (Public Records) — Public Records
Property tax history
+7.6%/yrLatest (2025): $2,293 · +11.2% YoY. Source: county tax records.
Cash-flow waterfall
monthlySold comps — $/sqft
last 12 mo · ≤1 miLoading sold comps…