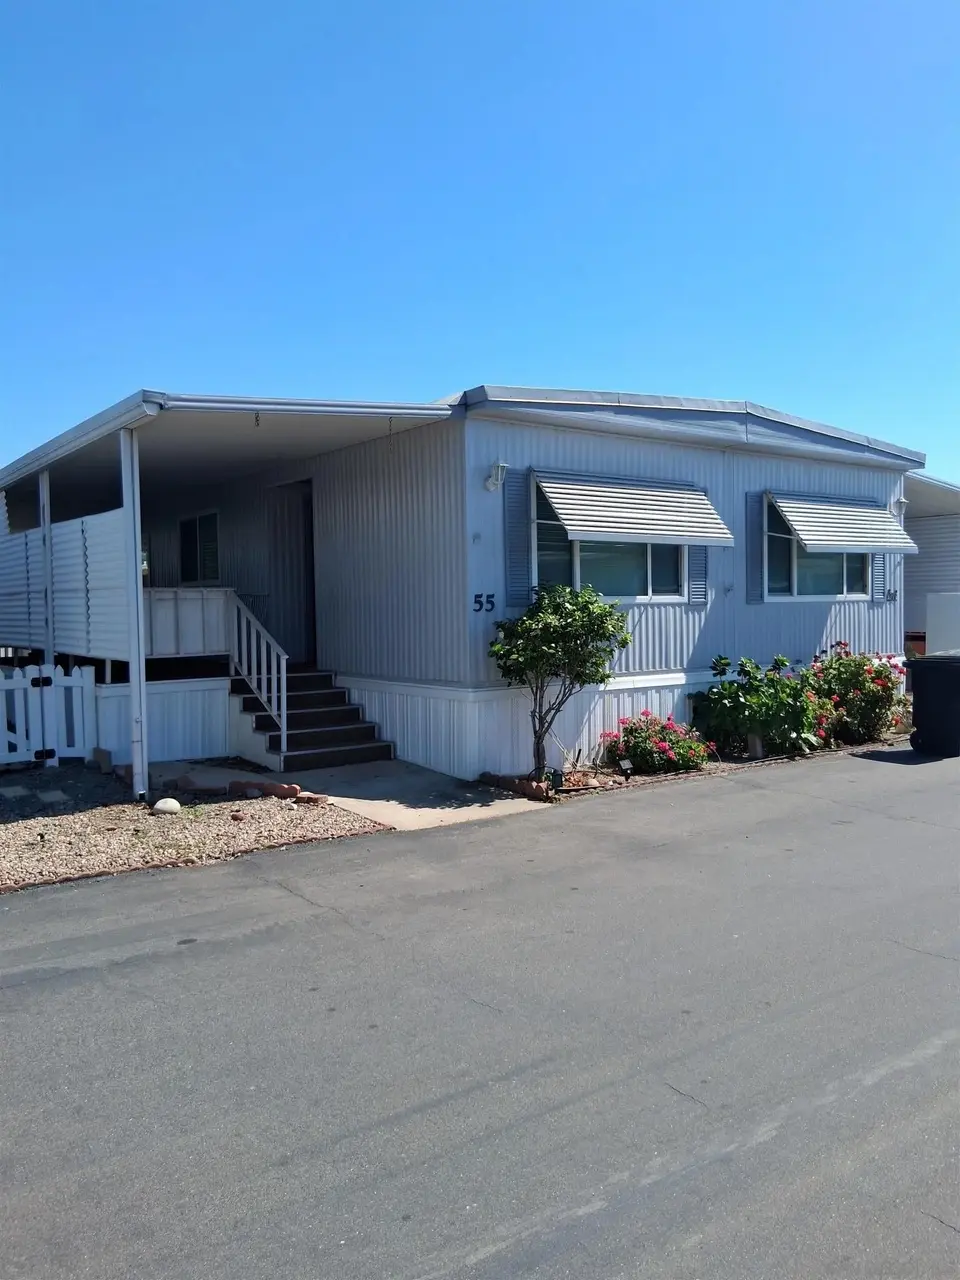
11949 Riverside Dr #55 · Lakeside, CA
Flood risk 1/10 · Minimal
- FEMA flood zone
- X (unshaded)
- Chance of flooding over 30 yrs
- 0.0%
- Est. flood insurance / yr
- $507 – $1,088
Fire risk 6/10 · Moderate
- Est. fire insurance / yr
- $659 – $1,223
Heat risk 6/10 · Moderate
- Hot days now (above 97°F)
- 7 days/yr
- Hot days in 30 yrs
- 20 days/yr
Wind risk 1/10 · Minimal
- Chance of severe wind over 30 yrs
- —
Air-quality risk 5/10 · Moderate
- Unhealthy air days now
- 7 days/yr
- Unhealthy air days in 30 yrs
- 7 days/yr
Risk factors via First Street. Map © Google.
Why this score? — see what drove the B grade
The composite is a weighted blend of 9 inputs, each scored 0–100. Each bar is that input's sub-score; the figure is the points it added to the 100-point composite (weight × sub-score).
- Cash flow +30.0/30.0
- 1% rule +10.0/10.0
- DSCR +10.0/10.0
- ARV discount +7.5/15.0
- Schools +4.4/10.0
- Rent growth +3.4/5.0
- Livability +2.8/5.0
- Condition / age +2.5/5.0
- Appreciation +0.0/10.0
$135,000
🖨 Deal sheet 📄 Offer letter ✓ Due diligence
Listing remarks
Nice clean home in Willowbrook Estates East. Freshly painted. Laminate flooring.
Key facts
- 2 parking spots
- Built 1971
Property features AI
Finance
- Other: Located in the Lakeside subdivision
- HOA & community: Senior community; Willowbrook Estates East community; Breed restrictions for pets
Exterior
- Parking: 2 parking spaces
- Utilities: Sewer connected
- Home design: Mobile home; Single-story
- Construction: Composition roof; Metal roof; Rolled/hot mop roof
- Exterior features: Covered patio/porch
Interior
- Bedrooms: Possible 2 bedrooms
- Flooring: Carpet
- Bathrooms: 2 full bathrooms
- Heating & cooling: Central air conditioning; Forced air heating
- Interior features: Disposal; Carpet flooring
Neighborhood map
What this means for you Summary
Snapshot
- This is a 2-bed/2.0-bath manufactured listed at $135k.
Deal economics
- At list price, monthly cash flow is $1k ($13k/yr) — positive.
- The deal already cash-flows at list — no discount required.
- Meets the 1% rule at list price ($3k rent vs $135k).
- Cap rate 15.7% vs local median 2.6% in Lakeside — top-decile yield for the area; either an underpriced asset or a hidden risk that comps aren't pricing in. Stress-test before assuming the spread holds.
Location & tenants
- Location reads 55/100 on livability (#877 in CA) — a working-class tenant base; expect higher turnover. Strengths: employment A-, housing A-, health & safety B; Watch: commute D, crime D-, amenities F.
- Lakeside Union Elementary (suburban): math 41% / reading 52% proficiency, ranked #480 of 1,400 in CA (top 34%) — families likely to look elsewhere, expect single-tenant / working-renter base with shorter leases.
- Market conditions: Rents rising (+3.6%/yr); 148 active listings in the ZIP; 20 comparable units currently listed for rent nearby; rentals leasing fast (median 2d on market — plan ~1-2 weeks tenant-placement turnaround); solid renter incomes; 11,759 units permitted in San Diego County in 2024 (7,244 in 5+ unit buildings).
Forward outlook
- Local home prices are declining (-3.0%/yr); year-one equity from $933 of loan paydown is wiped out by about $4k of value loss. Plan a longer hold.
- San Diego County population projected at +20% by 2050 — long-run rental-demand tailwind backs the buy-and-hold thesis.
- At projected returns (-3.0% appreciation + 3.6% rent growth), your $38k cash investment doubles in ~4 years — after that, you're playing with house money.
Negotiation context
- Only 1 days on market — expect competitive offers; lowballing is unlikely to land.
- 2 sale attempts since 25y ago with the ask held roughly flat each time — persistent listings suggest the price (not the market) is what's stuck; bring a comps-based counter.
Risks & watch-outs
- Climate carrying-cost: major wildfire risk; extreme-heat days projected 7→20/yr by 2055 (HVAC capex compounding) — expect insurance premiums to compound above CPI over the hold.
Questions for the listing agent
- Built in 1971 — when were the roof, HVAC, electrical panel, plumbing, and water heater last replaced?
- Is there a deadline driving the sale (1031 exchange, divorce, estate, relocation)? That informs how much negotiation room exists.
- Crime grade is D in this area — have there been break-ins, vandalism, or insurance claims at this property in the last 3 years? What carrier currently insures it and at what premium?
- What's the average days-on-market for RENTAL listings here right now (not sales)? A rising rental-DOM trend means longer vacancies and softer asking-rent achievability than the comps imply.
- What's the recent tenant-quality profile in this submarket — average credit score on applications, eviction rate, late-payment / NSF rate, and stable-employment percentage? A property-management company in the area should have these aggregated.
- How much new for-sale + rental construction is in the pipeline within 1–3 miles? Heavy new supply typically softens prices + rents 12–24 months out; constrained supply supports both.
Investment metrics
- 1% rule
- 1.87% ✓
- Cap rate
- 15.70%
- Cash-on-cash
- 33.58%
- DSCR
- 2.49
- GRM
- 4.5
CMA / ARV
- ARV (on-the-fly)
- $315,744
- Comps found
- 10
Show comp detail 10 sales within ~0.75 mi
| Address | Dist | Beds/Ba | Sqft | Sold | Price | $/sf | Match |
|---|---|---|---|---|---|---|---|
| 11949 Riverside Dr #55 | 0.00mi | 2/2.0 | 1,248 (0%) | 0mo | $125,000 | $100 | 100 |
| 11949 Riverside Dr #155 | 0.13mi | 2/2.0 | 1,344 (+8%) | 2mo | $95,000 | $71 | 80 |
| 11949 Riverside Dr #133 | 0.08mi | 2/2.0 | 1,376 (+10%) | 1mo | $161,000 | $117 | 79 |
| 11851 Riverside #202 | 0.11mi | 3/2.0 (+1) | 1,246 (-0%) | 21mo | $285,000 | $229 | 72 |
| 11851 Riverside Dr #246 | 0.11mi | 2/2.0 | 1,400 (+12%) | 10mo | $418,500 | $299 | 66 |
| 11949 Riverside Dr #25 | 0.08mi | 2/2.0 | 1,344 (+8%) | 22mo | $340,000 | $253 | 65 |
| 11851 Riverside Dr Spc 223 | 0.11mi | 2/2.0 | 1,418 (+14%) | 10mo | $375,000 | $264 | 64 |
| 11851 Riverside Dr #262 | 0.11mi | 3/2.0 (+1) | 1,331 (+7%) | 20mo | $342,000 | $257 | 62 |
| 11851 RIVERSIDE Dr #238 | 0.11mi | 3/2.0 (+1) | 1,400 (+12%) | 15mo | $375,000 | $268 | 57 |
| 11851 Riverside Dr Spc 260 | 0.11mi | 3/2.0 (+1) | 1,360 (+9%) | 23mo | $300,000 | $221 | 56 |
Match score weights: distance 35% · size 25% · config 20% · recency 20%. Top-matched comps best support the ARV.
Projected returns pro-forma
-3.0% appreciation · 3.56% rent growth · sell at horizon
- IRR
- 29.5%
- Equity multiple
- 2.24×
- Total profit
- $46,966
- Equity at exit
- $20,129
- IRR
- 37.2%
- Equity multiple
- 4.54×
- Total profit
- $133,734
- Equity at exit
- $11,672
Cash invested: $37,800 (down + closing). Projections, not guarantees.
Landlord ↔ Tenant lean methodology
- Overall (STATE)
- 18 Strongly Tenant-Friendly
- State California
- 18 Strongly Tenant-Friendly · D+13
- County
- — inherits STATE
- City
- — inherits STATE
ZIP-level market 92040
- Rents YoY
- 3.6%
- Active inventory
- 148
- Price-to-rent
- 4.5×
Monthly cashflow live
- Estimated rent
- $2,520 high interval (Pro) →
- Mortgage (P&I)
- −$708
- Tax est. 1.5%
- −$169 /mo · $2,025/yr
- Insurance
- −$56
- HOA
- −$0
- Vacancy / Maint / Mgmt
- −$529
- Net cashflow
- $1,058
Break-even live
UW: 25.0% down · 7.5% · 30yr · 1.5% tax · 5.0% vac · 8.0% maint · 8.0% mgmt
Financing live
Cash to close
- Down payment
- $33,750
- Closing costs
- $4,050
- Reserves months
- —
- Total cash needed
- —
Loan-product check · same deal, 3 products live
Conventional
25% down · 7.5% · 30yr
- Down + closing
- —
- Monthly P&I
- —
- Monthly cashflow
- —
- DSCR
- —
- Eligible?
- —
Personal DTI + credit; lowest rate.
DSCR
20% down · 8.5% · 30yr
- Down + closing
- —
- Monthly P&I
- —
- Monthly cashflow
- —
- DSCR
- —
- Eligible?
- —
No personal income docs; deal must DSCR.
Hard money
10% down · 12.0% · 12mo
- Down + closing
- —
- Monthly P&I
- —
- Monthly cashflow
- —
- DSCR
- —
- Eligible?
- —
Short-term bridge; refi at stabilization.
Rent comps 20 comps
| Address | Beds | Baths | Sqft | Rent | $/sqft | DOM | Units | Dist |
|---|---|---|---|---|---|---|---|---|
| 12156 Lakeside Ave Lakeside, CA | 3.0 | 2.0 | 1424 | $3,500 | $2.46 | 1d | 1 | 0.31mi |
| SR 67 Lakeside, CA | 1.0 | 1.0 | 700 | $2,500 | $3.57 | 1d | 1 | 0.48mi |
| 9830 Summersun Ln Lakeside, CA | 2.0–3.0 | 1.5–2.5 | 1325 | $2,400 | $1.81 | 1d | 1 | 0.64mi |
| 12001 Woodside Ave Lakeside, CA | 2.0 | 2.0 | 1006 | $2,350 | $2.34 | 1d | 1 | 0.71mi |
| 12225 Woodside Ave Unit 12225 B Lakeside, CA | 2.0 | 1.0 | 860 | $2,150 | $2.50 | 1d | 1 | 0.71mi |
| 12370 Parkside St Lakeside, CA | 2.0 | 2.0 | 944 | $1,925 | $2.04 | 7d | 1 | 0.75mi |
| 12618 Laurel St Unit 12618 C Lakeside, CA | 3.0 | 1.0 | 1100 | $2,390 | $2.17 | 1d | 1 | 0.91mi |
| 10112 Ashwood St Lakeside, CA | 2.0 | 1.0–2.0 | 763 | $1,944 | $2.55 | 1d | 8 | 0.93mi |
| 9662 Marilla Dr Lakeside, CA | 2.0 | 2.0 | 931 | $2,388 | $2.56 | 1d | 4 | 0.94mi |
| 9669 Marilla Dr Unit 0C Lakeside, CA | 2.0 | 2.0 | 850 | $2,105 | $2.48 | 1d | 1 | 0.94mi |
| 9662 Marilla Dr Unit 93 Lakeside, CA | 2.0 | 2.0 | 931 | $2,350 | $2.52 | 10d | 1 | 0.94mi |
| 9728 Marilla Dr #305 Lakeside, CA | 2.0 | 2.0 | 944 | $2,590 | $2.74 | 1d | 1 | 0.95mi |
| 12403 Julian Ave #206 Lakeside, CA | 2.0 | 1.0 | 806 | $2,850 | $3.54 | 1d | 1 | 0.95mi |
| 12645 Laurel St Apt 13 Lakeside, CA | 2.0 | 2.0 | 900 | $1,950 | $2.17 | 1d | 1 | 0.96mi |
| 12645 Laurel St Lakeside, CA | 2.0 | 2.0 | 900 | $1,950 | $2.17 | 10d | 1 | 0.96mi |
| 9525 Riverview Ave Lakeside, CA | 2.0 | 1.0 | 740 | $3,050 | $4.12 | 7d | 1 | 1.04mi |
| 12738 Lakeshore Dr Lakeside, CA | 3.0 | 2.5 | 1368 | $4,300 | $3.14 | 7d | 1 | 1.10mi |
| 12840 Mapleview St Lakeside, CA | 2.0 | 2.0 | 880 | $2,100 | $2.39 | 1d | 3 | 1.10mi |
| 9413 Winter Gardens Blvd Lakeside, CA | 2.0 | 1.5 | 700 | $2,195 | $3.14 | 1d | 1 | 1.15mi |
| 12905 Mapleview St Lakeside, CA | 2.0 | 1.5 | 800 | $2,244 | $2.80 | 1d | 3 | 1.17mi |
Listing history 4 events
-
2026-05-12status Pending
-
2026-05-11$135,000 Active
-
2001-08-23historical
-
2001-02-23$58,500
ⓘ Source: listings_history table (triggers on properties + properties_extension) + one-shot
backfill from property_details.listing_events for pre-trigger history.
Climate risk First Street
- Flood 1/10 Low FEMA zone X (unshaded) · 0% chance over 30 yrs
- Wildfire 6/10 Major
- Heat 6/10 Major 7 d/yr ≥97°F today · 20 d/yr by 30 yrs out
- Wind 1/10 Low
- Air quality 5/10 Major 7 unhealthy d/yr today · 7 by 30 yrs out
Nearby sold comps map
Loading sold comps map…
Walkable amenities ~0.75 mi
Loading nearby amenities…
Taxation est. · year 1
- Rental income
- $30,240
- − Mortgage interest
- −$7,562
- − Property taxes
- −$2,025
- − Insurance
- −$675
- − Repairs & maintenance
- −$2,419
- − Management
- −$2,419
- − Depreciation
- −$3,927
- Taxable income
- $11,212
- Est. tax owed @ 24.0%
- −$2,691
- After-tax cash flow
- $10,003/yr
For passive investors: Depreciation is non-cash, so a rental often shows a tax loss while cash-flowing — sheltering income. Rental losses are passive: they offset passive income freely, and up to $25,000/yr can offset ordinary (W-2) income if you actively participate and your MAGI is under $100k (phasing out to $0 by $150k); unused losses carry forward. On sale, claimed depreciation is recaptured at up to 25%, and gains may owe capital-gains tax (a 1031 exchange can defer both). Figures are a year-1 estimate at your 24.0% rate — not tax advice; consult a CPA.
Schools (NCES district)
- District
- Lakeside Union Elementary
- NCES district ID
- 0620790
- Math proficiency
- 41% ▬ 0.00%
- Reading proficiency
- 52% ▼ -1.00%
- Median HH income
- $65,574
- Composite
- 43.51/100
- National rank
- #6453
- State rank
- #480 of 1400 in CA
Livability — Lakeside
- Score
- 55/100
- State rank
- #877
- US rank
- #23702
Category grades
Schools grade is shown separately in the Schools card above.
Census & demographics
- Census place
- Lakeside, CA
- County
- San Diego County · 3,178,799 people
- City population
- 46,216
- Metro
- San Diego-Chula Vista-Carlsbad, CA
- Population (ZIP)
- 46,216
- Household income
- $107,937
- Rent vs Own
- Severe rent burden
- 1147.0
Population outlook (San Diego County) Hauer SSP2
- Today (2025)
- 3,678,185 people
- By 2030
- 3,856,546 · +4.8%
- By 2040
- 4,171,407 · +13.4%
- By 2050
- 4,421,607 · +20.2%
- By 2075
- 4,831,599 · +31.4%
- By 2100
- 4,832,502 · +31.4%
Race, ethnicity, and origin ACS 2023
- Neighborhood character
- Predominantly White (69%)
- Race & ethnicity
- White 69% Hispanic / Latino 22% Two or more races 11% Black 2% Asian 2% Native American 1%
- Hispanic origin (detail)
- Mexican 19%
- Common ancestry
- Lithuanian 3% Italian 3% Slovak 2%
- Foreign-born
- 8% · Canada
- Languages at home
- 86% English-only · Spanish 10% Arabic 1% Other Indo-European 1%
Political lean MEDSL · San Diego
- 2024 margin
- D (+16.8) · D 56.9% · R 40.1% · Other 2.9%
- 2008→2024 swing
- +6.6pp toward D · 2008: 10.2pp · 2024: 16.8pp
- All cycles
- 2024: D+16.8 2020: D+22.8 2016: D+17.8 2012: D+5.1 2008: D+10.2
Not yet ingested
- Civics
- —
Market trends
- HPI YoY
- ▼ -622.09%
- Current HPI
- 344.8263
- Rent YoY
- ▲ 3.56%
- Metro
- San Diego-Chula Vista-Carlsbad, CA
- State GDP YoY
- ▲ 3.21%
- F500 in state
- 116
Industry mix (Fortune 500 HQ in CA)
| Industry | F500 HQs | Revenue |
|---|---|---|
| Technology | 27 | $1,492B |
|
||
| Financial Services | 3 | $174B |
|
||
| Retail | 3 | $44B |
|
||
| Insurance | 3 | $26B |
|
||
| Media / Entertainment | 2 | $115B |
|
||
| Pharmaceuticals / Biotech | 2 | $62B |
|
||
Price history
+130.8% since first listed4 events — show timeline
- 2026-05-12 Pending — SDMLS
- 2026-05-11 Listed $135,000 SDMLS
- 2001-08-23 Listing Removed — SDMLS
- 2001-02-23 Listed $58,500 SDMLS
Cash-flow waterfall
monthlySold comps — $/sqft
last 12 mo · ≤1 miLoading sold comps…