12817 N 19th Pl · Phoenix, AZ
Flood risk 1/10 · Minimal
- FEMA flood zone
- X (unshaded)
- Chance of flooding over 30 yrs
- 0.0%
- Est. flood insurance / yr
- $507 – $1,088
Fire risk 3/10 · Minor
- Est. fire insurance / yr
- $610 – $1,132
Heat risk 8/10 · Major
- Hot days now (above 110°F)
- 7 days/yr
- Hot days in 30 yrs
- 17 days/yr
Wind risk 1/10 · Minimal
- Chance of severe wind over 30 yrs
- —
Air-quality risk 3/10 · Minor
- Unhealthy air days now
- 2 days/yr
- Unhealthy air days in 30 yrs
- 3 days/yr
Risk factors via First Street. Map © Google.
Why this score? — see what drove the B- grade
The composite is a weighted blend of 9 inputs, each scored 0–100. Each bar is that input's sub-score; the figure is the points it added to the 100-point composite (weight × sub-score).
- Cash flow +30.0/30.0
- 1% rule +10.0/10.0
- DSCR +10.0/10.0
- ARV discount +7.5/15.0
- Schools +3.8/10.0
- Livability +3.8/5.0
- Condition / age +2.5/5.0
- Rent growth +2.2/5.0
- Appreciation +0.0/10.0
$74,900
🖨 Deal sheet 📄 Offer letter ✓ Due diligence
Listing remarks MLS
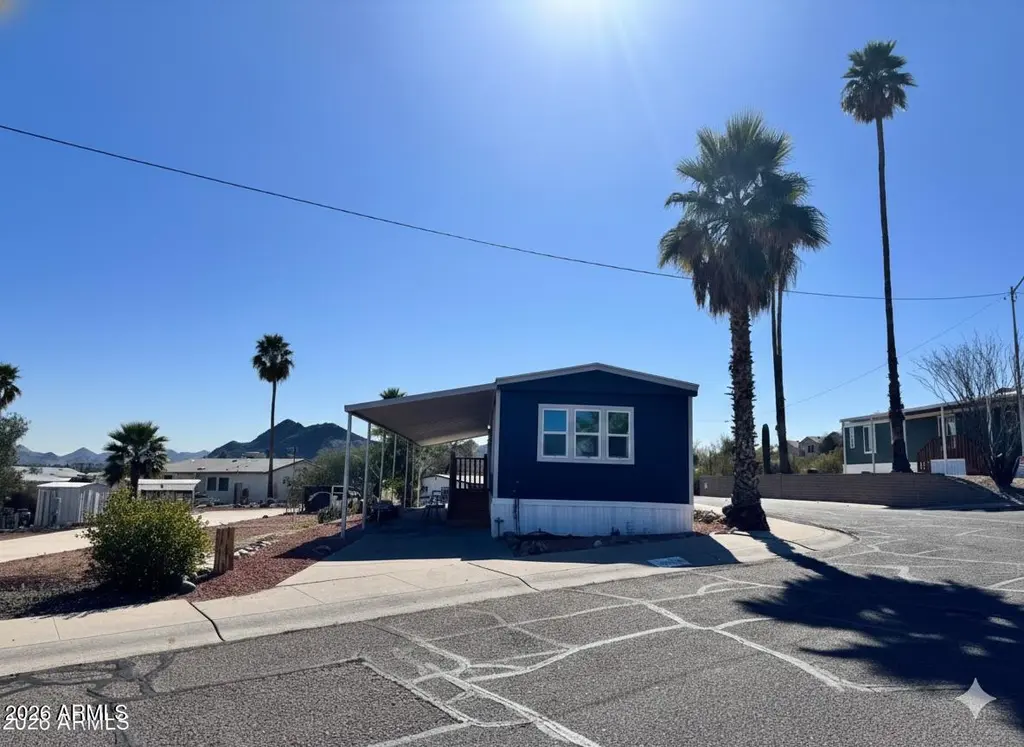
Family-friendly park in an ideal Paradise Valley location! Located on a premium corner lot with fantastic views. This freshly remodeled home with vinyl plank flooring throughout for easy care, vaulted ceilings, light interior paint, ceiling fans and window treatments is move-in ready. Open concept with split bedrooms for privacy. Kitchen boasts stainless steel appliances, microwave, tile backsplash at range, upgraded sink and counter-tops. Inside laundry with newer stainless steel washer/dryer. Master suite hosts a walk-in closet and ensuite with upgraded walk-in shower and vanity. Secondary bedroom with bay window, plenty of closet storage, conveniently located near second full bathroom. Second bath offers tiled shower surround, tub and newer vanity. Great value here!
Key facts
- Premium corner lot
- Fantastic views
- Open concept
Tags
Neighborhood map
What this means for you Summary
Snapshot
- This is a 2-bed/2.0-bath land listed at $75k.
Deal economics
- At list price, monthly cash flow is $594 ($7k/yr) — positive.
- The deal already cash-flows at list — no discount required.
- Meets the 1% rule at list price ($1k rent vs $75k).
- Recommended offer: $66k (12.0% below list) — sets the bar for market timing.
- Cap rate 15.8% vs local median 3.3% in Phoenix — top-decile yield for the area; either an underpriced asset or a hidden risk that comps aren't pricing in. Stress-test before assuming the spread holds.
Location & tenants
- Location reads 75/100 on livability (#16 in AZ, #3,924 nationally) — a middle-class / working-renter tenant base. Strengths: amenities A+, commute A+, housing A+; Watch: health & safety C-, crime F.
- Paradise Valley Unified District (4241) (urban): math 39% / reading 46% proficiency, ranked #56 of 249 in AZ (top 22%) — families likely to look elsewhere, expect single-tenant / working-renter base with shorter leases.
- Market conditions: Rents soft (-1.2%/yr); 282 active listings in the ZIP; 32 comparable units currently listed for rent nearby; rentals at typical pace (median 22d on market — plan ~3-4 weeks tenant-placement turnaround); 36,011 units permitted in Maricopa County in 2024 (12,801 in 5+ unit buildings).
Forward outlook
- Local home prices are declining (-3.0%/yr); year-one equity from $518 of loan paydown is wiped out by about $2k of value loss. Plan a longer hold.
- Maricopa County population projected at +38% by 2050 — long-run rental-demand tailwind backs the buy-and-hold thesis.
- At projected returns (-3.0% appreciation + 0.0% rent growth), your $21k cash investment doubles in ~4 years — after that, you're playing with house money.
Negotiation context
- It's been on market 135 days — a 12% lower offer ($66k) is reasonable based on typical stale-listing flexibility.
Risks & watch-outs
- Climate carrying-cost: extreme-heat days projected 7→17/yr by 2055 (HVAC capex compounding) — expect insurance premiums to compound above CPI over the hold.
Questions for the listing agent
- It's been on market 135 days. Have you received any prior offers? Is the seller open to a 12% concession, seller financing, or rate buy-down credit?
- Why hasn't it sold? Are there any deal-killer items the seller is aware of (foundation, flood, title, zoning, code violations)?
- Is there a deadline driving the sale (1031 exchange, divorce, estate, relocation)? That informs how much negotiation room exists.
- Crime grade is F in this area — have there been break-ins, vandalism, or insurance claims at this property in the last 3 years? What carrier currently insures it and at what premium?
- What's the average days-on-market for RENTAL listings here right now (not sales)? A rising rental-DOM trend means longer vacancies and softer asking-rent achievability than the comps imply.
- What's the recent tenant-quality profile in this submarket — average credit score on applications, eviction rate, late-payment / NSF rate, and stable-employment percentage? A property-management company in the area should have these aggregated.
- How much new for-sale + rental construction is in the pipeline within 1–3 miles? Heavy new supply typically softens prices + rents 12–24 months out; constrained supply supports both.
Investment metrics
- 1% rule
- 1.88% ✓
- Cap rate
- 15.81%
- Cash-on-cash
- 34.00%
- DSCR
- 2.51
- GRM
- 4.4
CMA / ARV
- ARV (median comp)
- $219,314
- List price
- $74,900
- Delta
- -65.85%
- Verdict
- UNDERPRICED
- Comps
- 2 within 1.0 mi
Projected returns pro-forma
-3.0% appreciation · 0.0% rent growth · sell at horizon
- IRR
- 25.9%
- Equity multiple
- 2.03×
- Total profit
- $21,604
- Equity at exit
- $11,168
- IRR
- 31.7%
- Equity multiple
- 3.46×
- Total profit
- $51,689
- Equity at exit
- $6,476
Cash invested: $20,972 (down + closing). Projections, not guarantees.
Landlord ↔ Tenant lean methodology
- Overall (STATE)
- 87 Strongly Landlord-Friendly
- State Arizona
- 87 Strongly Landlord-Friendly · R+3
- County
- — inherits STATE
- City
- — inherits STATE
ZIP-level market 85022
- Rents YoY
- -1.2%
- Active inventory
- 282
- Price-to-rent
- 4.4×
Monthly cashflow live
- Estimated rent
- $1,407 high interval (Pro) →
- Mortgage (P&I)
- −$393
- Tax est. 1.5%
- −$94 /mo · $1,124/yr
- Insurance
- −$31
- HOA
- −$0
- Vacancy / Maint / Mgmt
- −$296
- Net cashflow
- $594
Break-even live
UW: 25.0% down · 7.5% · 30yr · 1.5% tax · 5.0% vac · 8.0% maint · 8.0% mgmt
Financing live
Cash to close
- Down payment
- $18,725
- Closing costs
- $2,247
- Reserves months
- —
- Total cash needed
- —
Loan-product check · same deal, 3 products live
Conventional
25% down · 7.5% · 30yr
- Down + closing
- —
- Monthly P&I
- —
- Monthly cashflow
- —
- DSCR
- —
- Eligible?
- —
Personal DTI + credit; lowest rate.
DSCR
20% down · 8.5% · 30yr
- Down + closing
- —
- Monthly P&I
- —
- Monthly cashflow
- —
- DSCR
- —
- Eligible?
- —
No personal income docs; deal must DSCR.
Hard money
10% down · 12.0% · 12mo
- Down + closing
- —
- Monthly P&I
- —
- Monthly cashflow
- —
- DSCR
- —
- Eligible?
- —
Short-term bridge; refi at stabilization.
Rent comps 32 comps
| Address | Beds | Baths | Sqft | Rent | $/sqft | DOM | Units | Dist |
|---|---|---|---|---|---|---|---|---|
| 12810 N Cave Creek Rd Phoenix, AZ | 2.0 | 1.0–2.0 | 626 | $1,164 | $1.86 | 1d | 25 | 0.15mi |
| 2002 E Sweetwater Ave Unit 202 Phoenix, AZ | 2.0 | 1.0 | 800 | $925 | $1.16 | 24d | 1 | 0.16mi |
| 13201 N 19th Pl Unit C Phoenix, AZ | 2.0 | 1.0 | 1008 | $900 | $0.89 | 24d | 1 | 0.21mi |
| 12440 N 20th St Phoenix, AZ | 3.0 | 2.0 | 954 | $1,997 | $2.09 | 18d | 1 | 0.23mi |
| 1720 E Thunderbird Rd Phoenix, AZ | 1.0–2.0 | 1.0–2.0 | 704 | $1,500 | $2.13 | 1d | 8 | 0.30mi |
| 1720 E Thunderbird Rd Unit 1720-3113 Phoenix, AZ | 1.0 | 1.0 | 827 | $1,325 | $1.60 | 24d | 1 | 0.32mi |
| 12231 N 19th St Phoenix, AZ | 1.0–2.0 | 1.0–2.0 | 774 | $1,500 | $1.94 | 1d | 16 | 0.32mi |
| 13230 N 22nd St Unit 14 Phoenix, AZ | 3.0 | 2.0 | 950 | $2,100 | $2.21 | 24d | 1 | 0.44mi |
| 13230 N 22nd St Unit 22 Phoenix, AZ | 3.0 | 2.0 | 950 | $2,150 | $2.26 | 24d | 1 | 0.44mi |
| 13230 N 22nd St Phoenix, AZ | 3.0 | 2.0 | 950 | $1,900 | $2.00 | 20d | 4 | 0.44mi |
| 13230 N 22nd St Phoenix, AZ | 3.0 | 2.0 | 950 | $1,988 | $2.09 | 17d | 3 | 0.44mi |
| 1550 E Thunderbird Rd Phoenix, AZ | 1.0–3.0 | 1.0–2.0 | 977 | $1,518 | $1.55 | 1d | 13 | 0.44mi |
| 2104 E Eugie Ter Unit 203 Phoenix, AZ | 2.0 | 2.0 | 950 | $1,195 | $1.26 | 24d | 1 | 0.55mi |
| 2217 E Cactus Rd Unit 4 Phoenix, AZ | 2.0 | 2.0 | 900 | $1,000 | $1.11 | 24d | 1 | 0.60mi |
| 2217 E Cactus Rd Unit 4 Phoenix, AZ | 2.0 | 2.0 | 900 | $1,000 | $1.11 | 7d | 1 | 0.60mi |
| 2223 E Cactus Rd Unit 4 Phoenix, AZ | 2.0 | 2.0 | 900 | $1,099 | $1.22 | 24d | 1 | 0.61mi |
| 2223 E Cactus Rd Phoenix, AZ | 2.0 | 2.0 | 900 | $1,199 | $1.33 | 24d | 1 | 0.61mi |
| 2235 E Cactus Rd Unit 3 Phoenix, AZ | 2.0 | 2.0 | 900 | $1,099 | $1.22 | 7d | 1 | 0.62mi |
| 2255 E Cactus Rd Unit 2 Phoenix, AZ | 2.0 | 2.0 | 900 | $1,199 | $1.33 | 24d | 1 | 0.66mi |
| 2625 E Cactus Rd Phoenix, AZ | 1.0–3.0 | 1.0–2.0 | 1026 | $2,139 | $2.08 | 1d | 19 | 1.00mi |
| 11825 N 25th Pl Phoenix, AZ | 1.0 | 1.0 | 564 | $1,499 | $2.66 | 7d | 4 | 1.06mi |
| 11645 N 25th Pl Phoenix, AZ | 2.0 | 2.0 | 977 | $1,400 | $1.43 | 21d | 5 | 1.09mi |
| 826 E Eugie Ave Phoenix, AZ | 3.0 | 2.0 | 1066 | $1,795 | $1.68 | 18d | 1 | 1.33mi |
| 10644 N 15th Way Apt 3 Phoenix, AZ | 2.0 | 1.0 | 750 | $1,050 | $1.40 | 7d | 1 | 1.38mi |
| 10644 N 15th Way Apt 3 Phoenix, AZ | 2.0 | 1.0 | 750 | $1,050 | $1.40 | 24d | 1 | 1.38mi |
| 10644 N 15th Way Unit 08 Phoenix, AZ | 1.0 | 1.0 | 550 | $925 | $1.68 | 7d | 1 | 1.38mi |
| 754 E Eugie Ave Phoenix, AZ | 2.0 | 1.5 | 920 | $1,300 | $1.41 | 24d | 1 | 1.43mi |
| 1551 E Christy Dr Phoenix, AZ | 2.0 | 1.0 | 702 | $950 | $1.35 | 24d | 1 | 1.46mi |
| 3033 E Thunderbird Rd Phoenix, AZ | 1.0 | 1.0 | 721 | $1,503 | $2.08 | 23d | 1 | 1.46mi |
| 3033 E Thunderbird Rd Phoenix, AZ | 2.0 | 2.0 | 968 | $2,122 | $2.19 | 24d | 1 | 1.46mi |
| 3033 E Thunderbird Rd Phoenix, AZ | 2.0 | 2.0 | 968 | $1,992 | $2.06 | 7d | 1 | 1.46mi |
| 3033 E Thunderbird Rd Phoenix, AZ | 1.0 | 1.0 | 741 | $1,487 | $2.01 | 1d | 1 | 1.46mi |
Listing history 17 events
-
2026-06-18days on market $74,900 Active 135 DOM
-
2026-06-17days on market $74,900 Active 134 DOM
-
2026-06-16days on market $74,900 Active 133 DOM
-
2026-06-15days on market $74,900 Active 132 DOM
-
2026-06-13days on market $74,900 Active 130 DOM
-
2026-06-13days on market $74,900 Active 129 DOM
-
2026-06-09days on market $74,900 Active 126 DOM
-
2026-06-08days on market $74,900 Active 125 DOM
-
2026-06-07days on market $74,900 Active 124 DOM
-
2026-06-04days on market $74,900 Active 121 DOM
-
2026-06-03days on market $74,900 Active 120 DOM
-
2026-06-02days on market $74,900 Active 119 DOM
-
2026-06-01days on market $74,900 Active 118 DOM
-
2026-05-31days on market $74,900 Active 117 DOM
-
2026-02-03$74,900 Active 779-char remark
Show marketing remark (779 chars)
Family-friendly park in an ideal Paradise Valley location! Located on a premium corner lot with fantastic views. This freshly remodeled home with vinyl plank flooring throughout for easy care, vaulted ceilings, light interior paint, ceiling fans and window treatments is move-in ready. Open concept with split bedrooms for privacy. Kitchen boasts stainless steel appliances, microwave, tile backsplash at range, upgraded sink and counter-tops. Inside laundry with newer stainless steel washer/dryer. Master suite hosts a walk-in closet and ensuite with upgraded walk-in shower and vanity. Secondary bedroom with bay window, plenty of closet storage, conveniently located near second full bathroom. Second bath offers tiled shower surround, tub and newer vanity. Great value here!
-
2025-10-30soldstatus $9,150,000
-
1989-08-18soldstatus $1,575,000
ⓘ Source: listings_history table (triggers on properties + properties_extension) + one-shot
backfill from property_details.listing_events for pre-trigger history.
Climate risk First Street
- Flood 1/10 Low FEMA zone X (unshaded) · 0% chance over 30 yrs
- Wildfire 3/10 Moderate
- Heat 8/10 Severe 7 d/yr ≥110°F today · 17 d/yr by 30 yrs out
- Wind 1/10 Low
- Air quality 3/10 Moderate 2 unhealthy d/yr today · 3 by 30 yrs out
Nearby sold comps map
Loading sold comps map…
Walkable amenities ~0.75 mi
Loading nearby amenities…
Taxation est. · year 1
- Rental income
- $16,888
- − Mortgage interest
- −$4,196
- − Property taxes
- −$1,124
- − Insurance
- −$374
- − Repairs & maintenance
- −$1,351
- − Management
- −$1,351
- − Depreciation
- −$2,179
- Taxable income
- $6,314
- Est. tax owed @ 24.0%
- −$1,515
- After-tax cash flow
- $5,615/yr
For passive investors: Depreciation is non-cash, so a rental often shows a tax loss while cash-flowing — sheltering income. Rental losses are passive: they offset passive income freely, and up to $25,000/yr can offset ordinary (W-2) income if you actively participate and your MAGI is under $100k (phasing out to $0 by $150k); unused losses carry forward. On sale, claimed depreciation is recaptured at up to 25%, and gains may owe capital-gains tax (a 1031 exchange can defer both). Figures are a year-1 estimate at your 24.0% rate — not tax advice; consult a CPA.
Schools (NCES district)
- District
- Paradise Valley Unified District (4241)
- NCES district ID
- 0405930
- Math proficiency
- 39% ▼ -11.00%
- Reading proficiency
- 46% ▼ -7.00%
- Median HH income
- $64,106
- Composite
- 37.89/100
- National rank
- #4316
- State rank
- #56 of 249 in AZ
Livability — Phoenix
- Score
- 75/100
- State rank
- #16
- US rank
- #3924
Category grades
Schools grade is shown separately in the Schools card above.
Census & demographics
- Census place
- Phoenix, AZ
- County
- Maricopa County · 4,537,380 people
- City population
- 1,500,198
- Metro
- Phoenix-Mesa-Chandler, AZ
- Population (ZIP)
- 53,811
- Household income
- $69,927
- Rent vs Own
- Severe rent burden
- 2976.0
Population outlook (Maricopa County) Hauer SSP2
- Today (2025)
- 4,979,203 people
- By 2030
- 5,378,229 · +8.0%
- By 2040
- 6,156,598 · +23.6%
- By 2050
- 6,872,376 · +38.0%
- By 2075
- 8,401,270 · +68.7%
- By 2100
- 9,247,439 · +85.7%
Race, ethnicity, and origin ACS 2023
- Neighborhood character
- Diverse neighborhood (Simpson 0.59)
- Race & ethnicity
- White 59% Hispanic / Latino 22% Two or more races 11% Black 10% Asian 3% Native American 3%
- Hispanic origin (detail)
- Mexican 18%
- Common ancestry
- Romanian 3% Lithuanian 2% Italian 1%
- Foreign-born
- 14% · Canada, China, Vietnam
- Languages at home
- 79% English-only · Spanish 13% Other Indo-European 2% Russian/Polish/Slavic 1%
Political lean MEDSL · Maricopa
- 2024 margin
- Toss-up / Even · D 47.7% · R 51.2% · Other 1.1%
- 2008→2024 swing
- +7.1pp toward D · 2008: -10.6pp · 2024: -3.5pp
- All cycles
- 2024: R+3.5 2020: D+2.2 2016: R+3.5 2012: R+12.0 2008: R+10.6
Not yet ingested
- Civics
- —
Market trends
- HPI YoY
- ▼ -329.75%
- Current HPI
- 313.5085
- Rent YoY
- ▼ -1.21%
- Metro
- Phoenix-Mesa-Chandler, AZ
- State GDP YoY
- ▲ 4.54%
- F500 in state
- 20
Industry mix (Fortune 500 HQ in AZ)
| Industry | F500 HQs | Revenue |
|---|---|---|
| Technology | 2 | $13B |
|
||
| Mining / Metals | 1 | $23B |
|
||
| Environmental Services | 1 | $16B |
|
||
| Metals / Steel | 1 | $14B |
|
||
| Technology Distribution | 1 | $9B |
|
||
| Homebuilding | 1 | $8B |
|
||
Price history
-95.2% since first listed3 events — show timeline
- 2026-02-03 Listed $74,900 ARMLS
- 2025-10-30 Sold (Public Records) $9,150,000 Public Records
- 1989-08-18 Sold (Public Records) $1,575,000 Public Records
Property tax history
-1.0%/yrLatest (2025): $117 · +2.7% YoY. Source: county tax records.
Cash-flow waterfall
monthlySold comps — $/sqft
last 12 mo · ≤1 miLoading sold comps…