 Triplex
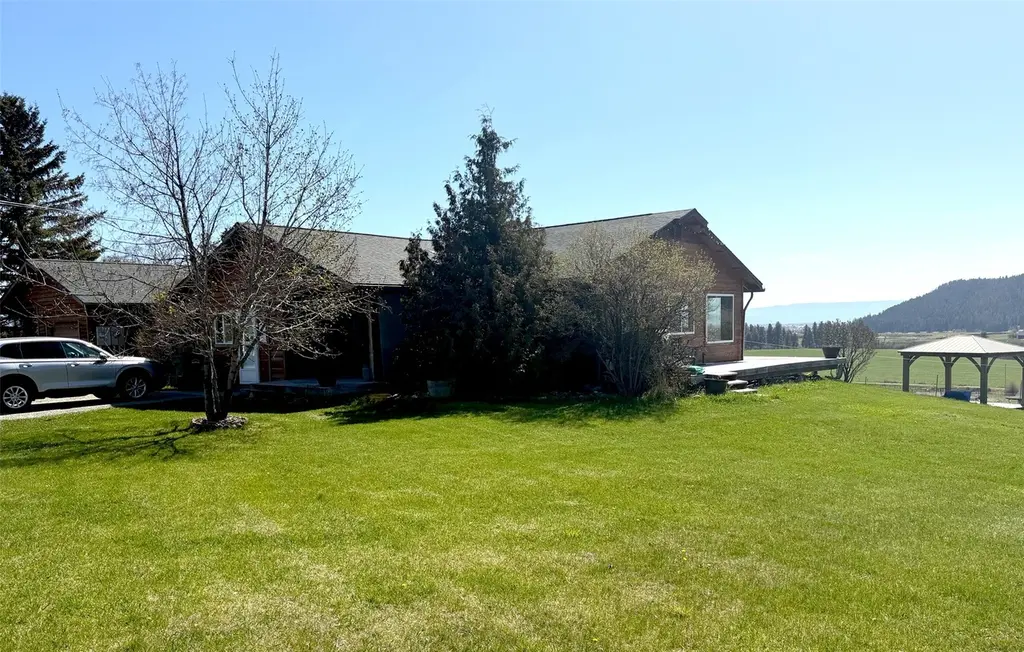
1662 & 1660 US Hwy 2 W · Kalispell, MT
Flood risk 1/10 · Minimal
- FEMA flood zone
- X (unshaded)
- Chance of flooding over 30 yrs
- 0.0%
- Est. flood insurance / yr
- $473 – $860
Fire risk 6/10 · Moderate
- Est. fire insurance / yr
- $918 – $1,706
Heat risk 2/10 · Minimal
- Hot days now (above 90°F)
- 7 days/yr
- Hot days in 30 yrs
- 16 days/yr
Wind risk 1/10 · Minimal
- Chance of severe wind over 30 yrs
- —
Air-quality risk 8/10 · Major
- Unhealthy air days now
- 13 days/yr
- Unhealthy air days in 30 yrs
- 16 days/yr
Risk factors via First Street. Map © Google.
Why this score? — see what drove the D+ grade
The composite is a weighted blend of 9 inputs, each scored 0–100. Each bar is that input's sub-score; the figure is the points it added to the 100-point composite (weight × sub-score).
- Cash flow +16.4/30.0
- ARV discount +7.5/15.0
- DSCR +5.1/10.0
- Livability +3.6/5.0
- 1% rule +3.5/10.0
- Schools +3.5/10.0
- Rent growth +3.1/5.0
- Condition / age +2.5/5.0
- Appreciation +0.0/10.0
$699,000
🖨 Deal sheet 📄 Offer letter ✓ Due diligence
Multi-family units
County records classify this as Multi-Family (5+ Unit). Listing-text estimate: 3 units. estimate disagrees with records
5+ unit building — per-unit beds/baths from public records are typically unavailable; the breakdown below (if shown) is an estimate from the listing text.
Key facts
- Separate utilities
- Garden
- Private entrance
Tags
Property features AI
Exterior
- Parking: Attached or detached garage (1 garage space)
- Utilities: Private well water; Private sewer / septic tank; Electricity connected; Cable available; Phone available
- Home design: Duplex (residential income); 2 units
- Construction: Wood siding; Built with concrete basement
- Exterior features: Storage; Rolling topography; Back yard and front yard; Bluff and meadow areas; Gentle sloping yard; Highway frontage; Asphalt road access; Views
Interior
- Kitchen: Dishwasher; Range; Refrigerator
- Bedrooms: 4 bedrooms (property total)
- Bathrooms: 3 bathrooms (property total)
- Interior features: High-speed internet; Fireplace; Daylight, finished partial basement with concrete floor; Storage
- Laundry & utility: Washer hookup
Heating & cooling
- Heating & cooling: Baseboard heating; Electric heating; Wall furnace
Neighborhood map
What this means for you Summary
Snapshot
- This is a 3 × 2-bed/?-bath units multifamily listed at $699k.
Deal economics
- At list price, monthly cash flow is $391 ($5k/yr) — positive. Per door: $130/mo.
- The deal already cash-flows at list — no discount required.
- To meet the 1% rule (rent ≥ 1% of price), the offer needs to be $595k (14.9% below list).
- Recommended offer: $595k (14.9% below list) — sets the bar for 1% rule.
- Cap rate 7.0% vs local median 2.1% in Kalispell — top-decile yield for the area; either an underpriced asset or a hidden risk that comps aren't pricing in. Stress-test before assuming the spread holds.
Location & tenants
- Location reads 72/100 on livability (#61 in MT) — a middle-class / working-renter tenant base. Strengths: health & safety A+, cost of living A, housing A-; Watch: crime C-, commute F, employment D-.
- Flathead H S (town): math 29% / reading 52% proficiency, ranked #55 of 116 in MT (top 47%) — families likely to look elsewhere, expect single-tenant / working-renter base with shorter leases.
- Market conditions: Rents rising (+2.4%/yr); 683 active listings in the ZIP; 281 units permitted in Flathead County in 2024 (80 in 5+ unit buildings).
- At $5,948/mo this rent would consume 98% of the median local household income ($73k/yr) (locally 1577% of renters already pay >50% of income on rent) — very limited rent-growth headroom before tenants either downsize or default.
Forward outlook
- Local home prices are declining (-3.0%/yr); year-one equity from $5k of loan paydown is wiped out by about $21k of value loss. Plan a longer hold.
- Flathead County population projected at +20% by 2050 — long-run rental-demand tailwind backs the buy-and-hold thesis.
Negotiation context
- It's been on market 49 days — a 3% lower offer ($678k) is reasonable based on typical stale-listing flexibility.
- 2 sale attempts with the ask held roughly flat each time — persistent listings suggest the price (not the market) is what's stuck; bring a comps-based counter.
Risks & watch-outs
- Climate carrying-cost: major wildfire risk — expect insurance premiums to compound above CPI over the hold.
Questions for the listing agent
- It's been on market 49 days. Have you received any prior offers? Is the seller open to a 15% concession, seller financing, or rate buy-down credit?
- Can we see the unit-by-unit rent roll, current vacancy, and any below-market leases? What's the average tenancy length?
- What capital expenditures (roof, boiler, parking lot, exteriors) have been made in the last 5 years, and what's planned in the next 2?
- Is there a deadline driving the sale (1031 exchange, divorce, estate, relocation)? That informs how much negotiation room exists.
- Schools are B-rated — typically a magnet for longer-tenancy family renters. What's the average tenant stay here, and is there a school-zone premium baked into asking?
- The area grade is low — what's the realistic commute time and amenity access for the typical tenant pool here? Any planned neighborhood developments (good or bad) we should know about?
- What's the average days-on-market for RENTAL listings here right now (not sales)? A rising rental-DOM trend means longer vacancies and softer asking-rent achievability than the comps imply.
- What's the recent tenant-quality profile in this submarket — average credit score on applications, eviction rate, late-payment / NSF rate, and stable-employment percentage? A property-management company in the area should have these aggregated.
- How much new apartment / multifamily construction is in the pipeline within 1–3 miles? Heavy new supply (>2% of stock underway) typically softens rents 12–24 months out; light construction supports rent growth.
Investment metrics
- 1% rule
- 0.85% ✗
- Cap rate
- 6.96%
- Cash-on-cash
- 2.40%
- DSCR
- 1.11
- GRM
- 9.8
CMA / ARV
No comps found within radius.
Projected returns pro-forma
-3.0% appreciation · 2.41% rent growth · sell at horizon
- IRR
- -13.1%
- Equity multiple
- 0.53×
- Total profit
- $-92,126
- Equity at exit
- $104,223
- IRR
- -5.1%
- Equity multiple
- 0.68×
- Total profit
- $-63,355
- Equity at exit
- $60,437
Cash invested: $195,720 (down + closing). Projections, not guarantees.
Landlord ↔ Tenant lean methodology
- Overall (STATE)
- 82 Strongly Landlord-Friendly
- State Montana
- 82 Strongly Landlord-Friendly · R+11
- County
- — inherits STATE
- City
- — inherits STATE
ZIP-level market 59901
- Rents YoY
- 2.4%
- Active inventory
- 683
- Price-to-rent
- 29.4×
Monthly cashflow live
- Estimated rent
- $5,948 medium interval (Pro) →
- Mortgage (P&I)
- −$3,666
- Tax from tax record
- −$351 /mo · $4,216/yr
- Insurance
- −$291
- HOA
- −$0
- Vacancy / Maint / Mgmt
- −$1,249
- Net cashflow
- $391
Break-even live
3-unit breakdown (identical units grouped — click to expand)
| Units | Beds | Baths | Est. rent |
|---|---|---|---|
| 3× units | 2 | — | $5,949 |
| #1 | 2 | — | $1,983 |
| #2 | 2 | — | $1,983 |
| #3 | 2 | — | $1,983 |
| Total (3 units) | $5,948 | ||
UW: 25.0% down · 7.5% · 30yr · 1.5% tax · 5.0% vac · 8.0% maint · 8.0% mgmt
Financing live
Cash to close
- Down payment
- $174,750
- Closing costs
- $20,970
- Reserves months
- —
- Total cash needed
- —
Loan-product check · same deal, 3 products live
Conventional
25% down · 7.5% · 30yr
- Down + closing
- —
- Monthly P&I
- —
- Monthly cashflow
- —
- DSCR
- —
- Eligible?
- —
Personal DTI + credit; lowest rate.
DSCR
20% down · 8.5% · 30yr
- Down + closing
- —
- Monthly P&I
- —
- Monthly cashflow
- —
- DSCR
- —
- Eligible?
- —
No personal income docs; deal must DSCR.
Hard money
10% down · 12.0% · 12mo
- Down + closing
- —
- Monthly P&I
- —
- Monthly cashflow
- —
- DSCR
- —
- Eligible?
- —
Short-term bridge; refi at stabilization.
Listing history 21 events
-
2026-06-19days on market $699,000 Active 49 DOM
-
2026-06-18days on market $699,000 Active 48 DOM
-
2026-06-17days on market $699,000 Active 47 DOM
-
2026-06-16days on market $699,000 Active 46 DOM
-
2026-06-15days on market $699,000 Active 45 DOM
-
2026-06-14days on market $699,000 Active 43 DOM
-
2026-06-13days on market $699,000 Active 42 DOM
-
2026-06-10days on market $699,000 Active 40 DOM
-
2026-06-09days on market $699,000 Active 39 DOM
-
2026-06-08days on market $699,000 Active 38 DOM
-
2026-06-07days on market $699,000 Active 37 DOM
-
2026-06-05days on market $699,000 Active 34 DOM
-
2026-06-03days on market $699,000 Active 33 DOM
-
2026-06-02days on market $699,000 Active 32 DOM
-
2026-06-01days on market $699,000 Active 31 DOM
-
2026-05-31days on market $699,000 Active 30 DOM
-
2026-05-30days on market $699,000 Active 29 DOM
-
2026-05-01$699,000 Active
-
2025-05-20price $799,000
-
2025-04-29$825,000 Active
-
2024-08-19soldstatus
ⓘ Source: listings_history table (triggers on properties + properties_extension) + one-shot
backfill from property_details.listing_events for pre-trigger history.
Tax reassessment forecast MT · Resets to sale price
- Current annual tax
- $4,216 · $351/mo
- Projected year-2 tax
- $5,872 · $489/mo
- Expected delta
- +$1,655/yr (+$138/mo · 39.3%)
ⓘ Screening estimate from a state-policy table — verify with the county assessor before closing.
Climate risk First Street
- Flood 1/10 Low FEMA zone X (unshaded) · 0% chance over 30 yrs
- Wildfire 6/10 Major
- Heat 2/10 Low 7 d/yr ≥90°F today · 16 d/yr by 30 yrs out
- Wind 1/10 Low
- Air quality 8/10 Severe 13 unhealthy d/yr today · 16 by 30 yrs out
Nearby sold comps map
Loading sold comps map…
Walkable amenities ~0.75 mi
Loading nearby amenities…
Taxation est. · year 1
- Rental income
- $71,376
- − Mortgage interest
- −$39,155
- − Property taxes
- −$4,216
- − Insurance
- −$3,495
- − Repairs & maintenance
- −$5,710
- − Management
- −$5,710
- − Depreciation
- −$20,335
- Taxable loss
- −$7,245
- Est. tax savings @ 24.0%
- +$1,739
- After-tax cash flow
- $6,427/yr
For passive investors: Depreciation is non-cash, so a rental often shows a tax loss while cash-flowing — sheltering income. Rental losses are passive: they offset passive income freely, and up to $25,000/yr can offset ordinary (W-2) income if you actively participate and your MAGI is under $100k (phasing out to $0 by $150k); unused losses carry forward. On sale, claimed depreciation is recaptured at up to 25%, and gains may owe capital-gains tax (a 1031 exchange can defer both). Figures are a year-1 estimate at your 24.0% rate — not tax advice; consult a CPA.
Schools (NCES district)
- District
- Flathead H S
- NCES district ID
- 3015420
- Math proficiency
- 29% ▼ -6.00%
- Reading proficiency
- 52% ▼ -3.00%
- Median HH income
- $49,712
- Composite
- 34.79/100
- National rank
- #5115
- State rank
- #55 of 116 in MT
Livability — Kalispell
- Score
- 72/100
- State rank
- #61
- US rank
- #6399
Category grades
Schools grade is shown separately in the Schools card above.
Census & demographics
- County
- Flathead County · 94,027 people
- City population
- 63,161
- Metro
- Kalispell, MT
- Population (ZIP)
- 63,161
- Household income
- $72,523
- Rent vs Own
- Severe rent burden
- 1577.0
Population outlook (Flathead County) Hauer SSP2
- Today (2025)
- 108,002 people
- By 2030
- 113,362 · +5.0%
- By 2040
- 122,245 · +13.2%
- By 2050
- 129,517 · +19.9%
- By 2075
- 146,737 · +35.9%
- By 2100
- 155,045 · +43.6%
Race, ethnicity, and origin ACS 2023
- Neighborhood character
- Predominantly White (89%)
- Race & ethnicity
- White 89% Two or more races 6% Hispanic / Latino 4% Native American 1% Asian 1%
- Common ancestry
- Portuguese 9% Slovak 3% Lithuanian 3%
- Foreign-born
- 3% · Canada, China
- Languages at home
- 96% English-only · Spanish 1% German/W. Germanic 0%
Political lean MEDSL · Flathead
- 2024 margin
- Solid R (+33.8) · D 31.8% · R 65.5% · Other 2.7%
- 2008→2024 swing
- -12.2pp toward R · 2008: -21.6pp · 2024: -33.8pp
- All cycles
- 2024: R+33.8 2020: R+29.9 2016: R+36.5 2012: R+33.4 2008: R+21.6
Not yet ingested
- Civics
- —
Market trends
- HPI YoY
- ▼ -698.78%
- Current HPI
- 225.6792
- Rent YoY
- ▲ 2.41%
- Metro
- Kalispell, MT
- State GDP YoY
- ▲ 3.41%
- F500 in state
- 2
Industry mix (Fortune 500 HQ in MT)
| Industry | F500 HQs | Revenue |
|---|---|---|
| Technology / Analytics | 1 | $2B |
|
||
Price history
-15.3% since first listed4 events — show timeline
- 2026-05-01 Listed $699,000 MRMLS
- 2025-05-20 Price Changed $799,000 MRMLS
- 2025-04-29 Listed $825,000 MRMLS
- 2024-08-19 Sold (Public Records) — Public Records
Property tax history
+3.8%/yrLatest (2025): $4,216 · -9.9% YoY. Source: county tax records.
Cash-flow waterfall
monthlySold comps — $/sqft
last 12 mo · ≤1 miLoading sold comps…