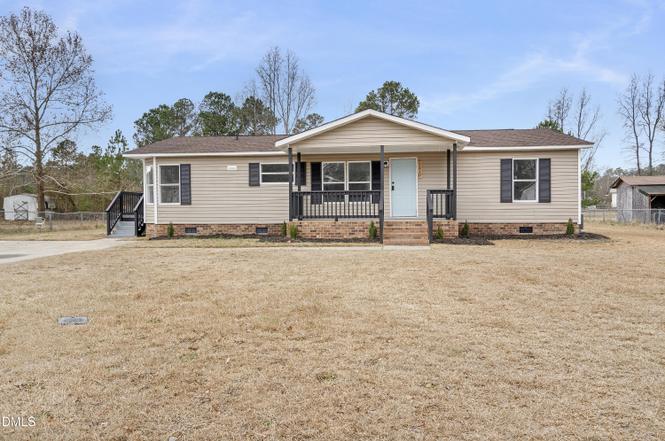
1410 Darby Dr · Fayetteville, NC
Flood risk 4/10 · Minor
- FEMA flood zone
- X (unshaded)
- Chance of flooding over 30 yrs
- 0.24%
- Est. flood insurance / yr
- $507 – $1,088
Fire risk 6/10 · Moderate
- Est. fire insurance / yr
- $906 – $1,684
Heat risk 7/10 · Major
- Hot days now (above 106°F)
- 7 days/yr
- Hot days in 30 yrs
- 16 days/yr
Wind risk 7/10 · Major
- Chance of severe wind over 30 yrs
- 78.0%
Air-quality risk 1/10 · Minimal
- Unhealthy air days now
- 0 days/yr
- Unhealthy air days in 30 yrs
- 0 days/yr
Risk factors via First Street. Map © Google.
Why this score? — see what drove the C grade
The composite is a weighted blend of 9 inputs, each scored 0–100. Each bar is that input's sub-score; the figure is the points it added to the 100-point composite (weight × sub-score).
- Cash flow +24.5/30.0
- DSCR +7.9/10.0
- ARV discount +7.8/15.0
- 1% rule +5.1/10.0
- Livability +3.8/5.0
- Schools +3.2/10.0
- Rent growth +3.0/5.0
- Condition / age +2.5/5.0
- Appreciation +0.0/10.0
$179,100
🖨 Deal sheet 📄 Offer letter ✓ Due diligence
Listing remarks
Welcome Home to Raeford! Discover a comfortable place to settle in, surrounded by the everyday charm of Raeford living. This home offers an inviting environment where you can unwind, spend time with loved ones, and make space for the routines and moments that matter most. * Spring Special, ask us what we are offering for this season!
Key facts
- Built 1996
- Listed 205 days
Property features AI
Finance
- Other: Living area approximately 1,296 (above-grade finished area 1,296); Lot reported as 0 acres / 0 square feet (per listing data)
- HOA & community: No homeowners association
Exterior
- Utilities: Public water; Septic tank sewer
- Home design: Manufactured house, single-story
- Construction: Vinyl siding and other exterior materials; Built as a manufactured home
- Exterior features: Shingle roof; Permanent foundation
Interior
- Bedrooms: 3 bedrooms (all on the main level)
- Flooring: Carpet; Laminate; Vinyl
- Bathrooms: 2 full bathrooms
- Heating & cooling: Heat pump heating; Central air conditioning
- Interior features: Carpet, laminate, and vinyl flooring
Neighborhood map
What this means for you Summary
Snapshot
- This is a 3-bed/2.0-bath manufactured listed at $179k.
Deal economics
- At list price, monthly cash flow is $368 ($4k/yr) — positive.
- The deal already cash-flows at list — no discount required.
- Meets the 1% rule at list price ($2k rent vs $179k).
- Recommended offer: $158k (12.0% below list) — sets the bar for market timing.
- Cap rate 8.8% vs local median 4.9% in Fayetteville — top-decile yield for the area; either an underpriced asset or a hidden risk that comps aren't pricing in. Stress-test before assuming the spread holds.
Location & tenants
- Location reads 75/100 on livability (#45 in NC, #4,031 nationally) — a middle-class / working-renter tenant base. Strengths: commute A+, cost of living A+, housing A+; Watch: crime F, employment D-.
- Hoke County Schools (suburban): math 35% / reading 40% proficiency, ranked #123 of 178 in NC (top 69%) — families likely to look elsewhere, expect single-tenant / working-renter base with shorter leases.
- Zoned schools: Hoke County High (math 42% / reading 44%, grade F, #372 of 535 statewide, top 69%, 2,060 students, 100% FRL) — zoned schools average 100% FRL vs 57% district-wide (43 pts higher); higher-poverty schools than district average — tighter screening recommended.
- Market conditions: Rents rising (+1.9%/yr); 566 active listings in the ZIP; 8 comparable units currently listed for rent nearby; rentals leasing fast (median 14d on market — plan ~1-2 weeks tenant-placement turnaround); 685 units permitted in Hoke County in 2024 (0 in 5+ unit buildings).
- This rent runs 33% of the median local income ($66k/yr) — at the standard rent-burdened threshold; future hikes will face affordability resistance.
Forward outlook
- Local home prices are declining (-3.0%/yr); year-one equity from $1k of loan paydown is wiped out by about $5k of value loss. Plan a longer hold.
- Hoke County population projected at +36% by 2050 — long-run rental-demand tailwind backs the buy-and-hold thesis.
Negotiation context
- It's been on market 206 days — a 12% lower offer ($158k) is reasonable based on typical stale-listing flexibility.
- 5 sale attempts with the ask held roughly flat each time — persistent listings suggest the price (not the market) is what's stuck; bring a comps-based counter.
Risks & watch-outs
- Climate carrying-cost: major wind risk, 78% chance of damaging wind over 30y; major wildfire risk; extreme-heat days projected 7→16/yr by 2055 (HVAC capex compounding) — expect insurance premiums to compound above CPI over the hold.
Questions for the listing agent
- It's been on market 206 days. Have you received any prior offers? Is the seller open to a 12% concession, seller financing, or rate buy-down credit?
- Why hasn't it sold? Are there any deal-killer items the seller is aware of (foundation, flood, title, zoning, code violations)?
- Is there a deadline driving the sale (1031 exchange, divorce, estate, relocation)? That informs how much negotiation room exists.
- Crime grade is F in this area — have there been break-ins, vandalism, or insurance claims at this property in the last 3 years? What carrier currently insures it and at what premium?
- What's the average days-on-market for RENTAL listings here right now (not sales)? A rising rental-DOM trend means longer vacancies and softer asking-rent achievability than the comps imply.
- What's the recent tenant-quality profile in this submarket — average credit score on applications, eviction rate, late-payment / NSF rate, and stable-employment percentage? A property-management company in the area should have these aggregated.
- How much new for-sale + rental construction is in the pipeline within 1–3 miles? Heavy new supply typically softens prices + rents 12–24 months out; constrained supply supports both.
Investment metrics
- 1% rule
- 1.01% ✓
- Cap rate
- 8.76%
- Cash-on-cash
- 8.81%
- DSCR
- 1.39
- GRM
- 8.2
CMA / ARV
- ARV (on-the-fly)
- $180,144
- Comps found
- 12
Show comp detail 12 sales within ~0.75 mi
| Address | Dist | Beds/Ba | Sqft | Sold | Price | $/sf | Match |
|---|---|---|---|---|---|---|---|
| 2002 Mcguire Dr | 0.19mi | 3/2.0 | 1,296 (0%) | 7mo | $190,000 | $147 | 86 |
| 2410 Ohara Dr | 0.28mi | 3/2.0 | 1,290 (-0%) | 2mo | $192,000 | $149 | 85 |
| 700 Mackay Ct | 0.16mi | 3/2.0 | 1,227 (-5%) | 4mo | $170,000 | $139 | 80 |
| 709 Mackay Ct | 0.14mi | 3/2.0 | 1,210 (-7%) | 6mo | $173,000 | $143 | 77 |
| 2207 Keen Ct | 0.28mi | 3/2.0 | 1,326 (+2%) | 8mo | $165,000 | $124 | 76 |
| 403 Mcdougald Dr | 0.35mi | 3/2.0 | 1,209 (-7%) | 9mo | $162,000 | $134 | 65 |
| 419 Mcdougald Dr | 0.48mi | 3/2.0 | 1,120 (-14%) | 2mo | $65,000 | $58 | 53 |
| 2910 Donegal Dr | 0.57mi | 3/2.0 | 1,439 (+11%) | 8mo | $180,000 | $125 | 49 |
| 529 Dunrobin Dr | 0.49mi | 3/2.0 | 1,118 (-14%) | 9mo | $142,000 | $127 | 47 |
| 1013 Dunvegan Dr | 0.57mi | 3/2.0 | 1,120 (-14%) | 8mo | $168,000 | $150 | 44 |
| 2639 O'glesby Dr | 0.63mi | 3/2.0 | 1,120 (-14%) | 6mo | $120,000 | $107 | 42 |
| 2458 O'hara Dr | 0.66mi | 3/2.0 | 1,109 (-14%) | 5mo | $160,000 | $144 | 41 |
Match score weights: distance 35% · size 25% · config 20% · recency 20%. Top-matched comps best support the ARV.
Projected returns pro-forma
-3.0% appreciation · 1.92% rent growth · sell at horizon
- IRR
- -4.1%
- Equity multiple
- 0.85×
- Total profit
- $-7,600
- Equity at exit
- $26,704
- IRR
- 4.4%
- Equity multiple
- 1.31×
- Total profit
- $15,426
- Equity at exit
- $15,485
Cash invested: $50,148 (down + closing). Projections, not guarantees.
Landlord ↔ Tenant lean methodology
- Overall (STATE)
- 85 Strongly Landlord-Friendly
- State North Carolina
- 85 Strongly Landlord-Friendly · R+3
- County
- — inherits STATE
- City
- — inherits STATE
ZIP-level market 28376
- Home prices YoY
- -24.0%
- Rents YoY
- 1.9%
- Active inventory
- 566
- Price-to-rent
- 8.2×
Monthly cashflow live
- Estimated rent
- $1,815 high interval (Pro) →
- Mortgage (P&I)
- −$939
- Tax from tax record
- −$51 /mo · $618/yr
- Insurance
- −$75
- HOA
- −$0
- Vacancy / Maint / Mgmt
- −$381
- Net cashflow
- $368
Break-even live
UW: 25.0% down · 7.5% · 30yr · 1.5% tax · 5.0% vac · 8.0% maint · 8.0% mgmt
Financing live
Cash to close
- Down payment
- $44,775
- Closing costs
- $5,373
- Reserves months
- —
- Total cash needed
- —
Loan-product check · same deal, 3 products live
Conventional
25% down · 7.5% · 30yr
- Down + closing
- —
- Monthly P&I
- —
- Monthly cashflow
- —
- DSCR
- —
- Eligible?
- —
Personal DTI + credit; lowest rate.
DSCR
20% down · 8.5% · 30yr
- Down + closing
- —
- Monthly P&I
- —
- Monthly cashflow
- —
- DSCR
- —
- Eligible?
- —
No personal income docs; deal must DSCR.
Hard money
10% down · 12.0% · 12mo
- Down + closing
- —
- Monthly P&I
- —
- Monthly cashflow
- —
- DSCR
- —
- Eligible?
- —
Short-term bridge; refi at stabilization.
Rent comps 8 comps
| Address | Beds | Baths | Sqft | Rent | $/sqft | DOM | Units | Dist |
|---|---|---|---|---|---|---|---|---|
| 1502 Clan Campbell Dr Raeford, NC | 3.0 | 2.0 | 1296 | $1,395 | $1.08 | 13d | 1 | 0.40mi |
| 1552 Clan Campbell Dr Raeford, NC | 3.0 | 2.0 | 1241 | $1,695 | $1.37 | 13d | 1 | 0.75mi |
| 1002 South Pointe Dr Raeford, NC | 1.0–3.0 | 1.0–2.0 | 1074 | $1,920 | $1.79 | 13d | 24 | 0.79mi |
| 140 Verdmont Dr Raeford, NC | 3.0 | 2.5 | 1856 | $2,200 | $1.19 | 23d | 1 | 0.89mi |
| 109 Timberidge Dr Raeford, NC | 3.0 | 2.0 | 1384 | $1,765 | $1.28 | 13d | 1 | 0.92mi |
| 334 Woodberry Cir Raeford, NC | 3.0 | 2.0 | 1598 | $1,650 | $1.03 | 13d | 1 | 1.29mi |
| 9000 Stone Gate Dr Raeford, NC | 1.0–3.0 | 1.0–2.0 | 1029 | $1,757 | $1.71 | 13d | 12 | 1.37mi |
| 105 Joseph Dr Raeford, NC | 3.0 | 2.0 | 1152 | $1,275 | $1.11 | 23d | 1 | 1.45mi |
Listing history 32 events
-
2026-06-18days on market $179,100 Active 206 DOM
-
2026-06-17days on market $179,100 Active 205 DOM
-
2026-06-16days on market $179,100 Active 204 DOM
-
2026-06-15days on market $179,100 Active 203 DOM
-
2026-06-14days on market $179,100 Active 201 DOM
-
2026-06-13days on market $179,100 Active 200 DOM
-
2026-06-10days on market $179,100 Active 198 DOM
-
2026-06-09days on market $179,100 Active 197 DOM
-
2026-06-08days on market $179,100 Active 196 DOM
-
2026-06-07days on market $179,100 Active 195 DOM
-
2026-06-05days on market $179,100 Active 192 DOM
-
2026-06-03days on market $179,100 Active 191 DOM
-
2026-06-02days on market $179,100 Active 190 DOM
-
2026-06-01days on market $179,100 Active 189 DOM
-
2026-05-31days on market $179,100 Active 188 DOM
-
2026-05-30days on market $179,100 Active 187 DOM
-
2026-03-21price $179,100
-
2026-03-13price $179,200
-
2026-03-08price $179,300
-
2026-02-26price $179,400
-
2025-12-23status Active
-
2025-12-10historical Active Under Contract
-
2025-12-05status Pending
-
2025-11-16$179,500 Active
-
2025-09-10price $179,500
-
2025-08-20price $179,700
-
2025-08-14price $179,800
-
2025-05-26status Active
-
2025-05-05status Pending
-
2025-04-04status Active
-
2025-03-16status Pending
-
2025-02-06$179,900 Active
ⓘ Source: listings_history table (triggers on properties + properties_extension) + one-shot
backfill from property_details.listing_events for pre-trigger history.
Tax reassessment forecast NC · Resets to sale price
- Current annual tax
- $618 · $51/mo
- Projected year-2 tax
- $1,469 · $122/mo
- Expected delta
- +$851/yr (+$71/mo · 137.8%)
ⓘ Screening estimate from a state-policy table — verify with the county assessor before closing.
Climate risk First Street
- Flood 4/10 Moderate FEMA zone X (unshaded) · 24% chance over 30 yrs
- Wildfire 6/10 Major
- Heat 7/10 Severe 7 d/yr ≥106°F today · 16 d/yr by 30 yrs out
- Wind 7/10 Severe 78% chance of damaging wind over 30 yrs
- Air quality 1/10 Low 0 unhealthy d/yr today · 0 by 30 yrs out
Nearby sold comps map
Loading sold comps map…
Walkable amenities ~0.75 mi
Loading nearby amenities…
Taxation est. · year 1
- Rental income
- $21,775
- − Mortgage interest
- −$10,032
- − Property taxes
- −$618
- − Insurance
- −$896
- − Repairs & maintenance
- −$1,742
- − Management
- −$1,742
- − Depreciation
- −$5,210
- Taxable income
- $1,535
- Est. tax owed @ 24.0%
- −$368
- After-tax cash flow
- $4,050/yr
For passive investors: Depreciation is non-cash, so a rental often shows a tax loss while cash-flowing — sheltering income. Rental losses are passive: they offset passive income freely, and up to $25,000/yr can offset ordinary (W-2) income if you actively participate and your MAGI is under $100k (phasing out to $0 by $150k); unused losses carry forward. On sale, claimed depreciation is recaptured at up to 25%, and gains may owe capital-gains tax (a 1031 exchange can defer both). Figures are a year-1 estimate at your 24.0% rate — not tax advice; consult a CPA.
Schools (NCES district)
- District
- Hoke County Schools
- NCES district ID
- 3702250
- Math proficiency
- 35% ▼ -1.00%
- Reading proficiency
- 40% ▲ 1.00%
- Median HH income
- $43,896
- Composite
- 31.82/100
- National rank
- #5880
- State rank
- #123 of 178 in NC
Livability — Fayetteville
- Score
- 75/100
- State rank
- #45
- US rank
- #4031
Category grades
Schools grade is shown separately in the Schools card above.
Census & demographics
- County
- Hoke County · 44,880 people
- City population
- 226,118
- Metro
- Fayetteville, NC
- Population (ZIP)
- 44,880
- Household income
- $66,471
- Rent vs Own
- Severe rent burden
- 897.0
Population outlook (Hoke County) Hauer SSP2
- Today (2025)
- 63,354 people
- By 2030
- 68,361 · +7.9%
- By 2040
- 78,074 · +23.2%
- By 2050
- 86,384 · +36.4%
- By 2075
- 99,517 · +57.1%
- By 2100
- 98,939 · +56.2%
Race, ethnicity, and origin ACS 2023
- Neighborhood character
- Highly diverse neighborhood (Simpson 0.71)
- Race & ethnicity
- White 38% Black 35% Hispanic / Latino 15% Two or more races 9% Native American 3% Asian 1%
- Hispanic origin (detail)
- Mexican 7% Puerto Rican 4%
- Common ancestry
- Slovak 2% Romanian 1% Italian 1%
- Foreign-born
- 6% · Canada, Vietnam
- Languages at home
- 89% English-only · Spanish 8% French/Haitian/Cajun 1%
Political lean MEDSL · Hoke
- 2024 margin
- Lean D (+5.9) · D 52.4% · R 46.4% · Other 1.2%
- 2008→2024 swing
- -12.8pp toward R · 2008: 18.8pp · 2024: 5.9pp
- All cycles
- 2024: D+5.9 2020: D+10.9 2016: D+10.8 2012: D+19.0 2008: D+18.8
Not yet ingested
- Civics
- —
Market trends
- HPI YoY
- ▼ -53.30%
- Current HPI
- 169.1801
- Rent YoY
- ▲ 1.92%
- Metro
- Fayetteville, NC
- State GDP YoY
- ▲ 3.28%
- F500 in state
- 26
Industry mix (Fortune 500 HQ in NC)
| Industry | F500 HQs | Revenue |
|---|---|---|
| Financial Services | 2 | $213B |
|
||
| Retail | 2 | $95B |
|
||
| Industrial Conglomerate | 1 | $38B |
|
||
| Metals / Steel | 1 | $35B |
|
||
| Utilities | 1 | $30B |
|
||
| Industrial Machinery | 1 | $19B |
|
||
Price history
-0.4% since first listed16 events — show timeline
- 2026-03-21 Price Changed $179,100 TMLS
- 2026-03-13 Price Changed $179,200 TMLS
- 2026-03-08 Price Changed $179,300 TMLS
- 2026-02-26 Price Changed $179,400 TMLS
- 2025-12-23 Relisted — TMLS
- 2025-12-10 Contingent — TMLS
- 2025-12-05 Pending — TMLS
- 2025-11-16 Listed $179,500 TMLS
- 2025-09-10 Price Changed $179,500 LPRMLS
- 2025-08-20 Price Changed $179,700 LPRMLS
- 2025-08-14 Price Changed $179,800 LPRMLS
- 2025-05-26 Relisted — LPRMLS
- 2025-05-05 Pending — LPRMLS
- 2025-04-04 Relisted — LPRMLS
- 2025-03-16 Pending — LPRMLS
- 2025-02-06 Listed $179,900 LPRMLS
Property tax history
+1.8%/yrLatest (2025): $618 · +0.0% YoY. Source: county tax records.
Cash-flow waterfall
monthlySold comps — $/sqft
last 12 mo · ≤1 miLoading sold comps…