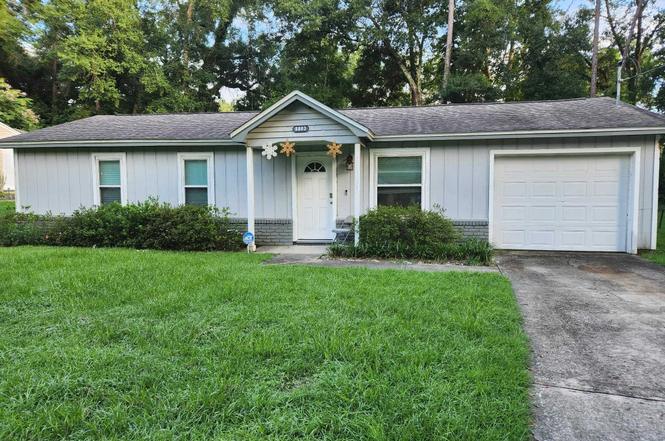
5803 Jodphur Ct · Tallahassee, FL
Flood risk 1/10 · Minimal
- FEMA flood zone
- X (unshaded)
- Chance of flooding over 30 yrs
- 0.0%
- Est. flood insurance / yr
- $507 – $1,088
Fire risk 3/10 · Minor
- Est. fire insurance / yr
- $947 – $1,759
Heat risk 8/10 · Major
- Hot days now (above 108°F)
- 7 days/yr
- Hot days in 30 yrs
- 20 days/yr
Wind risk 9/10 · Severe
- Chance of severe wind over 30 yrs
- 99.0%
Air-quality risk 5/10 · Moderate
- Unhealthy air days now
- 7 days/yr
- Unhealthy air days in 30 yrs
- 7 days/yr
Risk factors via First Street. Map © Google.
Why this score? — see what drove the C+ grade
The composite is a weighted blend of 9 inputs, each scored 0–100. Each bar is that input's sub-score; the figure is the points it added to the 100-point composite (weight × sub-score).
- Cash flow +23.2/30.0
- ARV discount +12.1/15.0
- DSCR +7.4/10.0
- 1% rule +5.3/10.0
- Schools +4.3/10.0
- Livability +4.3/5.0
- Rent growth +3.3/5.0
- Condition / age +2.5/5.0
- Appreciation +0.0/10.0
$162,000
🖨 Deal sheet (PDF) 📄 Offer letter ✓ Due diligence
Listing remarks MLS
MULTIPLE OFFERS SITUATION: Please submit highest and best offers by 5:00 PM EST 10/6/2020. Incredible opportunity and price on a fully renovated 3 bedroom/2 bathroom with 1 car garage home on a quiet cul-de-sac! New roof, HVAC, septic drain field, windows, doors, appliances(including washer/dryer), kitchen, bathrooms, electrical panel, water heater, floors, paint, and fixtures. Move in ready home features beautiful renovations throughout with low maintenance LVT floors. Home is charming and lives large for its size! Renovated kitchen with new cabinets, countertops, and appliances features new sliding glass door that opens to patio with views of large backyard. Go and show. Listing agent is part owner. As-is sale but home is in great shape.
Key facts
- 0.23 acre lot
- Garage
- Built 1982
Property features AI
Finance
- Financial info: Offered for sale
Exterior
- Parking: One-car garage
- Utilities: Septic tank
- Home design: Single-story; Brick and wood siding exterior
- Construction: Brick and wood siding construction
- Exterior features: Patio; Partial fencing; Paved road access
Interior
- Kitchen: Dishwasher; Refrigerator; Stove
- Bedrooms: Bedroom 2 (10x9); Bedroom 3 (10x9); Additional room (13x11)
- Bathrooms: 2 full bathrooms
- Interior features: Living room; Family room; Dining room
Neighborhood map
What this means for you Summary
Snapshot
- This is a 3-bed/2.0-bath single-family listed at $162k.
Deal economics
- At list price, monthly cash flow is $293 ($4k/yr) — positive.
- The deal already cash-flows at list — no discount required.
- Meets the 1% rule at list price ($2k rent vs $162k).
- Recommended offer: $143k (12.0% below list) — sets the bar for market timing.
- Cap rate 8.5% vs local median 4.2% in Tallahassee — top-decile yield for the area; either an underpriced asset or a hidden risk that comps aren't pricing in. Stress-test before assuming the spread holds.
Location & tenants
- Location reads 86/100 on livability (#19 in FL, #429 nationally) — a professional / high-income tenant draw. Strengths: amenities A+, commute A+, health & safety A+; Watch: employment D.
- Leon (urban): math 48% / reading 53% proficiency, ranked #33 of 73 in FL (top 45%) — acceptable for families but not a draw, mixed tenant base, ~2y average lease.
- Zoned schools: Springwood Elementary School (math 32% / reading 31%, grade F, #1,841 of 2,144 statewide, top 86%, 423 students, 69% FRL); Griffin Middle School (math 16% / reading 25%, grade F, #556 of 571 statewide, top 98%, 532 students, 77% FRL); Amos P. Godby High School (math 24% / reading 32%, grade F, #464 of 667 statewide, top 70%, 1,444 students, 63% FRL) — zoned schools average 70% FRL vs 45% district-wide (25 pts higher); higher-poverty schools than district average — tighter screening recommended.
- Zoned-school proficiency averages 27% at this address vs 50% district-wide (-24 pts) — the specific schools serving this property underperform the Leon average; the district grade overstates school quality for this exact location.
- Market conditions: Rents rising (+3.1%/yr); 238 active listings in the ZIP; 1 comparable units currently listed for rent nearby; 1,765 units permitted in Leon County in 2024 (975 in 5+ unit buildings).
- This rent runs 32% of the median local income ($62k/yr) — at the standard rent-burdened threshold; future hikes will face affordability resistance.
Forward outlook
- Local home prices are declining (-3.0%/yr); year-one equity from $1k of loan paydown is wiped out by about $5k of value loss. Plan a longer hold.
- Leon County population projected at +23% by 2050 — long-run rental-demand tailwind backs the buy-and-hold thesis.
Negotiation context
- It's been on market 266 days — a 12% lower offer ($143k) is reasonable based on typical stale-listing flexibility.
- 3 sale attempts since 6y ago; this cycle's ask has dropped $20k (11%) from the opening price — seller is motivated, your offer sets the floor, not the list.
Risks & watch-outs
- Climate carrying-cost: severe wind risk, 99% chance of damaging wind over 30y; extreme-heat days projected 7→20/yr by 2055 (HVAC capex compounding) — expect insurance premiums to compound above CPI over the hold.
Questions for the listing agent
- It's been on market 266 days. Have you received any prior offers? Is the seller open to a 12% concession, seller financing, or rate buy-down credit?
- Why hasn't it sold? Are there any deal-killer items the seller is aware of (foundation, flood, title, zoning, code violations)?
- Is there a deadline driving the sale (1031 exchange, divorce, estate, relocation)? That informs how much negotiation room exists.
- Schools are B-rated — typically a magnet for longer-tenancy family renters. What's the average tenant stay here, and is there a school-zone premium baked into asking?
- What's the average days-on-market for RENTAL listings here right now (not sales)? A rising rental-DOM trend means longer vacancies and softer asking-rent achievability than the comps imply.
- What's the recent tenant-quality profile in this submarket — average credit score on applications, eviction rate, late-payment / NSF rate, and stable-employment percentage? A property-management company in the area should have these aggregated.
- How much new for-sale + rental construction is in the pipeline within 1–3 miles? Heavy new supply typically softens prices + rents 12–24 months out; constrained supply supports both.
Investment metrics
- 1% rule
- 1.03% ✓
- Cap rate
- 8.46%
- Cash-on-cash
- 7.74%
- DSCR
- 1.34
- GRM
- 8.1
CMA / ARV
- ARV (on-the-fly)
- $180,576
- Comps found
- 9
Show comp detail 9 sales within ~0.75 mi
| Address | Dist | Beds/Ba | Sqft | Sold | Price | $/sf | Match |
|---|---|---|---|---|---|---|---|
| 6426 Bombadil Dr | 0.19mi | 2/1.0 (-1) | 912 (0%) | 3mo | $176,000 | $193 | 80 |
| 5798 Japonica Ct | 0.09mi | 3/2.0 | 1,032 (+13%) | 5mo | $195,000 | $189 | 70 |
| 6454 Bombadil Dr | 0.21mi | 2/1.0 (-1) | 916 (+0%) | 13mo | $170,000 | $186 | 70 |
| 5715 Bombadil Ct | 0.15mi | 2/1.0 (-1) | 949 (+4%) | 10mo | $170,000 | $179 | 69 |
| 5660 Maple Forest Dr | 0.63mi | 3/1.5 | 910 (-0%) | 4mo | $205,000 | $225 | 65 |
| 5633 Maple Forest Dr | 0.54mi | 3/2.0 | 900 (-1%) | 14mo | $225,000 | $250 | 61 |
| 5620 Cypress Cir | 0.51mi | 3/1.0 | 850 (-7%) | 2mo | $185,000 | $218 | 60 |
| 4520 Hickory Forest Cir | 0.71mi | 3/1.5 | 910 (-0%) | 8mo | $180,000 | $198 | 58 |
| 4812 Sampler Dr | 0.40mi | 3/2.0 | 1,014 (+11%) | 6mo | $229,000 | $226 | 57 |
Match score weights: distance 35% · size 25% · config 20% · recency 20%. Top-matched comps best support the ARV.
Projected returns pro-forma
-3.0% appreciation · 3.12% rent growth · sell at horizon
- IRR
- -4.4%
- Equity multiple
- 0.84×
- Total profit
- $-7,437
- Equity at exit
- $24,155
- IRR
- 5.4%
- Equity multiple
- 1.40×
- Total profit
- $18,236
- Equity at exit
- $14,007
Cash invested: $45,360 (down + closing). Projections, not guarantees.
Landlord ↔ Tenant lean methodology
- Overall (STATE)
- 87 Strongly Landlord-Friendly
- State Florida
- 87 Strongly Landlord-Friendly · R+3
- County
- — inherits STATE
- City
- — inherits STATE
ZIP-level market 32303
- Rents YoY
- 3.1%
- Active inventory
- 238
- Price-to-rent
- 8.1×
Monthly cashflow live
- Estimated rent
- $1,672 medium interval (Pro) →
- Mortgage (P&I)
- −$850
- Tax from tax record
- −$111 /mo · $1,333/yr
- Insurance
- −$68
- HOA
- −$0
- Vacancy / Maint / Mgmt
- −$351
- Net cashflow
- $293
Break-even live
Sensitivity live
| Price | -10% $384 | -5% $339 | +0% $293 | +5% $247 | +10% $201 |
|---|---|---|---|---|---|
| Rent | -10% $161 | -5% $227 | +0% $293 | +5% $359 | +10% $425 |
| Rate | -1.0pp $374 | -0.5pp $334 | base $293 | +0.5pp $251 | +1.0pp $208 |
UW: 25.0% down · 7.5% · 30yr · 1.5% tax · 5.0% vac · 8.0% maint · 8.0% mgmt
Financing live
Cash to close
- Down payment
- $40,500
- Closing costs
- $4,860
- Reserves months
- —
- Total cash needed
- —
Loan-product check · same deal, 3 products live
Conventional
25% down · 7.5% · 30yr
- Down + closing
- —
- Monthly P&I
- —
- Monthly cashflow
- —
- DSCR
- —
- Eligible?
- —
Personal DTI + credit; lowest rate.
DSCR
20% down · 8.5% · 30yr
- Down + closing
- —
- Monthly P&I
- —
- Monthly cashflow
- —
- DSCR
- —
- Eligible?
- —
No personal income docs; deal must DSCR.
Hard money
10% down · 12.0% · 12mo
- Down + closing
- —
- Monthly P&I
- —
- Monthly cashflow
- —
- DSCR
- —
- Eligible?
- —
Short-term bridge; refi at stabilization.
Rent comps 1 comps
| Address | Beds | Baths | Sqft | Rent | $/sqft | DOM | Units | Dist |
|---|---|---|---|---|---|---|---|---|
| 4895 Leah Ln Tallahassee, FL | 2.0 | 2.0 | 1008 | $1,800 | $1.79 | 16d | 1 | 0.95mi |
Listing history 27 events
-
2026-06-22days on market $162,000 Active 266 DOM
-
2026-06-18days on market $162,000 Active 263 DOM
-
2026-06-17days on market $162,000 Active 262 DOM
-
2026-06-16days on market $162,000 Active 261 DOM
-
2026-06-15days on market $162,000 Active 260 DOM
-
2026-06-14days on market $162,000 Active 258 DOM
-
2026-06-10days on market $162,000 Active 255 DOM
-
2026-06-09days on market $162,000 Active 254 DOM
-
2026-06-08days on market $162,000 Active 253 DOM
-
2026-06-07days on market $162,000 Active 252 DOM
-
2026-06-05days on market $162,000 Active 249 DOM
-
2026-06-03days on market $162,000 Active 248 DOM
-
2026-06-02days on market $162,000 Active 247 DOM
-
2026-06-01days on market $162,000 Active 246 DOM
-
2026-05-31days on market $162,000 Active 245 DOM
-
2026-05-30days on market $162,000 Active 244 DOM
-
2026-05-11status Active
-
2026-05-08price $162,000
-
2025-12-03historical Active Under Contract
-
2025-12-02status Pending
-
2025-11-12historical Contingent
-
2025-09-26$182,000 Active
-
2020-12-03soldstatus $157,200
-
2020-11-25soldstatus $157,200 749-char remark
Show marketing remark (749 chars)
MULTIPLE OFFERS SITUATION: Please submit highest and best offers by 5:00 PM EST 10/6/2020. Incredible opportunity and price on a fully renovated 3 bedroom/2 bathroom with 1 car garage home on a quiet cul-de-sac! New roof, HVAC, septic drain field, windows, doors, appliances(including washer/dryer), kitchen, bathrooms, electrical panel, water heater, floors, paint, and fixtures. Move in ready home features beautiful renovations throughout with low maintenance LVT floors. Home is charming and lives large for its size! Renovated kitchen with new cabinets, countertops, and appliances features new sliding glass door that opens to patio with views of large backyard. Go and show. Listing agent is part owner. As-is sale but home is in great shape.
-
2020-10-02$154,900 749-char remark
Show marketing remark (749 chars)
MULTIPLE OFFERS SITUATION: Please submit highest and best offers by 5:00 PM EST 10/6/2020. Incredible opportunity and price on a fully renovated 3 bedroom/2 bathroom with 1 car garage home on a quiet cul-de-sac! New roof, HVAC, septic drain field, windows, doors, appliances(including washer/dryer), kitchen, bathrooms, electrical panel, water heater, floors, paint, and fixtures. Move in ready home features beautiful renovations throughout with low maintenance LVT floors. Home is charming and lives large for its size! Renovated kitchen with new cabinets, countertops, and appliances features new sliding glass door that opens to patio with views of large backyard. Go and show. Listing agent is part owner. As-is sale but home is in great shape.
-
1999-12-03soldstatus $60,500
-
1992-07-01soldstatus $46,500
ⓘ Source: listings_history table (triggers on properties + properties_extension) + one-shot
backfill from property_details.listing_events for pre-trigger history.
Tax reassessment forecast FL · Resets to sale price
- Current annual tax
- $1,333 · $111/mo
- Projected year-2 tax
- $1,345 · $112/mo
- Expected delta
- +$12/yr (+$1/mo · 0.9%)
ⓘ Screening estimate from a state-policy table — verify with the county assessor before closing.
Climate risk First Street
- Flood 1/10 Low FEMA zone X (unshaded) · 0% chance over 30 yrs
- Wildfire 3/10 Moderate
- Heat 8/10 Severe 7 d/yr ≥108°F today · 20 d/yr by 30 yrs out
- Wind 9/10 Extreme 99% chance of damaging wind over 30 yrs
- Air quality 5/10 Major 7 unhealthy d/yr today · 7 by 30 yrs out
Nearby sold comps map
Loading sold comps map…
Walkable amenities ~0.75 mi
Loading nearby amenities…
Taxation est. · year 1
- Rental income
- $20,064
- − Mortgage interest
- −$9,075
- − Property taxes
- −$1,333
- − Insurance
- −$810
- − Repairs & maintenance
- −$1,605
- − Management
- −$1,605
- − Depreciation
- −$4,713
- Taxable income
- $923
- Est. tax owed @ 24.0%
- −$222
- After-tax cash flow
- $3,291/yr
For passive investors: Depreciation is non-cash, so a rental often shows a tax loss while cash-flowing — sheltering income. Rental losses are passive: they offset passive income freely, and up to $25,000/yr can offset ordinary (W-2) income if you actively participate and your MAGI is under $100k (phasing out to $0 by $150k); unused losses carry forward. On sale, claimed depreciation is recaptured at up to 25%, and gains may owe capital-gains tax (a 1031 exchange can defer both). Figures are a year-1 estimate at your 24.0% rate — not tax advice; consult a CPA.
Schools (NCES district)
- District
- Leon
- NCES district ID
- 1201110
- Math proficiency
- 48% ▼ -13.00%
- Reading proficiency
- 53% ▼ -5.00%
- Median HH income
- $46,339
- Composite
- 42.84/100
- National rank
- #3131
- State rank
- #33 of 73 in FL
Livability — Tallahassee
- Score
- 86/100
- State rank
- #19
- US rank
- #429
Category grades
Schools grade is shown separately in the Schools card above.
Census & demographics
- County
- Leon County · 294,472 people
- City population
- 294,472
- Metro
- Tallahassee, FL
- Population (ZIP)
- 49,785
- Household income
- $62,275
- Rent vs Own
- Severe rent burden
- 2919.0
Population outlook (Leon County) Hauer SSP2
- Today (2025)
- 315,507 people
- By 2030
- 330,677 · +4.8%
- By 2040
- 358,465 · +13.6%
- By 2050
- 386,804 · +22.6%
- By 2075
- 465,480 · +47.5%
- By 2100
- 519,959 · +64.8%
Race, ethnicity, and origin ACS 2023
- Neighborhood character
- Diverse neighborhood (Simpson 0.63)
- Race & ethnicity
- White 50% Black 34% Hispanic / Latino 8% Two or more races 8% Asian 3%
- Hispanic origin (detail)
- Mexican 2% Puerto Rican 1% Cuban 2%
- Common ancestry
- Slovak 2% Italian 1% Lithuanian 1%
- Foreign-born
- 8% · Canada, Vietnam, China
- Languages at home
- 89% English-only · Spanish 5% Arabic 1% French/Haitian/Cajun 1%
Political lean MEDSL · Leon
- 2024 margin
- Strong D (+21.8) · D 60.3% · R 38.5% · Other 1.2%
- 2008→2024 swing
- -2.5pp toward R · 2008: 24.3pp · 2024: 21.8pp
- All cycles
- 2024: D+21.8 2020: D+28.3 2016: D+25.1 2012: D+23.6 2008: D+24.3
Not yet ingested
- Civics
- —
Market trends
- HPI YoY
- ▼ -255.24%
- Current HPI
- 241.3131
- Rent YoY
- ▲ 3.12%
- Metro
- Tallahassee, FL
- State GDP YoY
- ▲ 3.28%
- F500 in state
- 36
Industry mix (Fortune 500 HQ in FL)
| Industry | F500 HQs | Revenue |
|---|---|---|
| Industrial Technology | 2 | $29B |
|
||
| Insurance | 2 | $17B |
|
||
| Retail | 1 | $60B |
|
||
| Technology Distribution | 1 | $58B |
|
||
| Homebuilding | 1 | $35B |
|
||
| Technology Manufacturing | 1 | $35B |
|
||
Price history
+248.4% since first listed11 events — show timeline
- 2026-05-11 Relisted — CATRS
- 2026-05-08 Price Changed $162,000 CATRS
- 2025-12-03 Contingent — CATRS
- 2025-12-02 Pending — CATRS
- 2025-11-12 Contingent — CATRS
- 2025-09-26 Listed $182,000 CATRS
- 2020-12-03 Sold (Public Records) $157,200 Public Records
- 2020-11-25 Sold (MLS) $157,200 CATRS
- 2020-10-02 Listed $154,900 CATRS
- 1999-12-03 Sold (Public Records) $60,500 Public Records
- 1992-07-01 Sold (Public Records) $46,500 Public Records
Property tax history
+7.2%/yrLatest (2025): $1,333 · +2.8% YoY. Source: county tax records.
Cash-flow waterfall
monthlySold comps — $/sqft
last 12 mo · ≤1 miLoading sold comps…