6227 N Litchfield Rd #18 · Glendale, AZ
Flood risk 1/10 · Minimal
- FEMA flood zone
- X (shaded)
- Chance of flooding over 30 yrs
- 0.0%
- Est. flood insurance / yr
- $507 – $1,088
Fire risk 3/10 · Minor
- Est. fire insurance / yr
- $610 – $1,132
Heat risk 9/10 · Severe
- Hot days now (above 113°F)
- 6 days/yr
- Hot days in 30 yrs
- 16 days/yr
Wind risk 1/10 · Minimal
- Chance of severe wind over 30 yrs
- —
Air-quality risk 1/10 · Minimal
- Unhealthy air days now
- 0 days/yr
- Unhealthy air days in 30 yrs
- 0 days/yr
Risk factors via First Street. Map © Google.
Why this score? — see what drove the B- grade
The composite is a weighted blend of 9 inputs, each scored 0–100. Each bar is that input's sub-score; the figure is the points it added to the 100-point composite (weight × sub-score).
- Cash flow +30.0/30.0
- 1% rule +10.0/10.0
- DSCR +10.0/10.0
- ARV discount +7.5/15.0
- Livability +3.8/5.0
- Rent growth +3.0/5.0
- Schools +2.8/10.0
- Condition / age +2.5/5.0
- Appreciation +0.0/10.0
$65,000
🖨 Deal sheet 📄 Offer letter ✓ Due diligence
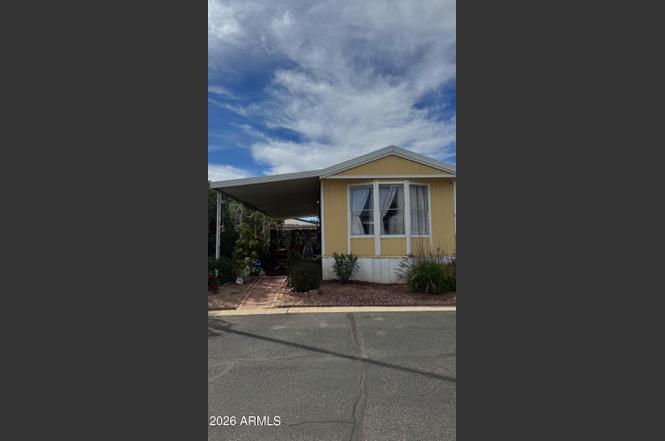
Listing remarks
Welcome to this charming and well-maintained mobile home offering comfortable living at an affordable price! This home features a spacious layout with plenty of natural light, a functional kitchen, and inviting living areas perfect for relaxing or entertaining. Not to mention a newer roof, replaced A/C, new water heater, and replaced appliances. Enjoy outdoor space ideal for gatherings, gardening, or simply unwinding. Conveniently located near shopping, dining, and everyday amenities, this property offers both comfort and convenience. A great opportunity for homeowners or investors alike!
Key facts
- Replaced a/c
- Newer roof
- New water heater
Tags
Property features AI
Finance
- HOA & community: No association fees; Land lease required: $725 monthly; Community amenities include pool, gated access, tennis courts, and playground
Exterior
- Parking: 2 covered parking spaces; 2 open parking spaces; 2 carport spaces
- Utilities: City water; Public sewer
- Home design: Manufactured/mobile home; Leasehold ownership; City and desert views
- Construction: Wood-frame construction; Painted exterior; Composition roof
- Exterior features: Gravel/stone front yard; Natural desert front landscaping; No or partial fencing (wood where present)
Interior
- Kitchen: Refrigerator included
- Bedrooms: Up to 2 bedrooms
- Flooring: Tile flooring
- Bathrooms: 1 full bathroom
- Heating & cooling: Electric heating; Central air conditioning; Ceiling fans
- Interior features: High-speed internet available; Granite counters; Eat-in kitchen with breakfast bar; Vaulted ceilings; Full bathroom in master bedroom
Neighborhood map
What this means for you Summary
Snapshot
- This is a 1-bed/1.0-bath manufactured listed at $65k.
Deal economics
- At list price, monthly cash flow is $600 ($7k/yr) — positive.
- The deal already cash-flows at list — no discount required.
- Meets the 1% rule at list price ($1k rent vs $65k).
- Recommended offer: $59k (9.0% below list) — sets the bar for market timing.
- Cap rate 17.4% vs local median 3.5% in Glendale — top-decile yield for the area; either an underpriced asset or a hidden risk that comps aren't pricing in. Stress-test before assuming the spread holds.
Location & tenants
- Location reads 76/100 on livability (#12 in AZ, #3,235 nationally) — a middle-class / working-renter tenant base. Strengths: commute A+, housing A+, amenities B; Watch: health & safety D+, crime F.
- Agua Fria Union High School District (4289) (suburban): math 24% / reading 37% proficiency, ranked #99 of 249 in AZ (top 40%) — families likely to look elsewhere, expect single-tenant / working-renter base with shorter leases.
- Zoned schools: Millennium High School (math 39% / reading 55%, grade D-, #50 of 381 statewide, top 14%, 2,121 students, 21% FRL).
- Zoned-school proficiency averages 47% at this address vs 30% district-wide (+16 pts) — the actual schools serving this property are materially stronger than the Agua Fria Union High School District (4289) average implies; a family-tenant draw the district grade alone would hide.
- Market conditions: Rents rising (+1.9%/yr); 474 active listings in the ZIP; 3 comparable units currently listed for rent nearby; rentals leasing fast (median 1d on market — plan ~1-2 weeks tenant-placement turnaround); high-income renter base; 36,011 units permitted in Maricopa County in 2024 (12,801 in 5+ unit buildings).
- This rent is only 13% of the median local income ($122k/yr) — well below the 30% rent-burden line; pricing power to push rent on renewal without tenant pushback.
Forward outlook
- Local home prices are declining (-3.0%/yr); year-one equity from $449 of loan paydown is wiped out by about $2k of value loss. Plan a longer hold.
- Maricopa County population projected at +38% by 2050 — long-run rental-demand tailwind backs the buy-and-hold thesis.
- At projected returns (-3.0% appreciation + 1.9% rent growth), your $18k cash investment doubles in ~4 years — after that, you're playing with house money.
Negotiation context
- It's been on market 99 days — a 9% lower offer ($59k) is reasonable based on typical stale-listing flexibility.
Risks & watch-outs
- Climate carrying-cost: extreme-heat days projected 6→16/yr by 2055 (HVAC capex compounding) — expect insurance premiums to compound above CPI over the hold.
Questions for the listing agent
- It's been on market 99 days. Have you received any prior offers? Is the seller open to a 9% concession, seller financing, or rate buy-down credit?
- Why hasn't it sold? Are there any deal-killer items the seller is aware of (foundation, flood, title, zoning, code violations)?
- Is there a deadline driving the sale (1031 exchange, divorce, estate, relocation)? That informs how much negotiation room exists.
- Crime grade is F in this area — have there been break-ins, vandalism, or insurance claims at this property in the last 3 years? What carrier currently insures it and at what premium?
- What's the average days-on-market for RENTAL listings here right now (not sales)? A rising rental-DOM trend means longer vacancies and softer asking-rent achievability than the comps imply.
- What's the recent tenant-quality profile in this submarket — average credit score on applications, eviction rate, late-payment / NSF rate, and stable-employment percentage? A property-management company in the area should have these aggregated.
- How much new for-sale + rental construction is in the pipeline within 1–3 miles? Heavy new supply typically softens prices + rents 12–24 months out; constrained supply supports both.
Investment metrics
- 1% rule
- 2.04% ✓
- Cap rate
- 17.37%
- Cash-on-cash
- 39.56%
- DSCR
- 2.76
- GRM
- 4.1
CMA / ARV
No comps found within radius.
Projected returns pro-forma
-3.0% appreciation · 1.92% rent growth · sell at horizon
- IRR
- 34.6%
- Equity multiple
- 2.44×
- Total profit
- $26,275
- Equity at exit
- $9,692
- IRR
- 40.9%
- Equity multiple
- 4.65×
- Total profit
- $66,436
- Equity at exit
- $5,620
Cash invested: $18,200 (down + closing). Projections, not guarantees.
Landlord ↔ Tenant lean methodology
- Overall (STATE)
- 87 Strongly Landlord-Friendly
- State Arizona
- 87 Strongly Landlord-Friendly · R+3
- County
- — inherits STATE
- City
- — inherits STATE
ZIP-level market 85340
- Rents YoY
- 1.9%
- Active inventory
- 474
- Price-to-rent
- 4.1×
Monthly cashflow live
- Estimated rent
- $1,328 medium interval (Pro) →
- Mortgage (P&I)
- −$341
- Tax est. 1.5%
- −$81 /mo · $975/yr
- Insurance
- −$27
- HOA
- −$0
- Vacancy / Maint / Mgmt
- −$279
- Net cashflow
- $600
Break-even live
UW: 25.0% down · 7.5% · 30yr · 1.5% tax · 5.0% vac · 8.0% maint · 8.0% mgmt
Financing live
Cash to close
- Down payment
- $16,250
- Closing costs
- $1,950
- Reserves months
- —
- Total cash needed
- —
Loan-product check · same deal, 3 products live
Conventional
25% down · 7.5% · 30yr
- Down + closing
- —
- Monthly P&I
- —
- Monthly cashflow
- —
- DSCR
- —
- Eligible?
- —
Personal DTI + credit; lowest rate.
DSCR
20% down · 8.5% · 30yr
- Down + closing
- —
- Monthly P&I
- —
- Monthly cashflow
- —
- DSCR
- —
- Eligible?
- —
No personal income docs; deal must DSCR.
Hard money
10% down · 12.0% · 12mo
- Down + closing
- —
- Monthly P&I
- —
- Monthly cashflow
- —
- DSCR
- —
- Eligible?
- —
Short-term bridge; refi at stabilization.
Rent comps 3 comps
| Address | Beds | Baths | Sqft | Rent | $/sqft | DOM | Units | Dist |
|---|---|---|---|---|---|---|---|---|
| 13517 W Glendale Ave Glendale, AZ | 1.0 | 1.0 | 450 | $1,199 | $2.66 | 1d | 27 | 0.64mi |
| 6706 N Dysart Rd Glendale, AZ | 1.0–2.0 | 1.0–2.0 | 727 | $854 | $1.17 | 1d | 42 | 0.87mi |
| 5110 N 129th Ave Litchfield Park, AZ | 1.0–2.0 | 1.0–2.0 | 806 | $1,708 | $2.12 | 1d | 8 | 1.49mi |
Listing history 14 events
-
2026-06-18days on market $65,000 Active 99 DOM
-
2026-06-17days on market $65,000 Active 98 DOM
-
2026-06-16days on market $65,000 Active 97 DOM
-
2026-06-15days on market $65,000 Active 96 DOM
-
2026-06-13days on market $65,000 Active 94 DOM
-
2026-06-09days on market $65,000 Active 90 DOM
-
2026-06-08days on market $65,000 Active 89 DOM
-
2026-06-07days on market $65,000 Active 88 DOM
-
2026-06-04days on market $65,000 Active 85 DOM
-
2026-06-03days on market $65,000 Active 84 DOM
-
2026-06-02days on market $65,000 Active 83 DOM
-
2026-06-01days on market $65,000 Active 82 DOM
-
2026-05-31days on market $65,000 Active 81 DOM
-
2026-03-11$65,000 Active
ⓘ Source: listings_history table (triggers on properties + properties_extension) + one-shot
backfill from property_details.listing_events for pre-trigger history.
Climate risk First Street
- Flood 1/10 Low FEMA zone X (shaded) · 0% chance over 30 yrs
- Wildfire 3/10 Moderate
- Heat 9/10 Extreme 6 d/yr ≥113°F today · 16 d/yr by 30 yrs out
- Wind 1/10 Low
- Air quality 1/10 Low 0 unhealthy d/yr today · 0 by 30 yrs out
Nearby sold comps map
Loading sold comps map…
Walkable amenities ~0.75 mi
Loading nearby amenities…
Taxation est. · year 1
- Rental income
- $15,937
- − Mortgage interest
- −$3,641
- − Property taxes
- −$975
- − Insurance
- −$325
- − Repairs & maintenance
- −$1,275
- − Management
- −$1,275
- − Depreciation
- −$1,891
- Taxable income
- $6,556
- Est. tax owed @ 24.0%
- −$1,573
- After-tax cash flow
- $5,627/yr
For passive investors: Depreciation is non-cash, so a rental often shows a tax loss while cash-flowing — sheltering income. Rental losses are passive: they offset passive income freely, and up to $25,000/yr can offset ordinary (W-2) income if you actively participate and your MAGI is under $100k (phasing out to $0 by $150k); unused losses carry forward. On sale, claimed depreciation is recaptured at up to 25%, and gains may owe capital-gains tax (a 1031 exchange can defer both). Figures are a year-1 estimate at your 24.0% rate — not tax advice; consult a CPA.
Schools (NCES district)
- District
- Agua Fria Union High School District (4289)
- NCES district ID
- 0400450
- Math proficiency
- 24% ▼ -32.00%
- Reading proficiency
- 37% ▼ -12.00%
- Median HH income
- $64,107
- Composite
- 27.92/100
- National rank
- #6865
- State rank
- #99 of 249 in AZ
Livability — Glendale
- Score
- 76/100
- State rank
- #12
- US rank
- #3235
Category grades
Schools grade is shown separately in the Schools card above.
Census & demographics
- County
- Maricopa County · 4,537,380 people
- City population
- 294,586
- Metro
- Phoenix-Mesa-Chandler, AZ
- Population (ZIP)
- 40,919
- Household income
- $122,323
- Rent vs Own
- Severe rent burden
- 696.0
Population outlook (Maricopa County) Hauer SSP2
- Today (2025)
- 4,979,203 people
- By 2030
- 5,378,229 · +8.0%
- By 2040
- 6,156,598 · +23.6%
- By 2050
- 6,872,376 · +38.0%
- By 2075
- 8,401,270 · +68.7%
- By 2100
- 9,247,439 · +85.7%
Race, ethnicity, and origin ACS 2023
- Neighborhood character
- Diverse neighborhood (Simpson 0.64)
- Race & ethnicity
- White 48% Hispanic / Latino 35% Two or more races 19% Black 5% Asian 4% Native American 1%
- Hispanic origin (detail)
- Mexican 27%
- Common ancestry
- Romanian 2% Portuguese 2% Slovak 2%
- Foreign-born
- 12% · Canada, Vietnam, China
- Languages at home
- 78% English-only · Spanish 16% Other Indo-European 1%
Political lean MEDSL · Maricopa
- 2024 margin
- Toss-up / Even · D 47.7% · R 51.2% · Other 1.1%
- 2008→2024 swing
- +7.1pp toward D · 2008: -10.6pp · 2024: -3.5pp
- All cycles
- 2024: R+3.5 2020: D+2.2 2016: R+3.5 2012: R+12.0 2008: R+10.6
Not yet ingested
- Civics
- —
Market trends
- HPI YoY
- ▼ -322.29%
- Current HPI
- 279.2294
- Rent YoY
- ▲ 1.92%
- Metro
- Phoenix-Mesa-Chandler, AZ
- State GDP YoY
- ▲ 4.54%
- F500 in state
- 20
Industry mix (Fortune 500 HQ in AZ)
| Industry | F500 HQs | Revenue |
|---|---|---|
| Technology | 2 | $13B |
|
||
| Mining / Metals | 1 | $23B |
|
||
| Environmental Services | 1 | $16B |
|
||
| Metals / Steel | 1 | $14B |
|
||
| Technology Distribution | 1 | $9B |
|
||
| Homebuilding | 1 | $8B |
|
||
Price history
1 event — show timeline
- 2026-03-11 Listed $65,000 ARMLS
Cash-flow waterfall
monthlySold comps — $/sqft
last 12 mo · ≤1 miLoading sold comps…