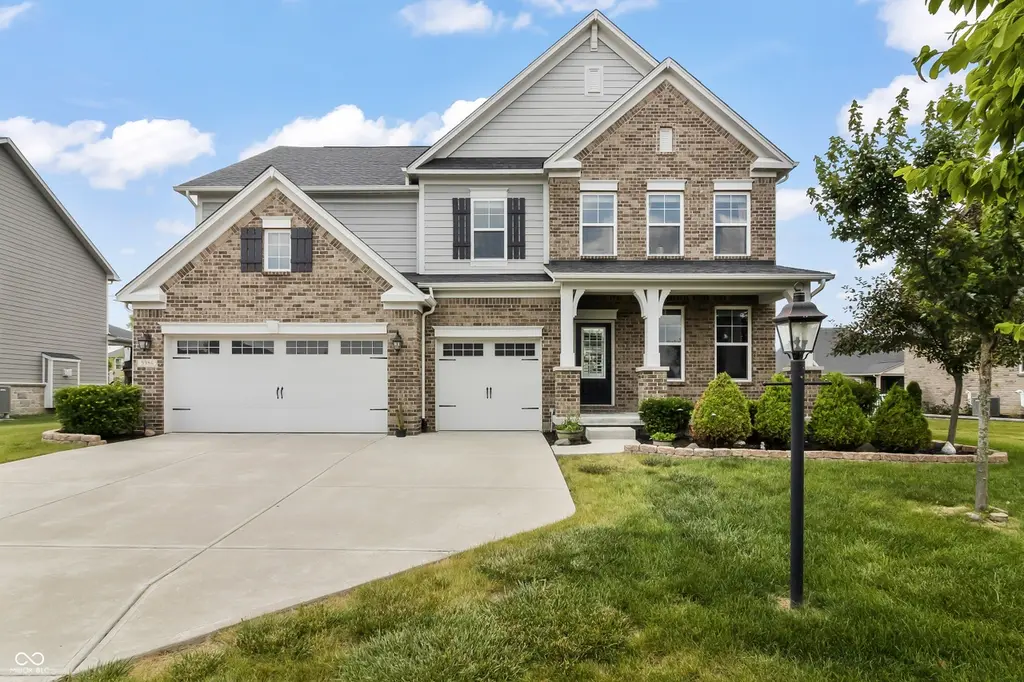
9986 Stable Stone Ter · Fishers, IN
Flood risk 1/10 · Minimal
- FEMA flood zone
- X (unshaded)
- Chance of flooding over 30 yrs
- 0.0%
- Est. flood insurance / yr
- $473 – $860
Fire risk 1/10 · Minimal
- Est. fire insurance / yr
- $717 – $1,331
Heat risk 3/10 · Minor
- Hot days now (above 100°F)
- 7 days/yr
- Hot days in 30 yrs
- 18 days/yr
Wind risk 2/10 · Minimal
- Chance of severe wind over 30 yrs
- 1.0%
Air-quality risk 2/10 · Minimal
- Unhealthy air days now
- 1 days/yr
- Unhealthy air days in 30 yrs
- 2 days/yr
Risk factors via First Street. Map © Google.
Why this score? — see what drove the D- grade
The composite is a weighted blend of 9 inputs, each scored 0–100. Each bar is that input's sub-score; the figure is the points it added to the 100-point composite (weight × sub-score).
- Cash flow +11.4/30.0
- Schools +5.3/10.0
- Livability +4.2/5.0
- Condition / age +4.0/5.0
- 1% rule +3.4/10.0
- DSCR +3.4/10.0
- Rent growth +2.5/5.0
- ARV discount +1.8/15.0
- Appreciation +0.0/10.0
$760,000
🖨 Deal sheet (PDF) 📄 Offer letter ✓ Due diligence
Listing remarks
Just minutes from Geist Waterfront Park, you'll love having easy access to one of the area's favorite summer destinations for swimming, beach days, and outdoor recreation. Back at home, enjoy a quiet morning coffee or unwind in the evening on the private back patio featuring a pergola and custom built-in benches. Inside, the home offers flexible living spaces designed for today's lifestyle and features brand-new carpeting throughout, adding a fresh, move-in-ready feel. The main floor includes a dedicated office, plus an additional desk/nook area that can serve as a work-from-home station, homework or craft space, or even a dry bar! Upstairs, you'll find four spacious bedrooms, three full
Key facts
- Luxury full bathroom
- Private back patio
- Finished basement
Tags
Property features AI
Finance
- HOA & community: Homeowners association with annual fee; Annual association fee covers insurance and maintenance; Community pool; HOA governed by covenants and restrictions
Exterior
- Parking: Attached 3-car garage with finished interior and garage door opener
- Security: Carbon monoxide detector(s)
- Utilities: Public water; Municipal sewer connected; No solid waste service (per listing)
- Home design: Single-family residence; Two levels
- Construction: Brick and cement siding exterior; Concrete perimeter foundation; Built by Drees Homes
- Exterior features: Covered patio/porch
Interior
- Kitchen: Gas cooktop; Dishwasher; Garbage disposal; Microwave; Oven; Double oven
- Bedrooms: Four bedrooms on the upper level; Total of 12 rooms
- Flooring: Hardwood floors
- Bathrooms: Four full bathrooms; One half bathroom; Three full baths on the upper level; One full bath in the basement; Half bath on the main level
- Heating & cooling: Forced-air heating (natural gas); Central air conditioning
- Interior features: High vaulted ceilings; Walk-in closets; Hardwood floors; Kitchen island
- Laundry & utility: Upper-level laundry; Gas water heater; Sump pump with backup
Neighborhood map
What this means for you Summary
Snapshot
- This is a 4-bed/4.5-bath single-family listed at $760k. Condition is rated good.
Deal economics
- At list price, monthly cash flow is $-258 ($-3k/yr) — negative.
- To cash-flow at today's rent, offer at most $723k (4.9% below list).
- To meet the 1% rule (rent ≥ 1% of price), the offer needs to be $641k (15.6% below list).
- Recommended offer: $641k (15.6% below list) — sets the bar for 1% rule.
- Cap rate 5.9% vs local median 3.6% in Fishers — top-decile yield for the area; either an underpriced asset or a hidden risk that comps aren't pricing in. Stress-test before assuming the spread holds.
Location & tenants
- Location reads 83/100 on livability (#11 in IN, #898 nationally) — a professional / high-income tenant draw. Strengths: crime A+, amenities A+, employment A+; Watch: commute F.
- Hamilton Southeastern Schools (suburban): math 57% / reading 59% proficiency, ranked #14 of 301 in IN (top 5%) — acceptable for families but not a draw, mixed tenant base, ~2y average lease; only 10% free/reduced lunch — higher-income household profile.
- Zoned schools: Geist Elementary School (math 78% / reading 69%, grade A, #23 of 994 statewide, top 3%, 707 students, 13% FRL); Hamilton Se Int And Jr High Sch (math 50% / reading 60%, grade B-, #26 of 330 statewide, top 8%, 1,269 students, 13% FRL); Hamilton Southeastern Hs (math 66% / reading 85%, grade A-, #7 of 369 statewide, top 2%, 3,450 students, 15% FRL) — zoned schools at 14% FRL track the district average.
- Market conditions: 307 active listings in the ZIP; 3 comparable units currently listed for rent nearby; rentals leasing fast (median 10d on market — plan ~1-2 weeks tenant-placement turnaround); 4,661 units permitted in Hamilton County in 2024 (1,528 in 5+ unit buildings).
Forward outlook
- Local home prices are declining (-3.0%/yr); year-one equity from $5k of loan paydown is wiped out by about $23k of value loss. Plan a longer hold.
- Hamilton County population projected at +44% by 2050 — long-run rental-demand tailwind backs the buy-and-hold thesis.
Negotiation context
- Only 10 days on market — expect competitive offers; lowballing is unlikely to land.
Questions for the listing agent
- What do current leases actually rent for vs. the listed asking? Can we see a recent rent roll and the last 12 months of T-12 income?
- What does the HOA fee cover, when was the last increase, and are there any pending special assessments or reserve-fund shortfalls?
- Is there a deadline driving the sale (1031 exchange, divorce, estate, relocation)? That informs how much negotiation room exists.
- Schools are A-rated — typically a magnet for longer-tenancy family renters. What's the average tenant stay here, and is there a school-zone premium baked into asking?
- The area grade is low — what's the realistic commute time and amenity access for the typical tenant pool here? Any planned neighborhood developments (good or bad) we should know about?
- What's the average days-on-market for RENTAL listings here right now (not sales)? A rising rental-DOM trend means longer vacancies and softer asking-rent achievability than the comps imply.
- What's the recent tenant-quality profile in this submarket — average credit score on applications, eviction rate, late-payment / NSF rate, and stable-employment percentage? A property-management company in the area should have these aggregated.
- How much new for-sale + rental construction is in the pipeline within 1–3 miles? Heavy new supply typically softens prices + rents 12–24 months out; constrained supply supports both.
Investment metrics
- 1% rule
- 0.84% ✗
- Cap rate
- 5.89%
- Cash-on-cash
- -1.45%
- DSCR
- 0.94
- GRM
- 9.9
CMA / ARV
- ARV (on-the-fly)
- $673,965
- Comps found
- 12
Show comp detail 12 sales within ~0.75 mi
| Address | Dist | Beds/Ba | Sqft | Sold | Price | $/sf | Match |
|---|---|---|---|---|---|---|---|
| 10001 Copper Saddle Bnd | 0.04mi | 4/3.0 | 4,303 (-2%) | 0mo | $680,500 | $158 | 88 |
| 14691 Thor Run Dr | 0.58mi | 4/4.5 | 4,386 (-0%) | 4mo | $745,000 | $170 | 69 |
| 14479 Brook Meadow Dr | 0.44mi | 5/3.5 (+1) | 4,305 (-2%) | 3mo | $507,000 | $118 | 65 |
| 9940 Delmore Dr | 0.58mi | 5/3.5 (+1) | 4,470 (+2%) | 2mo | $685,000 | $153 | 60 |
| 10389 Blue Ribbon Blvd | 0.46mi | 4/2.5 | 4,271 (-3%) | 7mo | $537,000 | $126 | 60 |
| 14463 Christie Ann Dr | 0.57mi | 5/4.5 (+1) | 4,672 (+6%) | 1mo | $851,001 | $182 | 58 |
| 14359 Misty Cove Ln | 0.63mi | 4/3.0 | 4,532 (+3%) | 5mo | $635,000 | $140 | 56 |
| 10166 Ranford Blvd | 0.56mi | 4/2.5 | 4,110 (-7%) | 4mo | $500,000 | $122 | 51 |
| 9713 Timberbrooke Blvd | 0.66mi | 3/2.0 (-1) | 4,534 (+3%) | 2mo | $420,000 | $93 | 48 |
| 15349 Dorman Ct | 0.67mi | 5/3.5 (+1) | 3,884 (-12%) | 2mo | $665,000 | $171 | 38 |
| 14478 Brookfield Dr | 0.67mi | 4/4.0 | 5,005 (+14%) | 7mo | $740,000 | $148 | 38 |
| 4813 Rosie Blvd | 0.64mi | 5/3.5 (+1) | 3,744 (-15%) | 1mo | $599,995 | $160 | 35 |
Match score weights: distance 35% · size 25% · config 20% · recency 20%. Top-matched comps best support the ARV.
Projected returns pro-forma
-3.0% appreciation · 3.0% rent growth · sell at horizon
- IRR
- -18.7%
- Equity multiple
- 0.34×
- Total profit
- $-139,413
- Equity at exit
- $113,318
- IRR
- -11.1%
- Equity multiple
- 0.33×
- Total profit
- $-141,946
- Equity at exit
- $65,711
Cash invested: $212,800 (down + closing). Projections, not guarantees.
Landlord ↔ Tenant lean methodology
- Overall (STATE)
- 90 Strongly Landlord-Friendly
- State Indiana
- 90 Strongly Landlord-Friendly · R+11
- County
- — inherits STATE
- City
- — inherits STATE
ZIP-level market 46040
- Home prices YoY
- -24.4%
- Active inventory
- 307
- Price-to-rent
- 9.9×
Monthly cashflow live
- Estimated rent
- $6,412 medium interval (Pro) →
- Mortgage (P&I)
- −$3,986
- Tax est. 1.5%
- −$950 /mo · $11,400/yr
- Insurance
- −$317
- HOA
- −$71
- Vacancy / Maint / Mgmt
- −$1,347
- Net cashflow
- $-258
Break-even live
Sensitivity live
| Price | -10% $268 | -5% $5 | +0% $-258 | +5% $-520 | +10% $-783 |
|---|---|---|---|---|---|
| Rent | -10% $-764 | -5% $-511 | +0% $-258 | +5% $-4 | +10% $249 |
| Rate | -1.0pp $125 | -0.5pp $-64 | base $-258 | +0.5pp $-454 | +1.0pp $-655 |
UW: 25.0% down · 7.5% · 30yr · 1.5% tax · 5.0% vac · 8.0% maint · 8.0% mgmt
Financing live
Cash to close
- Down payment
- $190,000
- Closing costs
- $22,800
- Reserves months
- —
- Total cash needed
- —
Loan-product check · same deal, 3 products live
Conventional
25% down · 7.5% · 30yr
- Down + closing
- —
- Monthly P&I
- —
- Monthly cashflow
- —
- DSCR
- —
- Eligible?
- —
Personal DTI + credit; lowest rate.
DSCR
20% down · 8.5% · 30yr
- Down + closing
- —
- Monthly P&I
- —
- Monthly cashflow
- —
- DSCR
- —
- Eligible?
- —
No personal income docs; deal must DSCR.
Hard money
10% down · 12.0% · 12mo
- Down + closing
- —
- Monthly P&I
- —
- Monthly cashflow
- —
- DSCR
- —
- Eligible?
- —
Short-term bridge; refi at stabilization.
Rent comps 3 comps
| Address | Beds | Baths | Sqft | Rent | $/sqft | DOM | Units | Dist |
|---|---|---|---|---|---|---|---|---|
| 10057 Backstretch Row Unit NA Fortville, IN | 5.0 | 5.0 | 5541 | $4,499 | $0.81 | 0d | 1 | 0.34mi |
| 10599 Geist View Dr Fishers, IN | 5.0 | 4.5 | 5119 | $7,500 | $1.47 | 9d | 1 | 1.27mi |
| 10599 Geist View Dr Fishers, IN | 5.0 | 4.5 | 5119 | $11,900 | $2.32 | 45d | 1 | 1.27mi |
HOA detail
- Monthly dues
- $71 · $852/yr
- Likely covers
- water
Listing history 7 events
-
2026-06-21days on market $760,000 Active 10 DOM
-
2026-06-18days on market $760,000 Active 7 DOM
-
2026-06-17days on market $760,000 Active 6 DOM
-
2026-06-16days on market $760,000 Active 5 DOM
-
2026-06-15days on market $760,000 Active 4 DOM
-
2026-06-13remarks 699-char remark
-
2026-06-13$760,000 Active 2 DOM
ⓘ Source: listings_history table (triggers on properties + properties_extension) + one-shot
backfill from property_details.listing_events for pre-trigger history.
Climate risk First Street
- Flood 1/10 Low FEMA zone X (unshaded) · 0% chance over 30 yrs
- Wildfire 1/10 Low
- Heat 3/10 Moderate 7 d/yr ≥100°F today · 18 d/yr by 30 yrs out
- Wind 2/10 Low 100% chance of damaging wind over 30 yrs
- Air quality 2/10 Low 1 unhealthy d/yr today · 2 by 30 yrs out
Nearby sold comps map
Loading sold comps map…
Walkable amenities ~0.75 mi
Loading nearby amenities…
Taxation est. · year 1
- Rental income
- $76,947
- − Mortgage interest
- −$42,572
- − Property taxes
- −$11,400
- − Insurance
- −$3,800
- − Repairs & maintenance
- −$6,156
- − Management
- −$6,156
- − HOA
- −$852
- − Depreciation
- −$22,109
- Taxable loss
- −$16,097
- Est. tax savings @ 24.0%
- +$3,863
- After-tax cash flow
- $773/yr
For passive investors: Depreciation is non-cash, so a rental often shows a tax loss while cash-flowing — sheltering income. Rental losses are passive: they offset passive income freely, and up to $25,000/yr can offset ordinary (W-2) income if you actively participate and your MAGI is under $100k (phasing out to $0 by $150k); unused losses carry forward. On sale, claimed depreciation is recaptured at up to 25%, and gains may owe capital-gains tax (a 1031 exchange can defer both). Figures are a year-1 estimate at your 24.0% rate — not tax advice; consult a CPA.
Condition & rehab AI · 13 photos
This home is in good condition with fresh paint and well-maintained interiors. It's move-in ready with minor cosmetic updates that could further enhance its value.
Value-add opportunities
- Both Paint exterior — Fresh paint enhances curb appeal and value
- Both Clean gutters — Clean gutters prevent water damage and improve property value
Renovation cost estimate screening
Value-add ROI direction
- Both Paint exterior — Fresh paint enhances curb appeal and value ↑
- Both Clean gutters — Clean gutters prevent water damage and improve property value ↑
ⓘ Cost ranges are severity-bucket heuristics (US national rule-of-thumb). Get contractor quotes + a written scope before underwriting a rehab budget.
Schools (NCES district)
- District
- Hamilton Southeastern Schools
- NCES district ID
- 1810650
- Math proficiency
- 57% ▼ -11.00%
- Reading proficiency
- 59% ▼ -7.00%
- Median HH income
- $87,726
- Composite
- 53.02/100
- National rank
- #1520
- State rank
- #14 of 301 in IN
Livability — Fishers
- Score
- 83/100
- State rank
- #11
- US rank
- #898
Category grades
Schools grade is shown separately in the Schools card above.
Census & demographics
- Census place
- Fishers, IN
- City population
- 92,467
- Population (ZIP)
- 17,891
Population outlook (Hamilton County) Hauer SSP2
- Today (2025)
- 381,938 people
- By 2030
- 417,496 · +9.3%
- By 2040
- 486,684 · +27.4%
- By 2050
- 549,805 · +44.0%
- By 2075
- 687,078 · +79.9%
- By 2100
- 754,495 · +97.5%
Race, ethnicity, and origin ACS 2023
- Neighborhood character
- Predominantly White (83%)
- Race & ethnicity
- White 83% Black 6% Two or more races 4% Asian 4% Hispanic / Latino 2%
- Common ancestry
- Lithuanian 5% Romanian 2% Portuguese 2%
- Foreign-born
- 5% · Canada
- Languages at home
- 94% English-only · Other Indo-European 3% Arabic 1% Spanish 1%
Political lean MEDSL · Hamilton
- 2024 margin
- Lean R (+6.1) · D 46.0% · R 52.1% · Other 1.9%
- 2008→2024 swing
- +16.2pp toward D · 2008: -22.2pp · 2024: -6.1pp
- All cycles
- 2024: R+6.1 2020: R+6.8 2016: R+19.6 2012: R+34.3 2008: R+22.2
Not yet ingested
- Civics
- —
Market trends
- HPI YoY
- ▼ -71.54%
- Current HPI
- 221.8703
- Rent YoY
- —
- Metro
- —
- State GDP YoY
- ▲ 2.90%
- F500 in state
- 18
Industry mix (Fortune 500 HQ in IN)
| Industry | F500 HQs | Revenue |
|---|---|---|
| Industrial Machinery | 2 | $37B |
|
||
| Healthcare | 1 | $177B |
|
||
| Pharmaceuticals | 1 | $45B |
|
||
| Metals / Steel | 1 | $18B |
|
||
| Agriculture | 1 | $17B |
|
||
| Packaging | 1 | $12B |
|
||
Price history
1 event — show timeline
- 2026-06-11 Listed $760,000 MIBOR as Distributed by MLS Grid
Cash-flow waterfall
monthlySold comps — $/sqft
last 12 mo · ≤1 miLoading sold comps…