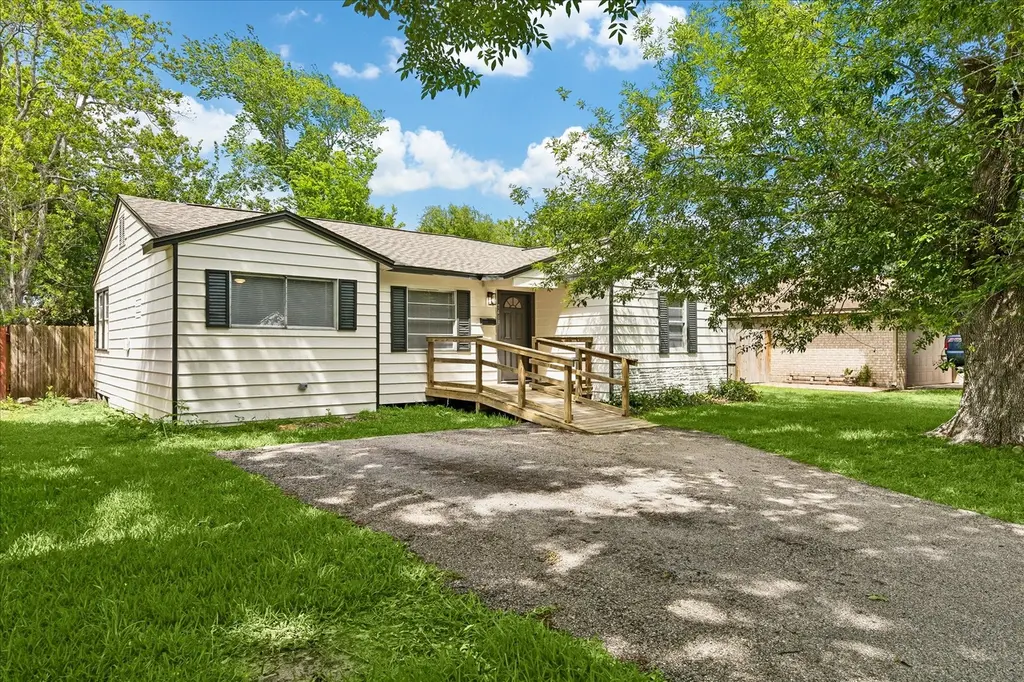
7413 Faith Dr · Deer Park, TX
Flood risk 1/10 · Minimal
- FEMA flood zone
- X (unshaded)
- Chance of flooding over 30 yrs
- 0.0%
- Est. flood insurance / yr
- $507 – $1,088
Fire risk 1/10 · Minimal
- Est. fire insurance / yr
- $1,222 – $2,270
Heat risk 9/10 · Severe
- Hot days now (above 108°F)
- 7 days/yr
- Hot days in 30 yrs
- 23 days/yr
Wind risk 9/10 · Severe
- Chance of severe wind over 30 yrs
- 99.0%
Air-quality risk 2/10 · Minimal
- Unhealthy air days now
- 2 days/yr
- Unhealthy air days in 30 yrs
- 2 days/yr
Risk factors via First Street. Map © Google.
Why this score? — see what drove the C- grade
The composite is a weighted blend of 9 inputs, each scored 0–100. Each bar is that input's sub-score; the figure is the points it added to the 100-point composite (weight × sub-score).
- Cash flow +16.4/30.0
- ARV discount +13.1/15.0
- 1% rule +5.7/10.0
- DSCR +5.1/10.0
- Schools +4.3/10.0
- Livability +3.6/5.0
- Rent growth +3.1/5.0
- Condition / age +2.5/5.0
- Appreciation +0.0/10.0
$189,000
🖨 Deal sheet (PDF) 📄 Offer letter ✓ Due diligence
Listing remarks MLS
Welcome to 7413 Faith Dr in Deer Park—a recently renovated home with modern updates throughout. Enjoy peace of mind with a new roof, along with stylish new flooring that creates a fresh, cohesive feel. The kitchen features updated countertops, while the bathroom has been refreshed with clean, contemporary finishes. Move-in ready and conveniently located near local amenities, this home offers both comfort and convenience in a well-established neighborhood.
Key facts
- Stylish new flooring
- Updated countertops
- New roof
Tags
Neighborhood map
What this means for you Summary
Snapshot
- This is a 4-bed/1.0-bath single-family listed at $189k.
Deal economics
- At list price, monthly cash flow is $109 ($1k/yr) — positive.
- The deal already cash-flows at list — no discount required.
- Meets the 1% rule at list price ($2k rent vs $189k).
- Recommended offer: $183k (3.0% below list) — sets the bar for market timing.
- Cap rate 7.0% vs local median 3.6% in Deer Park — top-decile yield for the area; either an underpriced asset or a hidden risk that comps aren't pricing in. Stress-test before assuming the spread holds.
Location & tenants
- Location reads 72/100 on livability (#244 in TX) — a middle-class / working-renter tenant base. Strengths: cost of living A+, housing A+, crime A; Watch: amenities C-, commute F.
- Deer Park ISD (suburban): math 50% / reading 47% proficiency, ranked #170 of 826 in TX (top 21%) — families likely to look elsewhere, expect single-tenant / working-renter base with shorter leases.
- Market conditions: Rents rising (+2.3%/yr); 170 active listings in the ZIP; 8 comparable units currently listed for rent nearby; rentals leasing fast (median 0d on market — plan ~1-2 weeks tenant-placement turnaround); solid renter incomes; 29,883 units permitted in Harris County in 2024 (8,621 in 5+ unit buildings).
Forward outlook
- Local home prices are declining (-3.0%/yr); year-one equity from $1k of loan paydown is wiped out by about $6k of value loss. Plan a longer hold.
- Harris County population projected at +47% by 2050 — long-run rental-demand tailwind backs the buy-and-hold thesis.
Negotiation context
- It's been on market 33 days — a 3% lower offer ($183k) is reasonable based on typical stale-listing flexibility.
- 3 sale attempts since 19y ago with the ask held roughly flat each time — persistent listings suggest the price (not the market) is what's stuck; bring a comps-based counter.
Risks & watch-outs
- Watch-outs: property tax is 2.7% of price; built in 1955 — expect roof / HVAC / electrical / plumbing capex.
- Climate carrying-cost: severe wind risk, 99% chance of damaging wind over 30y; extreme-heat days projected 7→23/yr by 2055 (HVAC capex compounding) — expect insurance premiums to compound above CPI over the hold.
Questions for the listing agent
- It's been on market 33 days. Have you received any prior offers? Is the seller open to a 3% concession, seller financing, or rate buy-down credit?
- Built in 1955 — when were the roof, HVAC, electrical panel, plumbing, and water heater last replaced?
- Property tax is high relative to price — has the assessment been appealed recently, and will the sale trigger a re-assessment?
- Is there a deadline driving the sale (1031 exchange, divorce, estate, relocation)? That informs how much negotiation room exists.
- What's the average days-on-market for RENTAL listings here right now (not sales)? A rising rental-DOM trend means longer vacancies and softer asking-rent achievability than the comps imply.
- What's the recent tenant-quality profile in this submarket — average credit score on applications, eviction rate, late-payment / NSF rate, and stable-employment percentage? A property-management company in the area should have these aggregated.
- How much new for-sale + rental construction is in the pipeline within 1–3 miles? Heavy new supply typically softens prices + rents 12–24 months out; constrained supply supports both.
Investment metrics
- 1% rule
- 1.07% ✓
- Cap rate
- 6.98%
- Cash-on-cash
- 2.46%
- DSCR
- 1.11
- GRM
- 7.8
CMA / ARV
- ARV (median comp)
- $216,070
- List price
- $189,000
- Delta
- -12.53%
- Verdict
- UNDERPRICED
- Comps
- 20 within 1.0 mi
Show comp detail 12 sales within ~0.75 mi
| Address | Dist | Beds/Ba | Sqft | Sold | Price | $/sf | Match |
|---|---|---|---|---|---|---|---|
| 7429 Valeda Dr | 0.23mi | 4/2.0 | 1,154 (-2%) | 4mo | $199,000 | $172 | 79 |
| 7406 Valeda Dr | 0.20mi | 3/2.0 (-1) | 1,155 (-2%) | 7mo | $205,000 | $177 | 73 |
| 7409 Elbridge Ln | 0.11mi | 3/1.5 (-1) | 1,176 (0%) | 19mo | $225,000 | $191 | 72 |
| 7433 W Lambuth Ln | 0.08mi | 3/1.0 (-1) | 1,240 (+5%) | 13mo | $219,900 | $177 | 71 |
| 7429 Elbridge Ln | 0.13mi | 3/2.0 (-1) | 1,070 (-9%) | 1mo | $219,900 | $206 | 69 |
| 7422 Carrie Ln | 0.20mi | 4/2.0 | 1,314 (+12%) | 8mo | $234,599 | $179 | 60 |
| 7417 Faith Dr | 0.01mi | 3/2.0 (-1) | 1,033 (-12%) | 16mo | $228,500 | $221 | 57 |
| 2606 Hillshire Dr | 0.66mi | 3/2.0 (-1) | 1,310 (+11%) | 2mo | $250,000 | $191 | 39 |
| 2522 Estate Dr | 0.62mi | 3/1.5 (-1) | 1,270 (+8%) | 19mo | $247,900 | $195 | 35 |
| 1109 E Rutgers Ln | 0.75mi | 3/1.5 (-1) | 1,095 (-7%) | 15mo | $225,900 | $206 | 34 |
| 2326 Estate Dr | 0.73mi | 3/1.0 (-1) | 1,016 (-14%) | 8mo | $197,500 | $194 | 32 |
| 2618 Kingsdale Dr | 0.55mi | 3/3.0 (-1) | 1,318 (+12%) | 15mo | $209,990 | $159 | 28 |
Match score weights: distance 35% · size 25% · config 20% · recency 20%. Top-matched comps best support the ARV.
Projected returns pro-forma
-3.0% appreciation · 2.26% rent growth · sell at horizon
- IRR
- -13.3%
- Equity multiple
- 0.53×
- Total profit
- $-25,057
- Equity at exit
- $28,181
- IRR
- -5.5%
- Equity multiple
- 0.65×
- Total profit
- $-18,369
- Equity at exit
- $16,341
Cash invested: $52,920 (down + closing). Projections, not guarantees.
Landlord ↔ Tenant lean methodology
- Overall (STATE)
- 87 Strongly Landlord-Friendly
- State Texas
- 87 Strongly Landlord-Friendly · R+5
- County
- — inherits STATE
- City
- — inherits STATE
ZIP-level market 77536
- Home prices YoY
- -24.8%
- Rents YoY
- 2.3%
- Active inventory
- 170
- Price-to-rent
- 7.8×
Monthly cashflow live
- Estimated rent
- $2,022 high interval (Pro) →
- Mortgage (P&I)
- −$991
- Tax from tax record
- −$419 /mo · $5,024/yr
- Insurance
- −$79
- HOA
- −$0
- Vacancy / Maint / Mgmt
- −$425
- Net cashflow
- $109
Break-even live
Sensitivity live
| Price | -10% $216 | -5% $162 | +0% $109 | +5% $55 | +10% $2 |
|---|---|---|---|---|---|
| Rent | -10% $-51 | -5% $29 | +0% $109 | +5% $189 | +10% $268 |
| Rate | -1.0pp $204 | -0.5pp $157 | base $109 | +0.5pp $60 | +1.0pp $10 |
UW: 25.0% down · 7.5% · 30yr · 1.5% tax · 5.0% vac · 8.0% maint · 8.0% mgmt
Financing live
Cash to close
- Down payment
- $47,250
- Closing costs
- $5,670
- Reserves months
- —
- Total cash needed
- —
Loan-product check · same deal, 3 products live
Conventional
25% down · 7.5% · 30yr
- Down + closing
- —
- Monthly P&I
- —
- Monthly cashflow
- —
- DSCR
- —
- Eligible?
- —
Personal DTI + credit; lowest rate.
DSCR
20% down · 8.5% · 30yr
- Down + closing
- —
- Monthly P&I
- —
- Monthly cashflow
- —
- DSCR
- —
- Eligible?
- —
No personal income docs; deal must DSCR.
Hard money
10% down · 12.0% · 12mo
- Down + closing
- —
- Monthly P&I
- —
- Monthly cashflow
- —
- DSCR
- —
- Eligible?
- —
Short-term bridge; refi at stabilization.
Rent comps 8 comps
| Address | Beds | Baths | Sqft | Rent | $/sqft | DOM | Units | Dist |
|---|---|---|---|---|---|---|---|---|
| 7201 Spencer Hwy Pasadena, TX | 1.0–3.0 | 1.0–2.0 | 925 | $1,600 | $1.73 | 44d | 18 | 0.42mi |
| 722 E Brown Ln Deer Park, TX | 3.0 | 2.0 | 1349 | $1,844 | $1.37 | 25d | 1 | 0.54mi |
| 7878 Spencer Hwy Unit 7911 Pasadena, TX | 3.0 | 2.0 | 1200 | $1,374 | $1.15 | 0d | 1 | 0.67mi |
| 500 W Pasadena Blvd Deer Park, TX | 2.0–4.0 | 2.0–3.0 | 1300 | $2,333 | $1.79 | 0d | 26 | 0.80mi |
| 800 W Pasadena Blvd Deer Park, TX | 3.0 | 1.0–2.0 | 965 | $2,510 | $2.60 | 0d | 17 | 0.81mi |
| 401 W Pasadena Blvd Deer Park, TX | 1.0–3.0 | 1.0–2.0 | 1038 | $2,090 | $2.01 | 0d | 20 | 0.83mi |
| 6565 Spencer Hwy Unit 6598 Pasadena, TX | 3.0 | 2.0 | 1200 | $1,594 | $1.33 | 0d | 1 | 0.83mi |
| 2824 Randolph Rd Unit 12 Pasadena, TX | 3.0 | 2.0 | 840 | $1,095 | $1.30 | 44d | 1 | 1.24mi |
Listing history 12 events
-
2026-05-19status Pending 468-char remark
Show marketing remark (468 chars)
Welcome to 7413 Faith Dr in Deer Park—a recently renovated home with modern updates throughout. Enjoy peace of mind with a new roof, along with stylish new flooring that creates a fresh, cohesive feel. The kitchen features updated countertops, while the bathroom has been refreshed with clean, contemporary finishes. Move-in ready and conveniently located near local amenities, this home offers both comfort and convenience in a well-established neighborhood.
-
2026-05-11status Pending 468-char remark
Show marketing remark (468 chars)
Welcome to 7413 Faith Dr in Deer Park—a recently renovated home with modern updates throughout. Enjoy peace of mind with a new roof, along with stylish new flooring that creates a fresh, cohesive feel. The kitchen features updated countertops, while the bathroom has been refreshed with clean, contemporary finishes. Move-in ready and conveniently located near local amenities, this home offers both comfort and convenience in a well-established neighborhood.
-
2026-04-15$189,000 Active 468-char remark
Show marketing remark (468 chars)
Welcome to 7413 Faith Dr in Deer Park—a recently renovated home with modern updates throughout. Enjoy peace of mind with a new roof, along with stylish new flooring that creates a fresh, cohesive feel. The kitchen features updated countertops, while the bathroom has been refreshed with clean, contemporary finishes. Move-in ready and conveniently located near local amenities, this home offers both comfort and convenience in a well-established neighborhood.
-
2008-09-23soldstatus
-
2007-09-20historical
-
2007-06-28$61,900
-
2007-06-27historical
-
2007-04-12$66,900
-
2006-03-15soldstatus
-
2005-06-07soldstatus
-
2005-06-07soldstatus
-
1994-01-02soldstatus
ⓘ Source: listings_history table (triggers on properties + properties_extension) + one-shot
backfill from property_details.listing_events for pre-trigger history.
Tax reassessment forecast TX · Resets to sale price
- Current annual tax
- $5,024 · $419/mo
- Projected year-2 tax
- $5,024 · $419/mo
- Expected delta
- $0/yr ($0/mo · 0.0%)
ⓘ Screening estimate from a state-policy table — verify with the county assessor before closing.
Climate risk First Street
- Flood 1/10 Low FEMA zone X (unshaded) · 0% chance over 30 yrs
- Wildfire 1/10 Low
- Heat 9/10 Extreme 7 d/yr ≥108°F today · 23 d/yr by 30 yrs out
- Wind 9/10 Extreme 99% chance of damaging wind over 30 yrs
- Air quality 2/10 Low 2 unhealthy d/yr today · 2 by 30 yrs out
Nearby sold comps map
Loading sold comps map…
Walkable amenities ~0.75 mi
Loading nearby amenities…
Taxation est. · year 1
- Rental income
- $24,262
- − Mortgage interest
- −$10,587
- − Property taxes
- −$5,024
- − Insurance
- −$945
- − Repairs & maintenance
- −$1,941
- − Management
- −$1,941
- − Depreciation
- −$5,498
- Taxable loss
- −$1,674
- Est. tax savings @ 24.0%
- +$402
- After-tax cash flow
- $1,706/yr
For passive investors: Depreciation is non-cash, so a rental often shows a tax loss while cash-flowing — sheltering income. Rental losses are passive: they offset passive income freely, and up to $25,000/yr can offset ordinary (W-2) income if you actively participate and your MAGI is under $100k (phasing out to $0 by $150k); unused losses carry forward. On sale, claimed depreciation is recaptured at up to 25%, and gains may owe capital-gains tax (a 1031 exchange can defer both). Figures are a year-1 estimate at your 24.0% rate — not tax advice; consult a CPA.
Schools (NCES district)
- District
- Deer Park ISD
- NCES district ID
- 4816530
- Math proficiency
- 50% ▼ -10.00%
- Reading proficiency
- 47% ▼ -3.00%
- Median HH income
- $68,227
- Composite
- 43.3/100
- National rank
- #3039
- State rank
- #170 of 826 in TX
Livability — Deer Park
- Score
- 72/100
- State rank
- #244
- US rank
- #5835
Category grades
Schools grade is shown separately in the Schools card above.
Census & demographics
- Census place
- Deer Park, TX
- County
- Harris County · 4,702,590 people
- City population
- 33,174
- Metro
- Houston-The Woodlands-Sugar Land, TX
- Population (ZIP)
- 33,174
- Household income
- $102,045
- Rent vs Own
- Severe rent burden
- 583.0
Population outlook (Harris County) Hauer SSP2
- Today (2025)
- 5,571,493 people
- By 2030
- 6,089,821 · +9.3%
- By 2040
- 7,142,806 · +28.2%
- By 2050
- 8,185,864 · +46.9%
- By 2075
- 10,574,329 · +89.8%
- By 2100
- 12,109,958 · +117.4%
Race, ethnicity, and origin ACS 2023
- Neighborhood character
- Majority White (58%)
- Race & ethnicity
- White 58% Hispanic / Latino 36% Two or more races 15% Black 3% Native American 1%
- Hispanic origin (detail)
- Mexican 33%
- Common ancestry
- Italian 3% Slovak 2% Lithuanian 2%
- Foreign-born
- 7% · Canada
- Languages at home
- 83% English-only · Spanish 17%
Political lean MEDSL · Harris
- 2024 margin
- Lean D (+5.5) · D 52.0% · R 46.4% · Other 1.6%
- 2008→2024 swing
- +3.9pp toward D · 2008: 1.6pp · 2024: 5.5pp
- All cycles
- 2024: D+5.5 2020: D+13.3 2016: D+12.4 2012: D+0.1 2008: D+1.6
Not yet ingested
- Civics
- —
Market trends
- HPI YoY
- ▼ -83.30%
- Current HPI
- 253.1973
- Rent YoY
- ▲ 2.26%
- Metro
- Houston-The Woodlands-Sugar Land, TX
- State GDP YoY
- ▲ 3.95%
- F500 in state
- 110
Industry mix (Fortune 500 HQ in TX)
| Industry | F500 HQs | Revenue |
|---|---|---|
| Energy | 16 | $1,198B |
|
||
| Technology | 5 | $198B |
|
||
| Engineering / Construction | 4 | $72B |
|
||
| Energy Services | 3 | $60B |
|
||
| Utilities | 3 | $41B |
|
||
| Healthcare | 2 | $330B |
|
||
Price history
+182.5% since first listed12 events — show timeline
- 2026-05-19 Pending — HARMLS
- 2026-05-11 Pending — HARMLS
- 2026-04-15 Listed $189,000 HARMLS
- 2008-09-23 Sold (Public Records) — Public Records
- 2007-09-20 Listing Removed — HARMLS
- 2007-06-28 Listed $61,900 HARMLS
- 2007-06-27 Listing Removed — HARMLS
- 2007-04-12 Listed $66,900 HARMLS
- 2006-03-15 Sold (Public Records) — Public Records
- 2005-06-07 Sold (Public Records) — Public Records
- 2005-06-07 Sold (Public Records) — Public Records
- 1994-01-02 Sold (Public Records) — Public Records
Property tax history
+5.3%/yrLatest (2025): $5,024 · +3.6% YoY. Source: county tax records.
Cash-flow waterfall
monthlySold comps — $/sqft
last 12 mo · ≤1 miLoading sold comps…