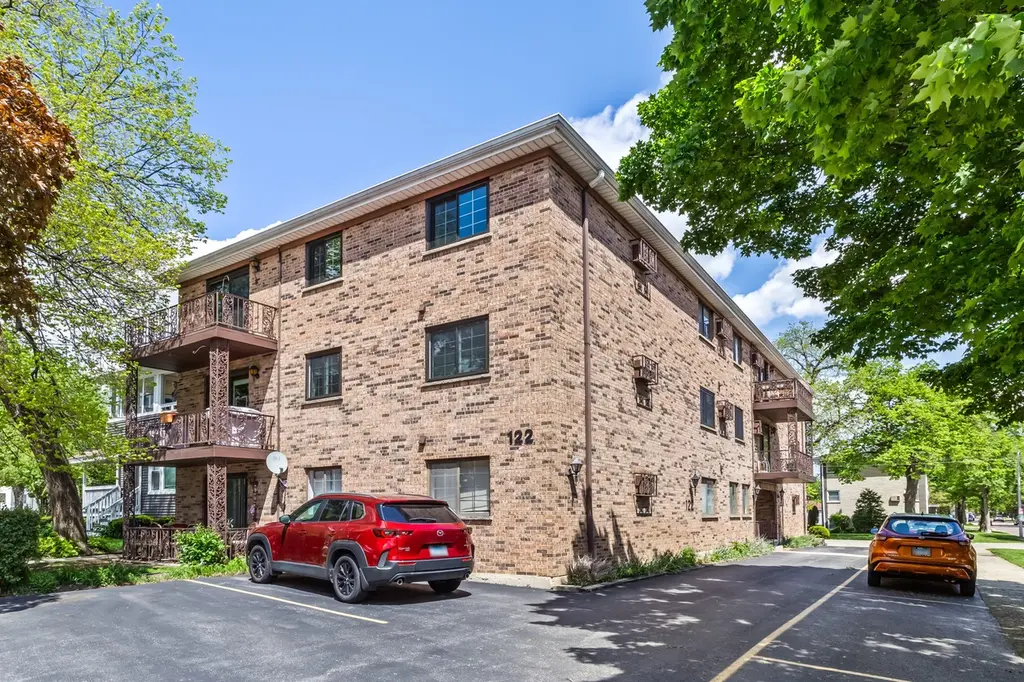
122 Circle Ave #307 · Forest Park, IL
Flood risk 1/10 · Minimal
- FEMA flood zone
- X (unshaded)
- Chance of flooding over 30 yrs
- 0.0%
- Est. flood insurance / yr
- $507 – $1,088
Fire risk 1/10 · Minimal
- Est. fire insurance / yr
- $804 – $1,492
Heat risk 3/10 · Minor
- Hot days now (above 100°F)
- 7 days/yr
- Hot days in 30 yrs
- 14 days/yr
Wind risk 2/10 · Minimal
- Chance of severe wind over 30 yrs
- 1.0%
Air-quality risk 5/10 · Moderate
- Unhealthy air days now
- 6 days/yr
- Unhealthy air days in 30 yrs
- 8 days/yr
Risk factors via First Street. Map © Google.
Why this score? — see what drove the D grade
The composite is a weighted blend of 9 inputs, each scored 0–100. Each bar is that input's sub-score; the figure is the points it added to the 100-point composite (weight × sub-score).
- Cash flow +13.9/30.0
- ARV discount +7.5/15.0
- 1% rule +5.6/10.0
- Livability +4.3/5.0
- DSCR +4.2/10.0
- Rent growth +3.2/5.0
- Condition / age +2.5/5.0
- Schools +1.4/10.0
- Appreciation +0.0/10.0
$165,000
🖨 Deal sheet (PDF) 📄 Offer letter ✓ Due diligence
Listing remarks
Spacious two bedroom, one full bath and one half bath condo in a fantastic Forest Park location. It's close to both downtown Forest Park and downtown Oak Park. The unit features brand new carpet and paint, a functional layout, and a separate dining area. Enjoy generous in-unit storage, plus an additional storage locker and bike room in the building. Laundry is conveniently located on-site, and one parking spot is included in the price. With the Metra and Green Line just a short walk away, this is an ideal spot for commuters and anyone looking to enjoy nearby shops, restaurants, and parks.
Key facts
- In-unit storage
- One parking spot
- Bike room
Tags
Property features AI
Finance
- Other: Nine-unit building; Ownership: condo; Not currently leased; Estimated living area; Directions: Harlem to Madison St, North on Circle to 122
- HOA & community: Monthly association fee of $250; Association fee includes water, parking, insurance and scavenger service; Association-managed coin laundry; Self-managed community; Pets allowed (cats and dogs); large maximum pet weight allowed
Exterior
- Parking: One parking space
- Utilities: Water from Lake Michigan and public supply; Public sewer
- Home design: Attached single condo; Entry level: 3
- Construction: Brick construction; Built approximately 51–60 years ago; Built before 1978
- Exterior features: Common lot/grounds
Interior
- Kitchen: Range; Microwave; Dishwasher; Refrigerator; Kitchen on main level (12 x 9)
- Bedrooms: Master bedroom on main level (16 x 11) with half bath; Second bedroom on main level (13 x 10); Two additional bedrooms
- Flooring: Carpet in living room, dining room, master bedroom and bedroom 2
- Bathrooms: One full bathroom; One half bathroom
- Heating & cooling: Electric heating; Wall cooling unit(s)
- Interior features: Five total rooms; Some photos are virtually staged
- Laundry & utility: Laundry room; Laundry in common area
Neighborhood map
What this means for you Summary
Snapshot
- This is a 2-bed/1.5-bath condo listed at $165k.
Deal economics
- At list price, monthly cash flow is $18 ($211/yr) — positive.
- The deal already cash-flows at list — no discount required.
- Meets the 1% rule at list price ($2k rent vs $165k).
- Recommended offer: $163k (1.5% below list) — sets the bar for market timing.
- Cap rate 6.4% vs local median 3.1% in Forest Park — top-decile yield for the area; either an underpriced asset or a hidden risk that comps aren't pricing in. Stress-test before assuming the spread holds.
Location & tenants
- Location reads 86/100 on livability (#20 in IL, #405 nationally) — a professional / high-income tenant draw. Strengths: amenities A+, commute A+, housing A+; Watch: crime F.
- Proviso Twp Hsd 209 (suburban): math 12% / reading 17% proficiency, ranked #507 of 620 in IL (top 82%) — low school quality limits family demand, transient renter base, plan for 1-2y turnover.
- Zoned schools: Garfield Elem School (196 students, 0% FRL); Forest Park Middle School (math 2% / reading 17%, grade F, #592 of 665 statewide, top 90%, 160 students, 0% FRL); Proviso West High School (math 6% / reading 11%, grade F, #584 of 693 statewide, top 85%, 1,868 students, 0% FRL).
- Market conditions: Rents rising (+2.8%/yr); 46 active listings in the ZIP; 32 comparable units currently listed for rent nearby; rentals at typical pace (median 15d on market — plan ~3-4 weeks tenant-placement turnaround); solid renter incomes; 6,272 units permitted in Cook County in 2024 (4,658 in 5+ unit buildings).
Forward outlook
- Local home prices are declining (-3.0%/yr); year-one equity from $1k of loan paydown is wiped out by about $5k of value loss. Plan a longer hold.
Negotiation context
- It's been on market 28 days — a 2% lower offer ($163k) is reasonable based on typical stale-listing flexibility.
- Current owner paid $70k; list at $165k implies a 136% gain — meaningful room to come down on a strong offer.
Questions for the listing agent
- Built in 1975 — when were the roof, HVAC, electrical panel, plumbing, and water heater last replaced?
- What does the HOA fee cover, when was the last increase, and are there any pending special assessments or reserve-fund shortfalls?
- Any open or pending special assessments — roof, HVAC, plumbing, elevator, façade? What's the per-unit balance and payoff schedule, and is the seller paying it off at close or rolling it to the buyer?
- Is there a deadline driving the sale (1031 exchange, divorce, estate, relocation)? That informs how much negotiation room exists.
- Crime grade is F in this area — have there been break-ins, vandalism, or insurance claims at this property in the last 3 years? What carrier currently insures it and at what premium?
- The area grade is low — what's the realistic commute time and amenity access for the typical tenant pool here? Any planned neighborhood developments (good or bad) we should know about?
- What's the average days-on-market for RENTAL listings here right now (not sales)? A rising rental-DOM trend means longer vacancies and softer asking-rent achievability than the comps imply.
- What's the recent tenant-quality profile in this submarket — average credit score on applications, eviction rate, late-payment / NSF rate, and stable-employment percentage? A property-management company in the area should have these aggregated.
- How much new apartment / multifamily construction is in the pipeline within 1–3 miles? Heavy new supply (>2% of stock underway) typically softens rents 12–24 months out; light construction supports rent growth.
Investment metrics
- 1% rule
- 1.06% ✓
- Cap rate
- 6.42%
- Cash-on-cash
- 0.46%
- DSCR
- 1.02
- GRM
- 7.8
CMA / ARV
No comps found within radius.
Projected returns pro-forma
-3.0% appreciation · 2.76% rent growth · sell at horizon
- IRR
- -15.8%
- Equity multiple
- 0.44×
- Total profit
- $-25,874
- Equity at exit
- $24,602
- IRR
- -7.6%
- Equity multiple
- 0.52×
- Total profit
- $-22,139
- Equity at exit
- $14,266
Cash invested: $46,200 (down + closing). Projections, not guarantees.
Landlord ↔ Tenant lean methodology
- Overall (STATE)
- 43 Moderately Tenant-Leaning
- State Illinois
- 43 Moderately Tenant-Leaning · D+7
- County
- — inherits STATE
- City
- — inherits STATE
ZIP-level market 60130
- Rents YoY
- 2.8%
- Active inventory
- 46
- Price-to-rent
- 7.8×
Monthly cashflow live
- Estimated rent
- $1,753 high interval (Pro) →
- Mortgage (P&I)
- −$865
- Tax from tax record
- −$183 /mo · $2,199/yr
- Insurance
- −$69
- HOA
- −$250
- Vacancy / Maint / Mgmt
- −$368
- Net cashflow
- $18
Break-even live
Sensitivity live
| Price | -10% $111 | -5% $64 | +0% $18 | +5% $-29 | +10% $-76 |
|---|---|---|---|---|---|
| Rent | -10% $-121 | -5% $-52 | +0% $18 | +5% $87 | +10% $156 |
| Rate | -1.0pp $101 | -0.5pp $60 | base $18 | +0.5pp $-25 | +1.0pp $-69 |
UW: 25.0% down · 7.5% · 30yr · 1.5% tax · 5.0% vac · 8.0% maint · 8.0% mgmt
Financing live
Cash to close
- Down payment
- $41,250
- Closing costs
- $4,950
- Reserves months
- —
- Total cash needed
- —
Loan-product check · same deal, 3 products live
Conventional
25% down · 7.5% · 30yr
- Down + closing
- —
- Monthly P&I
- —
- Monthly cashflow
- —
- DSCR
- —
- Eligible?
- —
Personal DTI + credit; lowest rate.
DSCR
20% down · 8.5% · 30yr
- Down + closing
- —
- Monthly P&I
- —
- Monthly cashflow
- —
- DSCR
- —
- Eligible?
- —
No personal income docs; deal must DSCR.
Hard money
10% down · 12.0% · 12mo
- Down + closing
- —
- Monthly P&I
- —
- Monthly cashflow
- —
- DSCR
- —
- Eligible?
- —
Short-term bridge; refi at stabilization.
Rent comps 32 comps
| Address | Beds | Baths | Sqft | Rent | $/sqft | DOM | Units | Dist |
|---|---|---|---|---|---|---|---|---|
| 7232 Randolph St Unit 401 Forest Park, IL | 1.0 | 1.0 | 645 | $1,400 | $2.17 | 1d | 1 | 0.15mi |
| 7232 Randolph St Unit 101 Forest Park, IL | 1.0 | 1.0 | 645 | $1,200 | $1.86 | 4d | 1 | 0.15mi |
| 111 Des Plaines Ave Unit B Forest Park, IL | 3.0 | 1.0 | 1100 | $1,900 | $1.73 | 26d | 1 | 0.18mi |
| 111 Des Plaines Ave Unit G Forest Park, IL | 2.0 | 1.0 | 900 | $1,400 | $1.56 | 26d | 1 | 0.18mi |
| 7443 Washington St #603 Forest Park, IL | 1.0 | 1.0 | 700 | $1,400 | $2.00 | 4d | 1 | 0.19mi |
| 7432 Washington St Forest Park, IL | 1.0–2.0 | 1.0–1.5 | 924 | $2,000 | $2.16 | 16d | 3 | 0.21mi |
| 300 Des Plaines Ave Forest Park, IL | 1.0 | 1.0 | 700 | $1,300 | $1.86 | 9d | 1 | 0.26mi |
| 1133 South Blvd Oak Park, IL | 3.0 | 1.0–2.0 | 1008 | $4,917 | $4.88 | 0d | 10 | 0.29mi |
| 1105 Pleasant St Oak Park, IL | 3.0 | 1.0–2.0 | 1410 | $5,400 | $3.83 | 0d | 8 | 0.33mi |
| 314 Lathrop Ave #404 Forest Park, IL | 1.0 | 1.0 | 675 | $1,500 | $2.22 | 26d | 1 | 0.35mi |
| 7522 Madison St Forest Park, IL | 2.0 | 1.0 | 958 | $2,695 | $2.81 | 26d | 1 | 0.38mi |
| 100 Forest Pl Oak Park, IL | 1.0–2.0 | 1.0–2.5 | 945 | $5,614 | $5.94 | 7d | 15 | 0.55mi |
| 1000 Lake St Oak Park, IL | 2.0 | 1.0–2.0 | 929 | $4,631 | $4.98 | 0d | 32 | 0.55mi |
| 520 Des Plaines Ave Forest Park, IL | 1.0–2.0 | 1.0–2.0 | 1050 | $1,999 | $1.90 | 26d | 1 | 0.57mi |
| 616 Circle Ave Unit 1 Forest Park, IL | 2.0 | 1.0 | 1100 | $2,350 | $2.14 | 4d | 1 | 0.61mi |
| 616 Circle Ave Forest Park, IL | 2.0 | 1.0 | 1100 | $2,350 | $2.14 | 26d | 1 | 0.61mi |
| 7745 Adams St Unit 3E Forest Park, IL | 1.0 | 1.0 | 850 | $1,395 | $1.64 | 9d | 1 | 0.66mi |
| 616 Lathrop Ave Forest Park, IL | 2.0 | 1.0 | 1000 | $1,695 | $1.70 | 26d | 1 | 0.67mi |
| 703 Madison St Unit 526 Oak Park, IL | 1.0 | 1.0 | 543 | $5,500 | $10.13 | 4d | 1 | 0.91mi |
| 846 Circle Ave #1 Forest Park, IL | 2.0 | 1.0 | 1100 | $2,000 | $1.82 | 13d | 1 | 0.93mi |
| 837 Lathrop Ave Unit GW Forest Park, IL | 1.0 | 1.0 | 790 | $1,480 | $1.87 | 19d | 1 | 0.95mi |
| 839 Dunlop Ave Unit 1244957P Forest Park, IL | 1.0 | 1.0 | 699 | $3,861 | $5.52 | 22d | 1 | 0.98mi |
| 839 Dunlop Ave Unit 1296499P Forest Park, IL | 1.0 | 1.0 | 699 | $3,590 | $5.14 | 8d | 1 | 0.98mi |
| 1030 Dunlop Ave Unit 2W Forest Park, IL | 2.0 | 1.0 | 990 | $1,695 | $1.71 | 26d | 1 | 1.19mi |
| 1030 Dunlop Ave Unit 2C Forest Park, IL | 2.0 | 1.0 | 990 | $1,695 | $1.71 | 5d | 1 | 1.19mi |
| 1114 Beloit Ave Forest Park, IL | 2.0 | 1.0 | 1072 | $2,800 | $2.61 | 14d | 1 | 1.24mi |
| 1124 Hannah Ave Unit 1F Forest Park, IL | 1.0 | 1.0 | 617 | $1,500 | $2.43 | 6d | 1 | 1.25mi |
| 1140 Lathrop Ave Unit 208 Forest Park, IL | 1.0 | 1.0 | 700 | $1,345 | $1.92 | 26d | 1 | 1.33mi |
| 7234 Roosevelt Rd Forest Park, IL | 2.0 | 1.0 | 850 | $1,895 | $2.23 | 20d | 1 | 1.34mi |
| 1128 Des Plaines Ave Forest Park, IL | 1.0 | 1.0 | 700 | $1,500 | $2.14 | 26d | 1 | 1.38mi |
| 1227 S Harlem Ave #215 Berwyn, IL | 1.0 | 1.0 | 700 | $1,545 | $2.21 | 7d | 1 | 1.41mi |
| 1031 S Dunlop Unit 1-w Forest Park, IL | 2.0 | 1.0 | 950 | $1,695 | $1.78 | 26d | 1 | 1.49mi |
HOA detail condo
- Monthly dues
- $250 · $3,000/yr
- Assessments
- None detected in remarks — confirm with the listing agent.
Listing history 13 events
-
2026-06-13statusdays on market $165,000 Pending 28 DOM
-
2026-06-09days on market $165,000 Contingent - No Showings 27 DOM
-
2026-06-08days on market $165,000 Contingent - No Showings 26 DOM
-
2026-06-07days on market $165,000 Contingent - No Showings 25 DOM
-
2026-06-04days on market $165,000 Contingent - No Showings 22 DOM
-
2026-06-03days on market $165,000 Contingent - No Showings 21 DOM
-
2026-06-02days on market $165,000 Contingent - No Showings 20 DOM
-
2026-06-01days on market $165,000 Contingent - No Showings 19 DOM
-
2026-05-31days on market $165,000 Contingent - No Showings 18 DOM
-
2026-05-17historical Contingent - No Showings
-
2026-05-12$165,000 Active
-
1992-05-12soldstatus $70,000
-
1988-11-02soldstatus $63,000
ⓘ Source: listings_history table (triggers on properties + properties_extension) + one-shot
backfill from property_details.listing_events for pre-trigger history.
Tax reassessment forecast IL · Partial reset (capped growth)
- Current annual tax
- $2,199 · $183/mo
- Projected year-2 tax
- $2,972 · $248/mo
- Expected delta
- +$773/yr (+$64/mo · 35.1%)
ⓘ Screening estimate from a state-policy table — verify with the county assessor before closing.
Climate risk First Street
- Flood 1/10 Low FEMA zone X (unshaded) · 0% chance over 30 yrs
- Wildfire 1/10 Low
- Heat 3/10 Moderate 7 d/yr ≥100°F today · 14 d/yr by 30 yrs out
- Wind 2/10 Low 100% chance of damaging wind over 30 yrs
- Air quality 5/10 Major 6 unhealthy d/yr today · 8 by 30 yrs out
Nearby sold comps map
Loading sold comps map…
Walkable amenities ~0.75 mi
Loading nearby amenities…
Taxation est. · year 1
- Rental income
- $21,036
- − Mortgage interest
- −$9,243
- − Property taxes
- −$2,199
- − Insurance
- −$825
- − Repairs & maintenance
- −$1,683
- − Management
- −$1,683
- − HOA
- −$3,000
- − Depreciation
- −$4,800
- Taxable loss
- −$2,396
- Est. tax savings @ 24.0%
- +$575
- After-tax cash flow
- $786/yr
For passive investors: Depreciation is non-cash, so a rental often shows a tax loss while cash-flowing — sheltering income. Rental losses are passive: they offset passive income freely, and up to $25,000/yr can offset ordinary (W-2) income if you actively participate and your MAGI is under $100k (phasing out to $0 by $150k); unused losses carry forward. On sale, claimed depreciation is recaptured at up to 25%, and gains may owe capital-gains tax (a 1031 exchange can defer both). Figures are a year-1 estimate at your 24.0% rate — not tax advice; consult a CPA.
Schools (NCES district)
- District
- Proviso Twp Hsd 209
- NCES district ID
- 1732910
- Math proficiency
- 12% ▼ -4.00%
- Reading proficiency
- 17% ▼ -3.00%
- Median HH income
- $51,744
- Composite
- 13.5/100
- National rank
- #9518
- State rank
- #507 of 620 in IL
Livability — Forest Park
- Score
- 86/100
- State rank
- #20
- US rank
- #405
Category grades
Schools grade is shown separately in the Schools card above.
Census & demographics
- Census place
- Forest Park, IL
- County
- Cook County · 4,486,803 people
- City population
- 13,943
- Metro
- Chicago-Naperville-Elgin, IL-IN-WI
- Population (ZIP)
- 13,943
- Household income
- $77,221
- Rent vs Own
- Severe rent burden
- 650.0
Population outlook (Cook County) Hauer SSP2
- Today (2025)
- 5,347,519 people
- By 2030
- 5,357,703 · +0.2%
- By 2040
- 5,324,924 · -0.4%
- By 2050
- 5,230,762 · -2.2%
- By 2075
- 4,785,735 · -10.5%
- By 2100
- 4,188,836 · -21.7%
Race, ethnicity, and origin ACS 2023
- Neighborhood character
- Diverse neighborhood (Simpson 0.64)
- Race & ethnicity
- White 53% Black 25% Hispanic / Latino 11% Two or more races 7% Asian 7%
- Hispanic origin (detail)
- Mexican 6% Puerto Rican 2%
- Common ancestry
- Romanian 5% Lithuanian 3% Serbian 2%
- Foreign-born
- 9% · Canada
- Languages at home
- 85% English-only · Spanish 8% Other Asian/Pacific 2% Arabic 2%
Political lean MEDSL · Cook
- 2024 margin
- Solid D (+42.0) · D 70.4% · R 28.4% · Other 1.2%
- 2008→2024 swing
- -11.4pp toward R · 2008: 53.4pp · 2024: 42.0pp
- All cycles
- 2024: D+42.0 2020: D+50.3 2016: D+53.0 2012: D+49.4 2008: D+53.4
Not yet ingested
- Civics
- —
Market trends
- HPI YoY
- ▼ -192.60%
- Current HPI
- 292.8802
- Rent YoY
- ▲ 2.76%
- Metro
- Chicago-Naperville-Elgin, IL-IN-WI
- State GDP YoY
- ▲ 1.59%
- F500 in state
- 60
Industry mix (Fortune 500 HQ in IL)
| Industry | F500 HQs | Revenue |
|---|---|---|
| Insurance | 4 | $201B |
|
||
| Consumer Goods | 4 | $87B |
|
||
| Industrial Machinery | 3 | $64B |
|
||
| Healthcare | 2 | $55B |
|
||
| Retail / Pharmacy | 1 | $148B |
|
||
| Agriculture / Food | 1 | $86B |
|
||
Price history
+161.9% since first listed4 events — show timeline
- 2026-05-17 Contingent — MRED as Distributed by MLS Grid
- 2026-05-12 Listed $165,000 MRED as Distributed by MLS Grid
- 1992-05-12 Sold (Public Records) $70,000 Public Records
- 1988-11-02 Sold (Public Records) $63,000 Public Records
Property tax history
+0.4%/yrLatest (2023): $2,199 · +126.2% YoY. Source: county tax records.
Cash-flow waterfall
monthlySold comps — $/sqft
last 12 mo · ≤1 miLoading sold comps…