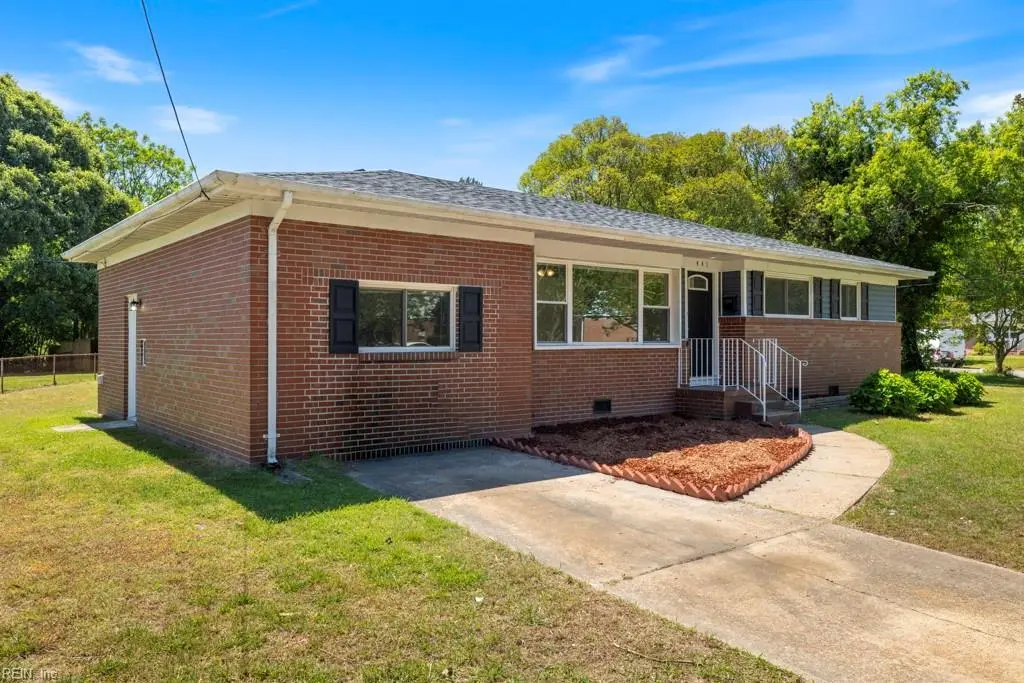
441 Beacon Hill Cir · Norfolk, VA
Flood risk 5/10 · Moderate
- FEMA flood zone
- X (shaded)
- Chance of flooding over 30 yrs
- 0.22%
- Est. flood insurance / yr
- $507 – $1,088
Fire risk 1/10 · Minimal
- Est. fire insurance / yr
- $666 – $1,236
Heat risk 9/10 · Severe
- Hot days now (above 106°F)
- 7 days/yr
- Hot days in 30 yrs
- 15 days/yr
Wind risk 8/10 · Major
- Chance of severe wind over 30 yrs
- 80.0%
Air-quality risk 5/10 · Moderate
- Unhealthy air days now
- 7 days/yr
- Unhealthy air days in 30 yrs
- 7 days/yr
Risk factors via First Street. Map © Google.
Why this score? — see what drove the D grade
The composite is a weighted blend of 9 inputs, each scored 0–100. Each bar is that input's sub-score; the figure is the points it added to the 100-point composite (weight × sub-score).
- Cash flow +10.7/30.0
- ARV discount +9.3/15.0
- Rent growth +5.0/5.0
- Livability +4.2/5.0
- Schools +3.5/10.0
- DSCR +3.1/10.0
- 1% rule +2.8/10.0
- Condition / age +2.5/5.0
- Appreciation +0.0/10.0
$335,000
🖨 Deal sheet (PDF) 📄 Offer letter ✓ Due diligence
Listing remarks
Check this beautifully ranch! Fresh paint throughout the house. Open floor plan with common area, bonus family room! Close to interstates.
Key facts
- 3 parking spots
- Built 1957
- Listed 44 days
Property features AI
Finance
- HOA & community: No HOA fees listed
Exterior
- Parking: Off-street parking; Driveway spaces; Street parking; Three parking spaces
- Utilities: City/County water; City/County sewer; Electric water heater; Electric power
- Home design: Detached home; Spanish style; One story / single living level; Crawl foundation
- Construction: Brick siding; Composite roof
- Exterior features: Corner lot; Patio; Additional outbuilding/structure
Interior
- Kitchen: Electric range; Microwave; Refrigerator; Dishwasher
- Bedrooms: Master bedroom (first floor); One bedroom with ensuite; Additional bedroom
- Flooring: Carpet; Wood
- Bathrooms: Two full bathrooms; Full bathroom on first floor
- Heating & cooling: Heat pump heating; Central air conditioning
- Interior features: Cable hookup; Ceiling fan; Window treatments
- Laundry & utility: Washer hookup; Dryer hookup; Utility room
Neighborhood map
What this means for you Summary
Snapshot
- This is a 4-bed/2.0-bath single-family listed at $335k.
Deal economics
- At list price, monthly cash flow is $-160 ($-2k/yr) — negative.
- To cash-flow at today's rent, offer at most $307k (8.4% below list).
- To meet the 1% rule (rent ≥ 1% of price), the offer needs to be $260k (22.5% below list).
- Recommended offer: $260k (22.5% below list) — sets the bar for 1% rule.
- Cap rate 5.7% vs local median 4.0% in Norfolk — top-decile yield for the area; either an underpriced asset or a hidden risk that comps aren't pricing in. Stress-test before assuming the spread holds.
Location & tenants
- Location reads 83/100 on livability (#43 in VA, #1,026 nationally) — a professional / high-income tenant draw. Strengths: amenities A+, commute A+, health & safety A+; Watch: employment C-, crime F.
- Norfolk City Public School District (urban): math 27% / reading 56% proficiency, ranked #118 of 131 in VA (top 90%) — families likely to look elsewhere, expect single-tenant / working-renter base with shorter leases.
- Zoned schools: Oceanair Elementary (math 17% / reading 43%, grade F, #1,008 of 1,108 statewide, top 91%, 435 students, 97% FRL); Booker T Washington High (math 26% / reading 70%, grade D, #303 of 319 statewide, top 95%, 947 students, 94% FRL) — zoned schools average 96% FRL vs 59% district-wide (37 pts higher); higher-poverty schools than district average — tighter screening recommended.
- Market conditions: Rents rising fast (+15.1%/yr); 78 active listings in the ZIP; 4 comparable units currently listed for rent nearby; rentals lingering (median 45d on market — plan ~5-8 weeks vacancy on turnover, expect pricing pressure); 50% of comp listings sitting > 30 days — soft ceiling on asking rent; 438 units permitted in Norfolk city in 2024 (273 in 5+ unit buildings).
- At $2,597/mo this rent would consume 49% of the median local household income ($63k/yr) (locally 1255% of renters already pay >50% of income on rent) — very limited rent-growth headroom before tenants either downsize or default.
Forward outlook
- Local home prices are declining (-3.0%/yr); year-one equity from $2k of loan paydown is wiped out by about $10k of value loss. Plan a longer hold.
Negotiation context
- It's been on market 45 days — a 3% lower offer ($325k) is reasonable based on typical stale-listing flexibility.
- 3 sale attempts since 6y ago; this cycle's ask has dropped $22k (6%) from the opening price — seller is motivated, your offer sets the floor, not the list.
- Current owner paid $241k; 39% above their basis — modest negotiation headroom, anchor on the comps not their cost.
Risks & watch-outs
- Watch-outs: built in 1957 — expect roof / HVAC / electrical / plumbing capex.
- Climate carrying-cost: moderate flood risk; severe wind risk, 80% chance of damaging wind over 30y; extreme-heat days projected 7→15/yr by 2055 (HVAC capex compounding) — expect insurance premiums to compound above CPI over the hold.
Questions for the listing agent
- What do current leases actually rent for vs. the listed asking? Can we see a recent rent roll and the last 12 months of T-12 income?
- It's been on market 45 days. Have you received any prior offers? Is the seller open to a 22% concession, seller financing, or rate buy-down credit?
- Built in 1957 — when were the roof, HVAC, electrical panel, plumbing, and water heater last replaced?
- Is there a deadline driving the sale (1031 exchange, divorce, estate, relocation)? That informs how much negotiation room exists.
- Schools are A-rated — typically a magnet for longer-tenancy family renters. What's the average tenant stay here, and is there a school-zone premium baked into asking?
- Crime grade is F in this area — have there been break-ins, vandalism, or insurance claims at this property in the last 3 years? What carrier currently insures it and at what premium?
- The area grade is low — what's the realistic commute time and amenity access for the typical tenant pool here? Any planned neighborhood developments (good or bad) we should know about?
- What's the average days-on-market for RENTAL listings here right now (not sales)? A rising rental-DOM trend means longer vacancies and softer asking-rent achievability than the comps imply.
- What's the recent tenant-quality profile in this submarket — average credit score on applications, eviction rate, late-payment / NSF rate, and stable-employment percentage? A property-management company in the area should have these aggregated.
- How much new for-sale + rental construction is in the pipeline within 1–3 miles? Heavy new supply typically softens prices + rents 12–24 months out; constrained supply supports both.
Investment metrics
- 1% rule
- 0.78% ✗
- Cap rate
- 5.72%
- Cash-on-cash
- -2.04%
- DSCR
- 0.91
- GRM
- 10.7
CMA / ARV
- ARV (median comp)
- $348,687
- List price
- $335,000
- Delta
- -3.93%
- Verdict
- FAIR
- Comps
- 20 within 1.0 mi
Show comp detail 11 sales within ~0.75 mi
| Address | Dist | Beds/Ba | Sqft | Sold | Price | $/sf | Match |
|---|---|---|---|---|---|---|---|
| 307 Beacon Hill Ct | 0.04mi | 4/2.5 | 1,377 (-4%) | 6mo | $339,900 | $247 | 85 |
| 493 Beacon Hill Cir | 0.18mi | 3/1.5 (-1) | 1,431 (0%) | 12mo | $306,000 | $214 | 74 |
| 5329 River Edge Rd | 0.51mi | 4/2.0 | 1,447 (+1%) | 4mo | $300,000 | $207 | 71 |
| 825 Round Bay Cir | 0.69mi | 4/2.0 | 1,443 (+1%) | 8mo | $350,000 | $243 | 60 |
| 5535 Sandpiper Ln | 0.33mi | 4/3.0 | 1,610 (+12%) | 4mo | $335,000 | $208 | 57 |
| 812 Round Bay Rd | 0.64mi | 3/2.0 (-1) | 1,444 (+1%) | 12mo | $325,000 | $225 | 54 |
| 3664 Kentucky Ave | 0.74mi | 3/2.0 (-1) | 1,485 (+4%) | 4mo | $285,000 | $192 | 51 |
| 3806 Wedgefield Ave | 0.68mi | 3/2.0 (-1) | 1,465 (+2%) | 11mo | $316,000 | $216 | 50 |
| 836 Townsend Pl | 0.59mi | 4/2.0 | 1,625 (+14%) | 1mo | $340,000 | $209 | 49 |
| 412 Wellman St | 0.68mi | 3/2.0 (-1) | 1,522 (+6%) | 8mo | $345,000 | $227 | 46 |
| 857 Round Bay Ct | 0.72mi | 4/2.0 | 1,590 (+11%) | 11mo | $265,000 | $167 | 39 |
Match score weights: distance 35% · size 25% · config 20% · recency 20%. Top-matched comps best support the ARV.
Projected returns pro-forma
-3.0% appreciation · 8.0% rent growth · sell at horizon
- IRR
- -14.5%
- Equity multiple
- 0.46×
- Total profit
- $-50,761
- Equity at exit
- $49,950
- IRR
- 0.6%
- Equity multiple
- 1.05×
- Total profit
- $5,060
- Equity at exit
- $28,965
Cash invested: $93,800 (down + closing). Projections, not guarantees.
Landlord ↔ Tenant lean methodology
- Overall (STATE)
- 55 Moderately Landlord-Leaning
- State Virginia
- 55 Moderately Landlord-Leaning · D+2
- County
- — inherits STATE
- City
- — inherits STATE
ZIP-level market 23502
- Home prices YoY
- -20.7%
- Rents YoY
- 15.1%
- Active inventory
- 78
- Price-to-rent
- 10.7×
Monthly cashflow live
- Estimated rent
- $2,597 medium interval (Pro) →
- Mortgage (P&I)
- −$1,757
- Tax from tax record
- −$315 /mo · $3,780/yr
- Insurance
- −$140
- HOA
- −$0
- Vacancy / Maint / Mgmt
- −$545
- Net cashflow
- $-160
Break-even live
Sensitivity live
| Price | -10% $30 | -5% $-65 | +0% $-160 | +5% $-255 | +10% $-349 |
|---|---|---|---|---|---|
| Rent | -10% $-365 | -5% $-262 | +0% $-160 | +5% $-57 | +10% $45 |
| Rate | -1.0pp $9 | -0.5pp $-75 | base $-160 | +0.5pp $-247 | +1.0pp $-335 |
UW: 25.0% down · 7.5% · 30yr · 1.5% tax · 5.0% vac · 8.0% maint · 8.0% mgmt
Financing live
Cash to close
- Down payment
- $83,750
- Closing costs
- $10,050
- Reserves months
- —
- Total cash needed
- —
Loan-product check · same deal, 3 products live
Conventional
25% down · 7.5% · 30yr
- Down + closing
- —
- Monthly P&I
- —
- Monthly cashflow
- —
- DSCR
- —
- Eligible?
- —
Personal DTI + credit; lowest rate.
DSCR
20% down · 8.5% · 30yr
- Down + closing
- —
- Monthly P&I
- —
- Monthly cashflow
- —
- DSCR
- —
- Eligible?
- —
No personal income docs; deal must DSCR.
Hard money
10% down · 12.0% · 12mo
- Down + closing
- —
- Monthly P&I
- —
- Monthly cashflow
- —
- DSCR
- —
- Eligible?
- —
Short-term bridge; refi at stabilization.
Rent comps 4 comps
| Address | Beds | Baths | Sqft | Rent | $/sqft | DOM | Units | Dist |
|---|---|---|---|---|---|---|---|---|
| 5931 Sellger Dr Norfolk, VA | 3.0 | 2.0 | 1650 | $2,550 | $1.55 | 44d | 1 | 0.98mi |
| 3556 Riverside Dr Norfolk, VA | 3.0 | 1.0 | 1084 | $1,950 | $1.80 | 18d | 1 | 1.09mi |
| 6163 Kempsville Cir Norfolk, VA | 1.0–3.0 | 1.0–2.0 | 1120 | $3,008 | $2.69 | 3d | 12 | 1.37mi |
| 6114 Lyndhurst Ave Norfolk, VA | 3.0 | 2.0 | 1600 | $2,395 | $1.50 | 44d | 1 | 1.41mi |
Listing history 19 events
-
2026-06-21days on market $335,000 Active 45 DOM
-
2026-06-18days on market $335,000 Active 42 DOM
-
2026-06-17days on market $335,000 Active 41 DOM
-
2026-06-16pricedays on market $335,000 Active 40 DOM
-
2026-06-15days on market $339,901 Active 39 DOM
-
2026-06-13pricedays on market $339,901 Active 37 DOM
-
2026-06-09days on market $339,900 Active 33 DOM
-
2026-06-08days on market $339,900 Active 32 DOM
-
2026-06-07pricedays on market $339,900 Active 31 DOM
-
2026-06-03days on market $345,000 Active 27 DOM
-
2026-06-02days on market $345,000 Active 26 DOM
-
2026-06-01days on market $345,000 Active 25 DOM
-
2026-05-31days on market $345,000 Active 24 DOM
-
2026-05-15price $345,000 138-char remark
-
2026-05-07$357,000 Active 138-char remark
-
2020-10-29soldstatus $241,150
-
2020-10-02status Under Contract
-
2020-09-17historical Active Under Contract
-
2020-09-10$254,900 Active
ⓘ Source: listings_history table (triggers on properties + properties_extension) + one-shot
backfill from property_details.listing_events for pre-trigger history.
Tax reassessment forecast VA · Resets to sale price
- Current annual tax
- $3,780 · $315/mo
- Projected year-2 tax
- $3,780 · $315/mo
- Expected delta
- $0/yr ($0/mo · 0.0%)
ⓘ Screening estimate from a state-policy table — verify with the county assessor before closing.
Climate risk First Street
- Flood 5/10 Major FEMA zone X (shaded) · 22% chance over 30 yrs
- Wildfire 1/10 Low
- Heat 9/10 Extreme 7 d/yr ≥106°F today · 15 d/yr by 30 yrs out
- Wind 8/10 Severe 80% chance of damaging wind over 30 yrs
- Air quality 5/10 Major 7 unhealthy d/yr today · 7 by 30 yrs out
Nearby sold comps map
Loading sold comps map…
Walkable amenities ~0.75 mi
Loading nearby amenities…
Taxation est. · year 1
- Rental income
- $31,163
- − Mortgage interest
- −$18,765
- − Property taxes
- −$3,780
- − Insurance
- −$1,675
- − Repairs & maintenance
- −$2,493
- − Management
- −$2,493
- − Depreciation
- −$9,745
- Taxable loss
- −$7,788
- Est. tax savings @ 24.0%
- +$1,869
- After-tax cash flow
- $-48/yr
For passive investors: Depreciation is non-cash, so a rental often shows a tax loss while cash-flowing — sheltering income. Rental losses are passive: they offset passive income freely, and up to $25,000/yr can offset ordinary (W-2) income if you actively participate and your MAGI is under $100k (phasing out to $0 by $150k); unused losses carry forward. On sale, claimed depreciation is recaptured at up to 25%, and gains may owe capital-gains tax (a 1031 exchange can defer both). Figures are a year-1 estimate at your 24.0% rate — not tax advice; consult a CPA.
Schools (NCES district)
- District
- Norfolk City Public School District
- NCES district ID
- 5102670
- Math proficiency
- 27% ▼ -44.00%
- Reading proficiency
- 56% ▼ -10.00%
- Median HH income
- $44,358
- Composite
- 35.08/100
- National rank
- #5026
- State rank
- #118 of 131 in VA
Livability — Norfolk
- Score
- 83/100
- State rank
- #43
- US rank
- #1026
Category grades
Schools grade is shown separately in the Schools card above.
Census & demographics
- Census place
- Norfolk, VA
- County
- Norfolk City · 214,042 people
- City population
- 214,042
- Metro
- Virginia Beach-Norfolk-Newport News, VA-NC
- Population (ZIP)
- 20,399
- Household income
- $63,208
- Rent vs Own
- Severe rent burden
- 1255.0
Population outlook (Norfolk County) Hauer SSP2
- Today (2025)
- 249,032 people
- By 2030
- 252,347 · +1.3%
- By 2040
- 253,644 · +1.9%
- By 2050
- 251,913 · +1.2%
- By 2075
- 245,281 · -1.5%
- By 2100
- 219,548 · -11.8%
Race, ethnicity, and origin ACS 2023
- Neighborhood character
- Diverse neighborhood (Simpson 0.67)
- Race & ethnicity
- Black 46% White 31% Hispanic / Latino 12% Two or more races 9% Asian 4%
- Hispanic origin (detail)
- Mexican 4% Puerto Rican 2% Dominican 2%
- Common ancestry
- Portuguese 1% Romanian 1% Slovak 1%
- Foreign-born
- 9% · Canada, Jamaica
- Languages at home
- 88% English-only · Spanish 6% Tagalog/Filipino 3% Other Indo-European 1%
Political lean MEDSL · Norfolk
- 2024 margin
- Solid D (+41.5) · D 70.0% · R 28.5% · Other 1.6%
- 2008→2024 swing
- -1.4pp toward R · 2008: 43.0pp · 2024: 41.5pp
- All cycles
- 2024: D+41.5 2020: D+45.6 2016: D+42.0 2012: D+44.0 2008: D+43.0
Not yet ingested
- Civics
- —
Market trends
- HPI YoY
- ▼ -83.50%
- Current HPI
- 320.4522
- Rent YoY
- ▲ 15.10%
- Metro
- Virginia Beach-Norfolk-Newport News, VA-NC
- State GDP YoY
- ▲ 2.40%
- F500 in state
- 50
Industry mix (Fortune 500 HQ in VA)
| Industry | F500 HQs | Revenue |
|---|---|---|
| Aerospace / Defense | 4 | $236B |
|
||
| Technology / Defense | 3 | $32B |
|
||
| Financial Services | 2 | $176B |
|
||
| Utilities | 2 | $27B |
|
||
| Insurance | 2 | $25B |
|
||
| Technology | 2 | $15B |
|
||
Price history
+31.4% since first listed11 events — show timeline
- 2026-06-16 Price Changed $335,000 REINMLS
- 2026-06-12 Price Changed $339,901 REINMLS
- 2026-06-04 Price Changed $339,900 REINMLS
- 2026-05-23 Relisted — REINMLS
- 2026-05-22 Contingent — REINMLS
- 2026-05-15 Price Changed $345,000 REINMLS
- 2026-05-07 Listed $357,000 REINMLS
- 2020-10-29 Sold (Public Records) $241,150 Public Records
- 2020-10-02 Pending — REINMLS
- 2020-09-17 Contingent — REINMLS
- 2020-09-10 Listed $254,900 REINMLS
Property tax history
+5.3%/yrLatest (2025): $3,780 · +6.1% YoY. Source: county tax records.
Cash-flow waterfall
monthlySold comps — $/sqft
last 12 mo · ≤1 miLoading sold comps…