11303 Chicago Ave · Bayonet Point, FL
Flood risk 1/10 · Minimal
- FEMA flood zone
- X (unshaded)
- Chance of flooding over 30 yrs
- 0.0%
- Est. flood insurance / yr
- $507 – $1,088
Fire risk 3/10 · Minor
- Est. fire insurance / yr
- $947 – $1,759
Heat risk 10/10 · Severe
- Hot days now (above 108°F)
- 7 days/yr
- Hot days in 30 yrs
- 25 days/yr
Wind risk 10/10 · Severe
- Chance of severe wind over 30 yrs
- 99.0%
Air-quality risk 2/10 · Minimal
- Unhealthy air days now
- 1 days/yr
- Unhealthy air days in 30 yrs
- 3 days/yr
Risk factors via First Street. Map © Google.
Why this score? — see what drove the B grade
The composite is a weighted blend of 9 inputs, each scored 0–100. Each bar is that input's sub-score; the figure is the points it added to the 100-point composite (weight × sub-score).
- Cash flow +28.0/30.0
- ARV discount +15.0/15.0
- DSCR +9.9/10.0
- 1% rule +6.6/10.0
- Schools +4.3/10.0
- Livability +3.5/5.0
- Condition / age +2.5/5.0
- Rent growth +2.0/5.0
- Appreciation +0.0/10.0
$149,900
🖨 Deal sheet (PDF) 📄 Offer letter ✓ Due diligence
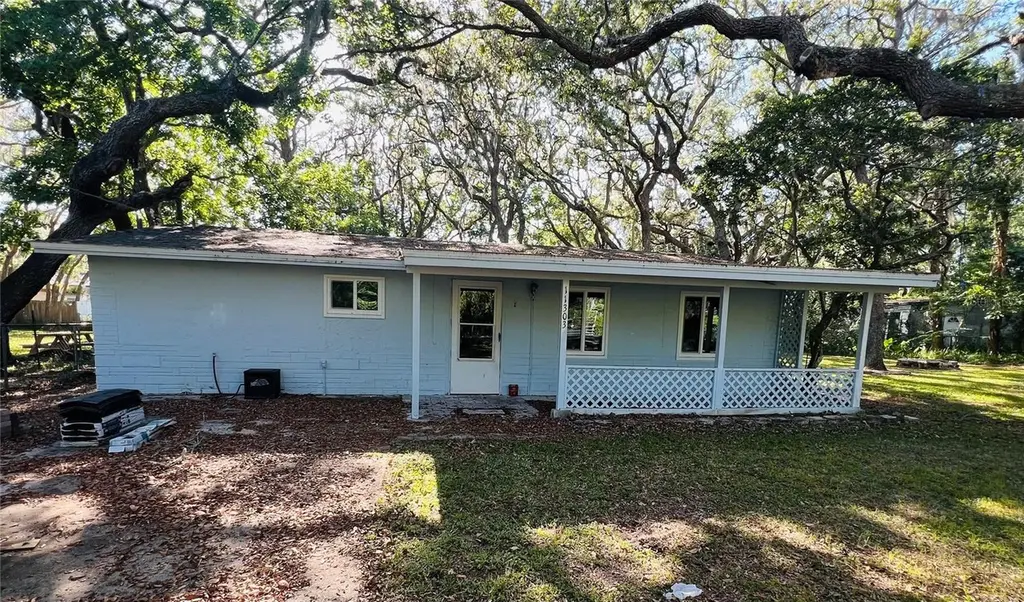
Listing remarks
Under contract-accepting backup offers. One or more photo(s) has been virtually staged. LOOKING FOR AN INVESTMENT PROPERTY TO FIX AND FLIP, OR A RENTAL, OR MAYBE LOOKING FOR A PROPERTY THAT HAS GOOD BONES AND WANT TO MAKE IT YOUR OWN, THIS PROPERTY COMES WITH A NEWER ROOF, NEWER MINI SPLIT, NEWER WINDOW IN MOST OF THE HOME, THIS 3/2 PROPERTY ON ALMOST A HALF AN ACRE FULLY FENCED YARD WITH 2 GATES TO BRING ALL YOUR TOYS, ADD A POOL AND A BIG GARAGE, THIS PROPERTY HAS SUCH GREAT POTENTIAL. NEED THAT SAVVY INVESTOR OR HOME BUYER LOOKING FOR A SECOND HOME. NO HOA, NO FLOOD ZONE, SO CLOSE TO EVERYTHING BUT YET FEELS LIKE YOUR OUT IN THE COUNTRY.
Key facts
- 2 gates
- Newer window
- Newer roof
Tags
Property features AI
Finance
- Other: Zoning: R1MH; Total acreage: Approximately 0.32 acres (102 x 136 x 102 x 136); Number of wells: 1; Number of septics: 1; Living area: 1,104 sq ft (building area 1,248 sq ft); Listing contact: 727-861-0861; Directions: 52 to Chicago, home down on right
- HOA & community: No association; Community features: None; Pets allowed: Cats and dogs permitted
Exterior
- Parking: Driveway (open)
- Utilities: Private well water; Private sewer / septic tank; Cable available; Electricity available; Phone available; Water and sewer available
- Home design: Single-family residence; One-story; Facing east; Property condition: Fixer
- Construction: Block, stucco, and frame construction; Shingle and other roof types; Slab foundation; Built on one level
- Exterior features: Covered front porch; Chain link fencing; Level, oversized lot; Paved surfaces; Near public transit; In-county location; Oak trees on property
Interior
- Kitchen: Range; Refrigerator; Electric water heater
- Bedrooms: 3 bedrooms
- Flooring: Concrete floors; Tile floors
- Bathrooms: 2 full bathrooms
- Heating & cooling: Heating: Other; Cooling: Mini-split unit(s)
- Interior features: Kitchen open to family room; Split bedroom layout; Walk-in closet(s); Inside utility room; Wood-burning fireplace in living room
- Laundry & utility: Laundry room with washer and electric dryer hookups
Neighborhood map
What this means for you Summary
Snapshot
- This is a 2-bed/1.0-bath single-family listed at $150k.
Deal economics
- At list price, monthly cash flow is $465 ($6k/yr) — positive.
- The deal already cash-flows at list — no discount required.
- Meets the 1% rule at list price ($2k rent vs $150k).
- Recommended offer: $148k (1.5% below list) — sets the bar for market timing.
- Cap rate 10.0% vs local median 5.3% in Bayonet Point — top-decile yield for the area; either an underpriced asset or a hidden risk that comps aren't pricing in. Stress-test before assuming the spread holds.
Location & tenants
- Location reads 69/100 on livability (#485 in FL) — a middle-class / working-renter tenant base. Strengths: cost of living A+, housing A+, health & safety A+; Watch: crime D+, amenities D+, commute F.
- Pasco (suburban): math 50% / reading 52% proficiency, ranked #32 of 73 in FL (top 44%) — acceptable for families but not a draw, mixed tenant base, ~2y average lease.
- Zoned schools: Schrader Elementary School (math 38% / reading 35%, grade F, #1,656 of 2,144 statewide, top 78%, 601 students, 82% FRL); Bayonet Point Middle School (math 38% / reading 35%, grade F, #405 of 571 statewide, top 72%, 737 students, 84% FRL); Fivay High School (math 20% / reading 28%, grade F, #529 of 667 statewide, top 80%, 1,610 students, 78% FRL) — zoned schools average 82% FRL vs 48% district-wide (33 pts higher); higher-poverty schools than district average — tighter screening recommended.
- Zoned-school proficiency averages 32% at this address vs 51% district-wide (-19 pts) — the specific schools serving this property underperform the Pasco average; the district grade overstates school quality for this exact location.
- Market conditions: Rents soft (-1.9%/yr); 360 active listings in the ZIP; 8 comparable units currently listed for rent nearby; rentals at typical pace (median 27d on market — plan ~3-4 weeks tenant-placement turnaround); 6,765 units permitted in Pasco County in 2024 (1,250 in 5+ unit buildings).
Forward outlook
- Local home prices are declining (-3.0%/yr); year-one equity from $1k of loan paydown is wiped out by about $4k of value loss. Plan a longer hold.
- Pasco County population projected at +29% by 2050 — long-run rental-demand tailwind backs the buy-and-hold thesis.
Negotiation context
- It's been on market 17 days — a 2% lower offer ($148k) is reasonable based on typical stale-listing flexibility.
- 3 sale attempts with the ask held roughly flat each time — persistent listings suggest the price (not the market) is what's stuck; bring a comps-based counter.
- Current owner paid $110k; 36% above their basis — modest negotiation headroom, anchor on the comps not their cost.
Risks & watch-outs
- Climate carrying-cost: severe wind risk, 99% chance of damaging wind over 30y; extreme-heat days projected 7→25/yr by 2055 (HVAC capex compounding) — expect insurance premiums to compound above CPI over the hold.
Questions for the listing agent
- Built in 1968 — when were the roof, HVAC, electrical panel, plumbing, and water heater last replaced?
- Is there a deadline driving the sale (1031 exchange, divorce, estate, relocation)? That informs how much negotiation room exists.
- Schools are F-rated, which usually means shorter tenancies and higher turnover. Who's the typical renter profile here, and what's been the actual vacancy rate?
- Crime grade is D in this area — have there been break-ins, vandalism, or insurance claims at this property in the last 3 years? What carrier currently insures it and at what premium?
- What's the average days-on-market for RENTAL listings here right now (not sales)? A rising rental-DOM trend means longer vacancies and softer asking-rent achievability than the comps imply.
- What's the recent tenant-quality profile in this submarket — average credit score on applications, eviction rate, late-payment / NSF rate, and stable-employment percentage? A property-management company in the area should have these aggregated.
- How much new for-sale + rental construction is in the pipeline within 1–3 miles? Heavy new supply typically softens prices + rents 12–24 months out; constrained supply supports both.
Investment metrics
- 1% rule
- 1.16% ✓
- Cap rate
- 10.02%
- Cash-on-cash
- 13.30%
- DSCR
- 1.59
- GRM
- 7.2
CMA / ARV
- ARV (on-the-fly)
- $243,984
- Comps found
- 6
Show comp detail 6 sales within ~0.75 mi
| Address | Dist | Beds/Ba | Sqft | Sold | Price | $/sf | Match |
|---|---|---|---|---|---|---|---|
| 10821 Candy Ln | 0.42mi | 2/1.0 | 1,150 (+4%) | 2mo | $299,999 | $261 | 72 |
| 11238 Owl Ln | 0.68mi | 2/2.0 | 1,169 (+6%) | 1mo | $281,000 | $240 | 54 |
| 8832 Huntsman Ln | 0.62mi | 3/1.0 (+1) | 1,100 (-0%) | 22mo | $180,000 | $164 | 48 |
| 11423 Nest Ct | 0.60mi | 2/2.0 | 1,187 (+8%) | 17mo | $210,000 | $177 | 41 |
| 8808 Briar Patch Dr | 0.72mi | 2/2.0 | 1,133 (+3%) | 23mo | $250,000 | $221 | 39 |
| 11419 Fox Run | 0.56mi | 2/2.0 | 1,264 (+14%) | 22mo | $258,000 | $204 | 27 |
Match score weights: distance 35% · size 25% · config 20% · recency 20%. Top-matched comps best support the ARV.
Projected returns pro-forma
-3.0% appreciation · 0.0% rent growth · sell at horizon
- IRR
- 0.1%
- Equity multiple
- 1.00×
- Total profit
- $200
- Equity at exit
- $22,351
- IRR
- 6.7%
- Equity multiple
- 1.44×
- Total profit
- $18,462
- Equity at exit
- $12,961
Cash invested: $41,972 (down + closing). Projections, not guarantees.
Landlord ↔ Tenant lean methodology
- Overall (STATE)
- 87 Strongly Landlord-Friendly
- State Florida
- 87 Strongly Landlord-Friendly · R+3
- County
- — inherits STATE
- City
- — inherits STATE
ZIP-level market 34654
- Home prices YoY
- -12.7%
- Rents YoY
- -1.9%
- Active inventory
- 360
- Price-to-rent
- 7.2×
Monthly cashflow live
- Estimated rent
- $1,734 high interval (Pro) →
- Mortgage (P&I)
- −$786
- Tax from tax record
- −$56 /mo · $675/yr
- Insurance
- −$62
- HOA
- −$0
- Vacancy / Maint / Mgmt
- −$364
- Net cashflow
- $465
Break-even live
Sensitivity live
| Price | -10% $550 | -5% $508 | +0% $465 | +5% $423 | +10% $380 |
|---|---|---|---|---|---|
| Rent | -10% $328 | -5% $397 | +0% $465 | +5% $534 | +10% $602 |
| Rate | -1.0pp $541 | -0.5pp $503 | base $465 | +0.5pp $426 | +1.0pp $387 |
UW: 25.0% down · 7.5% · 30yr · 1.5% tax · 5.0% vac · 8.0% maint · 8.0% mgmt
Financing live
Cash to close
- Down payment
- $37,475
- Closing costs
- $4,497
- Reserves months
- —
- Total cash needed
- —
Loan-product check · same deal, 3 products live
Conventional
25% down · 7.5% · 30yr
- Down + closing
- —
- Monthly P&I
- —
- Monthly cashflow
- —
- DSCR
- —
- Eligible?
- —
Personal DTI + credit; lowest rate.
DSCR
20% down · 8.5% · 30yr
- Down + closing
- —
- Monthly P&I
- —
- Monthly cashflow
- —
- DSCR
- —
- Eligible?
- —
No personal income docs; deal must DSCR.
Hard money
10% down · 12.0% · 12mo
- Down + closing
- —
- Monthly P&I
- —
- Monthly cashflow
- —
- DSCR
- —
- Eligible?
- —
Short-term bridge; refi at stabilization.
Rent comps 8 comps
| Address | Beds | Baths | Sqft | Rent | $/sqft | DOM | Units | Dist |
|---|---|---|---|---|---|---|---|---|
| 9440 Bourbon St Unit 9 New Port Richey, FL | 2.0 | 1.0 | 700 | $1,275 | $1.82 | 26d | 1 | 0.23mi |
| 9444 Bourbon St Unit 12 New Port Richey, FL | 3.0 | 2.0 | 1152 | $1,875 | $1.63 | 26d | 1 | 0.24mi |
| 11635 Salmon Dr Port Richey, FL | 2.0 | 1.5 | 816 | $1,500 | $1.84 | 26d | 1 | 1.02mi |
| 12221 Holbrook Dr Bayonet Point, FL | 1.0–2.0 | 1.0–2.0 | 761 | $1,685 | $2.21 | 0d | 55 | 1.11mi |
| 8431 Duval Dr Port Richey, FL | 3.0 | 2.0 | 1408 | $1,731 | $1.23 | 7d | 1 | 1.31mi |
| 8161 Braddock Cir #1 Port Richey, FL | 2.0 | 2.0 | 1000 | $1,595 | $1.59 | 20d | 1 | 1.33mi |
| 10331 Flagship Ave Port Richey, FL | 3.0 | 2.0 | 1400 | $2,000 | $1.43 | 26d | 1 | 1.39mi |
| 12200 Hudson Ridge Dr Port Richey, FL | 2.0–3.0 | 2.0 | 1107 | $1,468 | $1.33 | 5d | 10 | 1.50mi |
Listing history 10 events
-
2026-05-14status Pending
-
2026-05-05status Active
-
2026-04-28status Pending
-
2026-04-19$149,900 Active
-
2025-12-15soldstatus $110,000
-
2025-10-24status Pending
-
2025-10-24historical
-
2025-10-13$164,900 Active
-
1998-10-28soldstatus $39,500
-
1996-02-09soldstatus $30,000
ⓘ Source: listings_history table (triggers on properties + properties_extension) + one-shot
backfill from property_details.listing_events for pre-trigger history.
Tax reassessment forecast FL · Resets to sale price
- Current annual tax
- $675 · $56/mo
- Projected year-2 tax
- $1,244 · $104/mo
- Expected delta
- +$570/yr (+$47/mo · 84.5%)
ⓘ Screening estimate from a state-policy table — verify with the county assessor before closing.
Climate risk First Street
- Flood 1/10 Low FEMA zone X (unshaded) · 0% chance over 30 yrs
- Wildfire 3/10 Moderate
- Heat 10/10 Extreme 7 d/yr ≥108°F today · 25 d/yr by 30 yrs out
- Wind 10/10 Extreme 99% chance of damaging wind over 30 yrs
- Air quality 2/10 Low 1 unhealthy d/yr today · 3 by 30 yrs out
Nearby sold comps map
Loading sold comps map…
Walkable amenities ~0.75 mi
Loading nearby amenities…
Taxation est. · year 1
- Rental income
- $20,809
- − Mortgage interest
- −$8,397
- − Property taxes
- −$675
- − Insurance
- −$750
- − Repairs & maintenance
- −$1,665
- − Management
- −$1,665
- − Depreciation
- −$4,361
- Taxable income
- $3,298
- Est. tax owed @ 24.0%
- −$792
- After-tax cash flow
- $4,790/yr
For passive investors: Depreciation is non-cash, so a rental often shows a tax loss while cash-flowing — sheltering income. Rental losses are passive: they offset passive income freely, and up to $25,000/yr can offset ordinary (W-2) income if you actively participate and your MAGI is under $100k (phasing out to $0 by $150k); unused losses carry forward. On sale, claimed depreciation is recaptured at up to 25%, and gains may owe capital-gains tax (a 1031 exchange can defer both). Figures are a year-1 estimate at your 24.0% rate — not tax advice; consult a CPA.
Schools (NCES district)
- District
- Pasco
- NCES district ID
- 1201530
- Math proficiency
- 50% ▼ -10.00%
- Reading proficiency
- 52% ▼ -5.00%
- Median HH income
- $45,039
- Composite
- 43.14/100
- National rank
- #3074
- State rank
- #32 of 73 in FL
Livability — Bayonet Point
- Score
- 69/100
- State rank
- #485
- US rank
- #8934
Category grades
Schools grade is shown separately in the Schools card above.
Census & demographics
- County
- Pasco County · 524,098 people
- Metro
- Tampa-St. Petersburg-Clearwater, FL
- Population (ZIP)
- 24,355
- Household income
- $73,947
- Rent vs Own
- Severe rent burden
- 179.0
Population outlook (Pasco County) Hauer SSP2
- Today (2025)
- 570,045 people
- By 2030
- 605,844 · +6.3%
- By 2040
- 674,806 · +18.4%
- By 2050
- 736,022 · +29.1%
- By 2075
- 862,900 · +51.4%
- By 2100
- 906,364 · +59.0%
Race, ethnicity, and origin ACS 2023
- Neighborhood character
- Predominantly White (81%)
- Race & ethnicity
- White 81% Hispanic / Latino 10% Two or more races 7% Black 3% Asian 2%
- Hispanic origin (detail)
- Puerto Rican 6%
- Common ancestry
- Romanian 4% Slovak 2% Italian 2%
- Foreign-born
- 7% · Canada, China, Jamaica
- Languages at home
- 88% English-only · Spanish 5% Russian/Polish/Slavic 2% Other Indo-European 1%
Political lean MEDSL · Pasco
- 2024 margin
- Strong R (+25.2) · D 36.9% · R 62.1% · Other 1.0%
- 2008→2024 swing
- -21.6pp toward R · 2008: -3.6pp · 2024: -25.2pp
- All cycles
- 2024: R+25.2 2020: R+20.1 2016: R+21.6 2012: R+6.7 2008: R+3.6
Not yet ingested
- Civics
- —
Market trends
- HPI YoY
- ▼ -42.63%
- Current HPI
- 294.4358
- Rent YoY
- ▼ -1.85%
- Metro
- Tampa-St. Petersburg-Clearwater, FL
- State GDP YoY
- ▲ 3.28%
- F500 in state
- 36
Industry mix (Fortune 500 HQ in FL)
| Industry | F500 HQs | Revenue |
|---|---|---|
| Industrial Technology | 2 | $29B |
|
||
| Insurance | 2 | $17B |
|
||
| Retail | 1 | $60B |
|
||
| Technology Distribution | 1 | $58B |
|
||
| Homebuilding | 1 | $35B |
|
||
| Technology Manufacturing | 1 | $35B |
|
||
Price history
+399.7% since first listed10 events — show timeline
- 2026-05-14 Pending — Stellar MLS as Distributed by MLS Grid
- 2026-05-05 Relisted — Stellar MLS as Distributed by MLS Grid
- 2026-04-28 Pending — Stellar MLS as Distributed by MLS Grid
- 2026-04-19 Listed $149,900 Stellar MLS as Distributed by MLS Grid
- 2025-12-15 Sold (Public Records) $110,000 Public Records
- 2025-10-24 Pending — Stellar MLS as Distributed by MLS Grid
- 2025-10-24 Listing Removed — Stellar MLS as Distributed by MLS Grid
- 2025-10-13 Listed $164,900 Stellar MLS as Distributed by MLS Grid
- 1998-10-28 Sold (Public Records) $39,500 Public Records
- 1996-02-09 Sold (Public Records) $30,000 Public Records
Property tax history
+2.0%/yrLatest (2025): $675 · +2.2% YoY. Source: county tax records.
Cash-flow waterfall
monthlySold comps — $/sqft
last 12 mo · ≤1 miLoading sold comps…