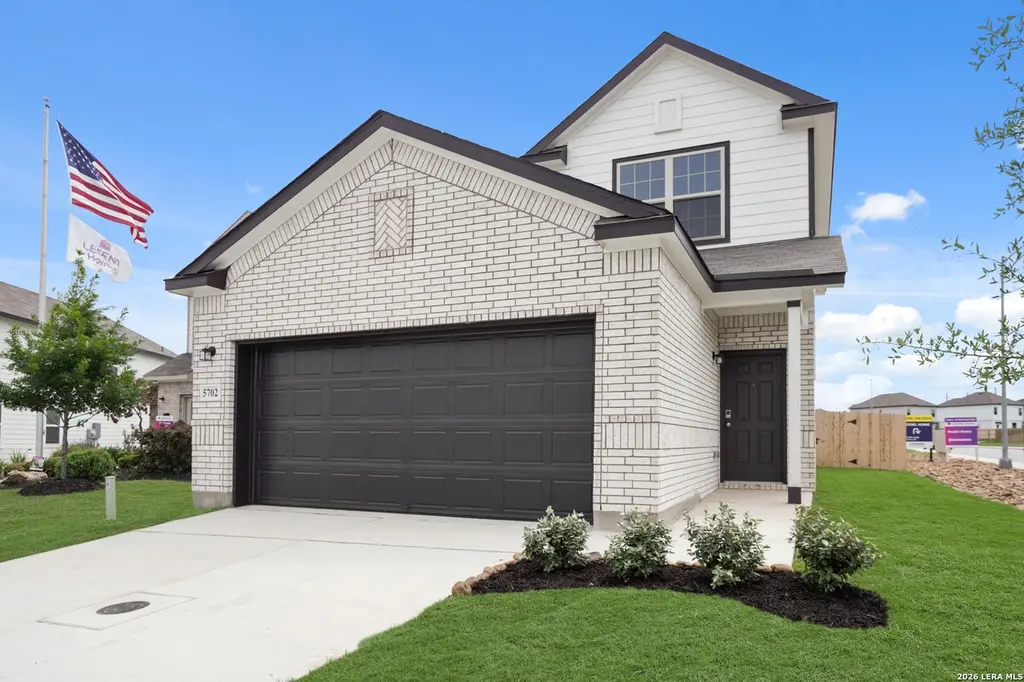
5702 Quartz Ter · San Antonio, TX
Flood risk 1/10 · Minimal
- FEMA flood zone
- X (unshaded)
- Chance of flooding over 30 yrs
- 0.0%
- Est. flood insurance / yr
- $507 – $1,088
Fire risk 5/10 · Moderate
- Est. fire insurance / yr
- $1,222 – $2,270
Heat risk 8/10 · Major
- Hot days now (above 110°F)
- 7 days/yr
- Hot days in 30 yrs
- 22 days/yr
Wind risk 8/10 · Major
- Chance of severe wind over 30 yrs
- 80.0%
Air-quality risk 2/10 · Minimal
- Unhealthy air days now
- 0 days/yr
- Unhealthy air days in 30 yrs
- 2 days/yr
Risk factors via First Street. Map © Google.
Why this score? — see what drove the D- grade
The composite is a weighted blend of 9 inputs, each scored 0–100. Each bar is that input's sub-score; the figure is the points it added to the 100-point composite (weight × sub-score).
- Cash flow +12.4/30.0
- ARV discount +9.1/15.0
- Livability +4.0/5.0
- DSCR +3.7/10.0
- Rent growth +3.6/5.0
- Condition / age +2.5/5.0
- 1% rule +2.4/10.0
- Schools +1.9/10.0
- Appreciation +0.0/10.0
$259,990
🖨 Deal sheet (PDF) 📄 Offer letter ✓ Due diligence
Listing remarks MLS
The Darrel plan is a 2-story home with 4 bedrooms, 2.5 baths, and a 2-car garage. It features the primary suite downstairs and 3 bedrooms with a flex space upstairs ideal for a home office, arts & craft area, and more.
Key facts
- Gourmet kitchen
- 42 inch cabinets
- Granite countertops
Tags
Neighborhood map
What this means for you Summary
Snapshot
- This is a 4-bed/2.5-bath single-family listed at $260k.
Deal economics
- At list price, monthly cash flow is $-42 ($-500/yr) — negative.
- To cash-flow at today's rent, offer at most $253k (2.8% below list).
- To meet the 1% rule (rent ≥ 1% of price), the offer needs to be $192k (26.0% below list).
- Recommended offer: $192k (26.0% below list) — sets the bar for 1% rule.
- Cap rate 6.1% vs local median 3.8% in San Antonio — top-decile yield for the area; either an underpriced asset or a hidden risk that comps aren't pricing in. Stress-test before assuming the spread holds.
Location & tenants
- Location reads 80/100 on livability (#31 in TX, #1,616 nationally) — a professional / high-income tenant draw. Strengths: amenities A+, commute A+, cost of living A+; Watch: crime F.
- East Central ISD (rural): math 16% / reading 25% proficiency, ranked #758 of 826 in TX (top 92%) — low school quality limits family demand, transient renter base, plan for 1-2y turnover; 61% free/reduced lunch — lower-income household profile, screen leases tightly.
- Zoned schools: Sinclair El (math 13% / reading 20%, grade F, #3,946 of 4,322 statewide, top 92%, 721 students, 71% FRL); East Central Heritage Middle (math 11% / reading 26%, grade F, #1,478 of 1,662 statewide, top 90%, 1,120 students, 44% FRL); East Central H S (math 21% / reading 28%, grade F, #1,264 of 1,632 statewide, top 82%, 3,252 students, 52% FRL).
- Market conditions: Rents rising fast (+4.3%/yr); 444 active listings in the ZIP; 40 comparable units currently listed for rent nearby; rentals at typical pace (median 26d on market — plan ~3-4 weeks tenant-placement turnaround); 8,308 units permitted in Bexar County in 2024 (2,506 in 5+ unit buildings).
- This rent runs 35% of the median local income ($66k/yr) — at the standard rent-burdened threshold; future hikes will face affordability resistance.
Forward outlook
- Local home prices are declining (-3.0%/yr); year-one equity from $2k of loan paydown is wiped out by about $8k of value loss. Plan a longer hold.
- Bexar County population projected at +50% by 2050 — long-run rental-demand tailwind backs the buy-and-hold thesis.
Negotiation context
- It's been on market 103 days — a 9% lower offer ($237k) is reasonable based on typical stale-listing flexibility.
- 2 sale attempts; this cycle's ask has dropped $16k (6%) from the opening price — seller is motivated, your offer sets the floor, not the list.
Risks & watch-outs
- Climate carrying-cost: severe wind risk, 80% chance of damaging wind over 30y; moderate wildfire risk; extreme-heat days projected 7→22/yr by 2055 (HVAC capex compounding) — expect insurance premiums to compound above CPI over the hold.
Questions for the listing agent
- What do current leases actually rent for vs. the listed asking? Can we see a recent rent roll and the last 12 months of T-12 income?
- It's been on market 103 days. Have you received any prior offers? Is the seller open to a 26% concession, seller financing, or rate buy-down credit?
- What does the HOA fee cover, when was the last increase, and are there any pending special assessments or reserve-fund shortfalls?
- Why hasn't it sold? Are there any deal-killer items the seller is aware of (foundation, flood, title, zoning, code violations)?
- Is there a deadline driving the sale (1031 exchange, divorce, estate, relocation)? That informs how much negotiation room exists.
- Crime grade is F in this area — have there been break-ins, vandalism, or insurance claims at this property in the last 3 years? What carrier currently insures it and at what premium?
- The area grade is low — what's the realistic commute time and amenity access for the typical tenant pool here? Any planned neighborhood developments (good or bad) we should know about?
- What's the average days-on-market for RENTAL listings here right now (not sales)? A rising rental-DOM trend means longer vacancies and softer asking-rent achievability than the comps imply.
- What's the recent tenant-quality profile in this submarket — average credit score on applications, eviction rate, late-payment / NSF rate, and stable-employment percentage? A property-management company in the area should have these aggregated.
- How much new for-sale + rental construction is in the pipeline within 1–3 miles? Heavy new supply typically softens prices + rents 12–24 months out; constrained supply supports both.
Investment metrics
- 1% rule
- 0.74% ✗
- Cap rate
- 6.10%
- Cash-on-cash
- -0.69%
- DSCR
- 0.97
- GRM
- 11.3
CMA / ARV
- ARV (median comp)
- $269,299
- List price
- $259,990
- Delta
- -3.46%
- Verdict
- FAIR
- Comps
- 20 within 1.0 mi
Show comp detail 12 sales within ~0.75 mi
| Address | Dist | Beds/Ba | Sqft | Sold | Price | $/sf | Match |
|---|---|---|---|---|---|---|---|
| 4814 Turquoise Park | 0.48mi | 4/2.5 | 1,617 (-2%) | 3mo | $261,500 | $162 | 72 |
| 4738 Turquoise Park | 0.55mi | 4/2.5 | 1,617 (-2%) | 2mo | $261,000 | $161 | 70 |
| 5938 Shale Cv | 0.57mi | 4/2.5 | 1,617 (-2%) | 2mo | $268,755 | $166 | 69 |
| 5918 Shale Cv | 0.57mi | 4/2.5 | 1,617 (-2%) | 2mo | $243,000 | $150 | 69 |
| 4726 Beryl Loop | 0.54mi | 4/2.5 | 1,543 (-6%) | 3mo | $220,135 | $143 | 62 |
| 5930 Cinnabar Cor | 0.56mi | 4/2.5 | 1,543 (-6%) | 2mo | $244,499 | $158 | 62 |
| 4906 Topaz Bnd | 0.39mi | 3/2.0 (-1) | 1,536 (-7%) | 3mo | $259,990 | $169 | 62 |
| 8523 Green Bliss | 0.55mi | 4/2.5 | 1,535 (-7%) | 3mo | $179,999 | $117 | 61 |
| 4610 Media Mdws | 0.65mi | 3/2.5 (-1) | 1,680 (+2%) | 2mo | $245,000 | $146 | 59 |
| 4822 Turquoise Park | 0.48mi | 5/2.5 (+1) | 1,819 (+11%) | 2mo | $271,500 | $149 | 53 |
| 5911 Shale Cv | 0.57mi | 5/2.5 (+1) | 1,819 (+11%) | 3mo | $251,500 | $138 | 48 |
| 4722 Beryl Loop | 0.54mi | 3/2.5 (-1) | 1,419 (-14%) | 2mo | $245,095 | $173 | 45 |
Match score weights: distance 35% · size 25% · config 20% · recency 20%. Top-matched comps best support the ARV.
Projected returns pro-forma
-3.0% appreciation · 4.35% rent growth · sell at horizon
- IRR
- -16.2%
- Equity multiple
- 0.42×
- Total profit
- $-42,248
- Equity at exit
- $38,765
- IRR
- -6.0%
- Equity multiple
- 0.59×
- Total profit
- $-29,496
- Equity at exit
- $22,479
Cash invested: $72,797 (down + closing). Projections, not guarantees.
Landlord ↔ Tenant lean methodology
- Overall (STATE)
- 87 Strongly Landlord-Friendly
- State Texas
- 87 Strongly Landlord-Friendly · R+5
- County
- — inherits STATE
- City
- — inherits STATE
ZIP-level market 78222
- Home prices YoY
- -4.8%
- Rents YoY
- 4.3%
- Active inventory
- 444
- Price-to-rent
- 11.3×
Monthly cashflow live
- Estimated rent
- $1,925 high interval (Pro) →
- Mortgage (P&I)
- −$1,363
- Tax from tax record
- −$59 /mo · $703/yr
- Insurance
- −$108
- HOA
- −$32
- Vacancy / Maint / Mgmt
- −$404
- Net cashflow
- $-42
Break-even live
Sensitivity live
| Price | -10% $106 | -5% $32 | +0% $-42 | +5% $-115 | +10% $-189 |
|---|---|---|---|---|---|
| Rent | -10% $-194 | -5% $-118 | +0% $-42 | +5% $34 | +10% $110 |
| Rate | -1.0pp $89 | -0.5pp $24 | base $-42 | +0.5pp $-109 | +1.0pp $-178 |
UW: 25.0% down · 7.5% · 30yr · 1.5% tax · 5.0% vac · 8.0% maint · 8.0% mgmt
Financing live
Cash to close
- Down payment
- $64,998
- Closing costs
- $7,800
- Reserves months
- —
- Total cash needed
- —
Loan-product check · same deal, 3 products live
Conventional
25% down · 7.5% · 30yr
- Down + closing
- —
- Monthly P&I
- —
- Monthly cashflow
- —
- DSCR
- —
- Eligible?
- —
Personal DTI + credit; lowest rate.
DSCR
20% down · 8.5% · 30yr
- Down + closing
- —
- Monthly P&I
- —
- Monthly cashflow
- —
- DSCR
- —
- Eligible?
- —
No personal income docs; deal must DSCR.
Hard money
10% down · 12.0% · 12mo
- Down + closing
- —
- Monthly P&I
- —
- Monthly cashflow
- —
- DSCR
- —
- Eligible?
- —
Short-term bridge; refi at stabilization.
Rent comps 40 comps
| Address | Beds | Baths | Sqft | Rent | $/sqft | DOM | Units | Dist |
|---|---|---|---|---|---|---|---|---|
| 5418 Tourmaline Loop San Antonio, TX | 3.0 | 2.0 | 1388 | $1,575 | $1.13 | 6d | 1 | 0.05mi |
| 5330 Tourmaline Loop San Antonio, TX | 4.0 | 2.5 | 2100 | $1,800 | $0.86 | 14d | 1 | 0.09mi |
| 5823 Hematite Rim San Antonio, TX | 4.0 | 2.0 | 1524 | $1,695 | $1.11 | 25d | 1 | 0.11mi |
| 5526 Fossil Way San Antonio, TX | 4.0 | 2.5 | 2097 | $1,895 | $0.90 | 45d | 1 | 0.11mi |
| 5719 Hematite Rim San Antonio, TX | 4.0 | 2.5 | 2200 | $3,500 | $1.59 | 23d | 1 | 0.16mi |
| 5231 Blue Rnch San Antonio, TX | 3.0 | 2.5 | 1419 | $1,690 | $1.19 | 45d | 1 | 0.17mi |
| 5227 Blue Rnch San Antonio, TX | 3.0 | 2.5 | 1239 | $1,590 | $1.28 | 25d | 1 | 0.18mi |
| 5231 Jade Xing San Antonio, TX | 3.0 | 2.5 | 1239 | $1,590 | $1.28 | 12d | 1 | 0.22mi |
| 5203 Blue Rnch San Antonio, TX | 3.0 | 2.5 | 1272 | $1,615 | $1.27 | 25d | 1 | 0.22mi |
| 5215 Jade Xing San Antonio, TX | 3.0 | 2.5 | 1272 | $1,595 | $1.25 | 6d | 1 | 0.24mi |
| 5130 Blue Rnch San Antonio, TX | 3.0 | 2.5 | 1529 | $1,740 | $1.14 | 45d | 1 | 0.24mi |
| 5230 Jade Xing San Antonio, TX | 3.0 | 2.5 | 1529 | $1,650 | $1.08 | 25d | 1 | 0.24mi |
| 5226 Jade Xing San Antonio, TX | 4.0 | 2.5 | 1798 | $1,820 | $1.01 | 12d | 1 | 0.24mi |
| 5126 Blue Rnch San Antonio, TX | 4.0 | 2.5 | 1798 | $1,820 | $1.01 | 45d | 1 | 0.25mi |
| 5207 Jade Xing San Antonio, TX | 3.0 | 2.5 | 1239 | $1,590 | $1.28 | 45d | 1 | 0.25mi |
| 5119 Blue Rnch San Antonio, TX | 3.0 | 2.5 | 1272 | $1,615 | $1.27 | 25d | 1 | 0.25mi |
| 5214 Jade Xing San Antonio, TX | 3.0 | 2.5 | 1419 | $1,690 | $1.19 | 25d | 1 | 0.26mi |
| 5107 Blue Rnch San Antonio, TX | 3.0 | 2.5 | 1529 | $1,740 | $1.14 | 25d | 1 | 0.26mi |
| 5106 Blue Rnch San Antonio, TX | 4.0 | 2.5 | 1798 | $1,820 | $1.01 | 45d | 1 | 0.28mi |
| 5115 Jade Xing San Antonio, TX | 3.0 | 2.5 | 1239 | $1,550 | $1.25 | 19d | 1 | 0.28mi |
| 5102 Blue Rnch San Antonio, TX | 3.0 | 2.5 | 1272 | $1,615 | $1.27 | 25d | 1 | 0.28mi |
| 5126 Jade Xing San Antonio, TX | 4.0 | 2.5 | 1798 | $1,820 | $1.01 | 25d | 1 | 0.28mi |
| 5107 Jade Xing San Antonio, TX | 3.0 | 2.5 | 1419 | $1,575 | $1.11 | 25d | 1 | 0.29mi |
| 5114 Jade Xing San Antonio, TX | 3.0 | 2.5 | 1419 | $1,690 | $1.19 | 25d | 1 | 0.30mi |
| 5019 Jade Xing San Antonio, TX | 3.0 | 2.5 | 1272 | $1,500 | $1.18 | 25d | 1 | 0.30mi |
| 5011 Blue Rnch San Antonio, TX | 3.0 | 2.5 | 1529 | $1,740 | $1.14 | 45d | 1 | 0.30mi |
| 5015 Jade Xing San Antonio, TX | 4.0 | 2.5 | 1798 | $1,820 | $1.01 | 12d | 1 | 0.30mi |
| 5011 Jade Xing San Antonio, TX | 3.0 | 2.5 | 1239 | $1,590 | $1.28 | 45d | 1 | 0.31mi |
| 5118 Sandstone Way San Antonio, TX | 3.0 | 2.5 | 1311 | $1,600 | $1.22 | 0d | 1 | 0.32mi |
| 5011 Sandstone Way San Antonio, TX | 4.0 | 2.5 | 2194 | $2,050 | $0.93 | 6d | 1 | 0.35mi |
| 4910 Sandstone Way San Antonio, TX | 3.0 | 2.5 | 1849 | $1,750 | $0.95 | 23d | 1 | 0.42mi |
| 4910 Sandstone Way San Antonio, TX | 3.0 | 2.5 | 1850 | $1,750 | $0.95 | 5d | 1 | 0.42mi |
| 5962 Celestite Bnd San Antonio, TX | 3.0 | 2.0 | 1190 | $1,723 | $1.45 | 0d | 1 | 0.49mi |
| 4734 Shale Cv San Antonio, TX | 3.0 | 2.0 | 1247 | $1,725 | $1.38 | 25d | 1 | 0.55mi |
| 8523 Green Bliss San Antonio, TX | 4.0 | 2.5 | 1535 | $1,549 | $1.01 | 16d | 1 | 0.56mi |
| 5950 Lake Superior St San Antonio, TX | 5.0 | 2.5 | 1781 | $2,275 | $1.28 | 6d | 1 | 0.57mi |
| 5618 Salado Fls San Antonio, TX | 4.0 | 2.5 | 1901 | $1,675 | $0.88 | 45d | 1 | 0.67mi |
| 3535 Honey Mdw San Antonio, TX | 3.0 | 2.5 | 1438 | $1,400 | $0.97 | 18d | 1 | 0.70mi |
| 6023 Lake Victoria St San Antonio, TX | 3.0 | 2.0 | 1368 | $1,575 | $1.15 | 14d | 1 | 0.79mi |
| 5365 Southcross Ranch Rd San Antonio, TX | 3.0 | 1.0–2.0 | 1568 | $85,000 | $54.21 | 3d | 1 | 0.83mi |
HOA detail
- Monthly dues
- $32 · $384/yr
Listing history 19 events
-
2026-06-21statusdays on market $259,990 Active 103 DOM
-
2026-06-18days on market $259,990 Price Change 100 DOM
-
2026-06-17days on market $259,990 Price Change 99 DOM
-
2026-06-16days on market $259,990 Price Change 98 DOM
-
2026-06-15days on market $259,990 Price Change 97 DOM
-
2026-06-13pricestatusdays on market $259,990 Price Change 95 DOM
-
2026-06-09days on market $269,990 Active 91 DOM
-
2026-06-08days on market $269,990 Active 90 DOM
-
2026-06-07days on market $269,990 Active 89 DOM
-
2026-06-04days on market $269,990 Active 86 DOM
-
2026-06-03days on market $269,990 Active 85 DOM
-
2026-06-02days on market $269,990 Active 84 DOM
-
2026-06-01days on market $269,990 Active 83 DOM
-
2026-05-31days on market $269,990 Active 82 DOM
-
2026-05-07price $269,990 224-char remark
Show marketing remark (224 chars)
The Darrel plan is a 2-story home with 4 bedrooms, 2.5 baths, and a 2-car garage. It features the primary suite downstairs and 3 bedrooms with a flex space upstairs ideal for a home office, arts & craft area, and more.
-
2026-05-06price $269,990 694-char remark
Show marketing remark (694 chars)
* Community closeout! FINAL OPPORTUNITIES * Love where you live in Blue Ridge Ranch in San Antonio, TX! The Darrel floor plan is a spacious two-story home with 4 bedrooms, 2.5 baths, game room, and 2-car garage. This home has it all, including vinyl plank flooring throughout the common areas! The gourmet kitchen is sure to please with 42-inch cabinets, granite countertops, and stainless-steel appliances! Retreat to the first-floor Owner's Suite featuring double sinks, a sizable shower, and spacious walk-in closet. Don't miss your opportunity to call Blue Ridge Ranch home, schedule a visit today! *Photos are a representation of the floor plan. Options and interior selections will vary.*
-
2026-03-10$275,593 New 694-char remark
Show marketing remark (694 chars)
* Community closeout! FINAL OPPORTUNITIES * Love where you live in Blue Ridge Ranch in San Antonio, TX! The Darrel floor plan is a spacious two-story home with 4 bedrooms, 2.5 baths, game room, and 2-car garage. This home has it all, including vinyl plank flooring throughout the common areas! The gourmet kitchen is sure to please with 42-inch cabinets, granite countertops, and stainless-steel appliances! Retreat to the first-floor Owner's Suite featuring double sinks, a sizable shower, and spacious walk-in closet. Don't miss your opportunity to call Blue Ridge Ranch home, schedule a visit today! *Photos are a representation of the floor plan. Options and interior selections will vary.*
-
2026-02-13price $275,593 224-char remark
Show marketing remark (224 chars)
The Darrel plan is a 2-story home with 4 bedrooms, 2.5 baths, and a 2-car garage. It features the primary suite downstairs and 3 bedrooms with a flex space upstairs ideal for a home office, arts & craft area, and more.
-
2025-12-16$272,593 Active 224-char remark
Show marketing remark (224 chars)
The Darrel plan is a 2-story home with 4 bedrooms, 2.5 baths, and a 2-car garage. It features the primary suite downstairs and 3 bedrooms with a flex space upstairs ideal for a home office, arts & craft area, and more.
ⓘ Source: listings_history table (triggers on properties + properties_extension) + one-shot
backfill from property_details.listing_events for pre-trigger history.
Tax reassessment forecast TX · Resets to sale price
- Current annual tax
- $703 · $59/mo
- Projected year-2 tax
- $4,758 · $396/mo
- Expected delta
- +$4,055/yr (+$338/mo · 577.0%)
ⓘ Screening estimate from a state-policy table — verify with the county assessor before closing.
Climate risk First Street
- Flood 1/10 Low FEMA zone X (unshaded) · 0% chance over 30 yrs
- Wildfire 5/10 Major
- Heat 8/10 Severe 7 d/yr ≥110°F today · 22 d/yr by 30 yrs out
- Wind 8/10 Severe 80% chance of damaging wind over 30 yrs
- Air quality 2/10 Low 0 unhealthy d/yr today · 2 by 30 yrs out
Nearby sold comps map
Loading sold comps map…
Walkable amenities ~0.75 mi
Loading nearby amenities…
Taxation est. · year 1
- Rental income
- $23,099
- − Mortgage interest
- −$14,563
- − Property taxes
- −$703
- − Insurance
- −$1,300
- − Repairs & maintenance
- −$1,848
- − Management
- −$1,848
- − HOA
- −$384
- − Depreciation
- −$7,563
- Taxable loss
- −$5,111
- Est. tax savings @ 24.0%
- +$1,227
- After-tax cash flow
- $727/yr
For passive investors: Depreciation is non-cash, so a rental often shows a tax loss while cash-flowing — sheltering income. Rental losses are passive: they offset passive income freely, and up to $25,000/yr can offset ordinary (W-2) income if you actively participate and your MAGI is under $100k (phasing out to $0 by $150k); unused losses carry forward. On sale, claimed depreciation is recaptured at up to 25%, and gains may owe capital-gains tax (a 1031 exchange can defer both). Figures are a year-1 estimate at your 24.0% rate — not tax advice; consult a CPA.
Schools (NCES district)
- District
- East Central ISD
- NCES district ID
- 4817850
- Math proficiency
- 16% ▼ -12.00%
- Reading proficiency
- 25% ▼ -6.00%
- Median HH income
- $53,941
- Composite
- 18.67/100
- National rank
- #8887
- State rank
- #758 of 826 in TX
Livability — San Antonio
- Score
- 80/100
- State rank
- #31
- US rank
- #1616
Category grades
Schools grade is shown separately in the Schools card above.
Census & demographics
- Census place
- San Antonio, TX
- County
- Bexar County · 1,990,555 people
- City population
- 1,806,925
- Metro
- San Antonio-New Braunfels, TX
- Population (ZIP)
- 26,476
- Household income
- $66,362
- Rent vs Own
- Severe rent burden
- 686.0
Population outlook (Bexar County) Hauer SSP2
- Today (2025)
- 2,336,851 people
- By 2030
- 2,560,728 · +9.6%
- By 2040
- 3,020,569 · +29.3%
- By 2050
- 3,493,522 · +49.5%
- By 2075
- 4,668,459 · +99.8%
- By 2100
- 5,533,242 · +136.8%
Race, ethnicity, and origin ACS 2023
- Neighborhood character
- Majority Hispanic (64%)
- Race & ethnicity
- Hispanic / Latino 64% Two or more races 26% White 19% Black 14% Asian 1%
- Hispanic origin (detail)
- Mexican 55%
- Common ancestry
- Romanian 1% Italian 1% Slovak 1%
- Foreign-born
- 14% · Canada
- Languages at home
- 61% English-only · Spanish 37% Arabic 1%
Political lean MEDSL · Bexar
- 2024 margin
- Lean D (+9.8) · D 54.3% · R 44.6% · Other 1.1%
- 2008→2024 swing
- +4.2pp toward D · 2008: 5.6pp · 2024: 9.8pp
- All cycles
- 2024: D+9.8 2020: D+18.2 2016: D+13.5 2012: D+4.6 2008: D+5.6
Not yet ingested
- Civics
- —
Market trends
- HPI YoY
- ▼ -14.18%
- Current HPI
- 278.8429
- Rent YoY
- ▲ 4.35%
- Metro
- San Antonio-New Braunfels, TX
- State GDP YoY
- ▲ 3.95%
- F500 in state
- 110
Industry mix (Fortune 500 HQ in TX)
| Industry | F500 HQs | Revenue |
|---|---|---|
| Energy | 16 | $1,198B |
|
||
| Technology | 5 | $198B |
|
||
| Engineering / Construction | 4 | $72B |
|
||
| Energy Services | 3 | $60B |
|
||
| Utilities | 3 | $41B |
|
||
| Healthcare | 2 | $330B |
|
||
Price history
-1.0% since first listed5 events — show timeline
- 2026-05-07 Price Changed $269,990 Zillow
- 2026-05-06 Price Changed $269,990 LERA
- 2026-03-10 Listed $275,593 LERA
- 2026-02-13 Price Changed $275,593 Zillow
- 2025-12-16 Listed $272,593 Zillow
Property tax history
+11.5%/yrLatest (2025): $703 · +8.1% YoY. Source: county tax records.
Cash-flow waterfall
monthlySold comps — $/sqft
last 12 mo · ≤1 miLoading sold comps…