 Fourplex
11511 N 24th Ln · McAllen, TX
Flood risk 5/10 · Moderate
- FEMA flood zone
- X
- Chance of flooding over 30 yrs
- 0.51%
- Est. flood insurance / yr
- $507 – $1,088
Fire risk 5/10 · Moderate
- Est. fire insurance / yr
- $1,222 – $2,270
Heat risk 9/10 · Severe
- Hot days now (above 111°F)
- 7 days/yr
- Hot days in 30 yrs
- 24 days/yr
Wind risk 8/10 · Major
- Chance of severe wind over 30 yrs
- 99.0%
Air-quality risk 2/10 · Minimal
- Unhealthy air days now
- 0 days/yr
- Unhealthy air days in 30 yrs
- 1 days/yr
Risk factors via First Street. Map © Google.
Why this score? — see what drove the C grade
The composite is a weighted blend of 9 inputs, each scored 0–100. Each bar is that input's sub-score; the figure is the points it added to the 100-point composite (weight × sub-score).
- Cash flow +20.7/30.0
- ARV discount +9.9/15.0
- DSCR +6.6/10.0
- 1% rule +5.5/10.0
- Condition / age +5.0/5.0
- Livability +3.8/5.0
- Rent growth +3.1/5.0
- Schools +2.2/10.0
- Appreciation +0.0/10.0
$495,000
🖨 Deal sheet (PDF) 📄 Offer letter ✓ Due diligence
Multi-family units
County records classify this as Multi-Family (2-4 Unit). Listing-text estimate: 4 units. confirmed
Listing remarks MLS
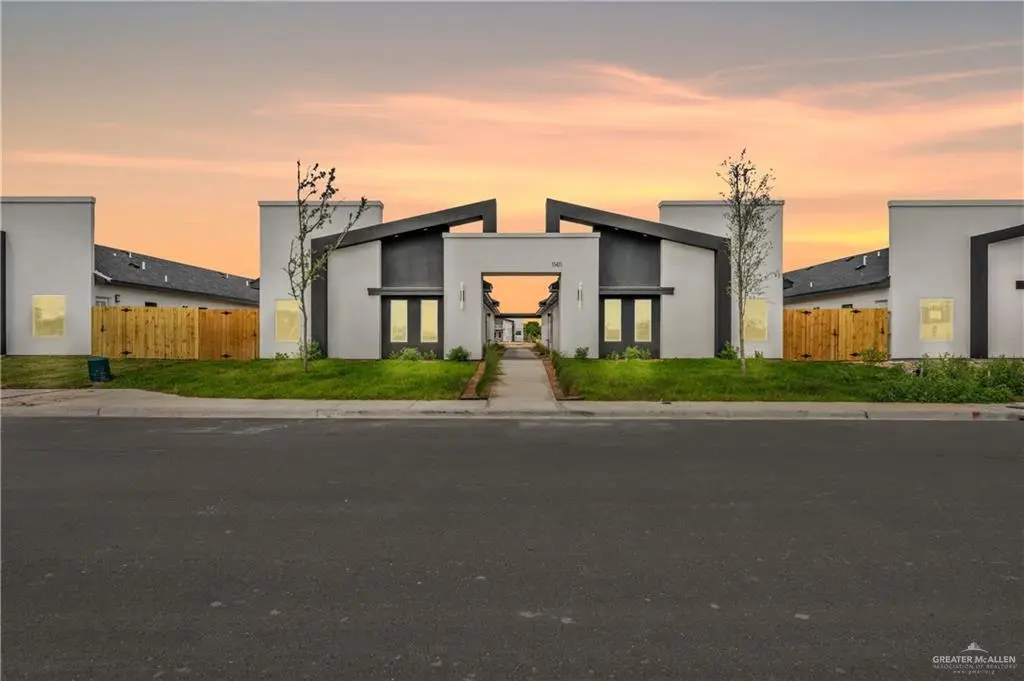
This brand-new, modern fourplex offers an exceptional investment opportunity in a high-demand rental corridor of Edinburg, TX. The property features four total units, each designed with open-concept living spaces, quartz countertops, walk-in closets, and a full appliance package including washer, dryer, refrigerator, stove, and microwave. The property will be move-in ready upon completion and is conveniently located just minutes from UTRGV, the Edinburg Courthouse, major employers, retail, and dining. Strong rental potential supported by steady tenant demand in this growing area. Note: Property is currently under construction. Don’t miss this opportunity to add a high-yield, new-construction asset to your investment portfolio.
Key facts
- Move-in ready
- Quartz countertops
- Walk-in closets
Tags
Neighborhood map
What this means for you Summary
Snapshot
- This is a 4 × 2-bed/2-bath units multifamily listed at $495k. Condition is rated excellent.
Deal economics
- At list price, monthly cash flow is $673 ($8k/yr) — positive. Per door: $168/mo.
- The deal already cash-flows at list — no discount required.
- Meets the 1% rule at list price ($5k rent vs $495k).
- Recommended offer: $436k (12.0% below list) — sets the bar for market timing.
- Cap rate 7.9% vs local median 3.7% in McAllen — top-decile yield for the area; either an underpriced asset or a hidden risk that comps aren't pricing in. Stress-test before assuming the spread holds.
Location & tenants
- Location reads 76/100 on livability (#119 in TX, #3,771 nationally) — a middle-class / working-renter tenant base. Strengths: cost of living A+, housing A+, health & safety A+; Watch: employment D, amenities F, commute F.
- Edinburg CISD (urban): math 20% / reading 34% proficiency, ranked #699 of 826 in TX (top 85%) — low school quality limits family demand, transient renter base, plan for 1-2y turnover; 62% free/reduced lunch — lower-income household profile, screen leases tightly.
- Market conditions: Rents rising (+2.6%/yr); 888 active listings in the ZIP; 3 comparable units currently listed for rent nearby; rentals lingering (median 45d on market — plan ~5-8 weeks vacancy on turnover, expect pricing pressure); 67% of comp listings sitting > 30 days — soft ceiling on asking rent; solid renter incomes; 7,378 units permitted in Hidalgo County in 2024 (641 in 5+ unit buildings).
- At $5,182/mo this rent would consume 76% of the median local household income ($82k/yr) (locally 1468% of renters already pay >50% of income on rent) — very limited rent-growth headroom before tenants either downsize or default.
Forward outlook
- Local home prices are declining (-3.0%/yr); year-one equity from $3k of loan paydown is wiped out by about $15k of value loss. Plan a longer hold.
- Hidalgo County population projected at +28% by 2050 — long-run rental-demand tailwind backs the buy-and-hold thesis.
Negotiation context
- It's been on market 176 days — a 12% lower offer ($436k) is reasonable based on typical stale-listing flexibility.
Risks & watch-outs
- Climate carrying-cost: moderate flood risk; severe wind risk, 99% chance of damaging wind over 30y; moderate wildfire risk; extreme-heat days projected 7→24/yr by 2055 (HVAC capex compounding) — expect insurance premiums to compound above CPI over the hold.
Questions for the listing agent
- It's been on market 176 days. Have you received any prior offers? Is the seller open to a 12% concession, seller financing, or rate buy-down credit?
- Can we see the unit-by-unit rent roll, current vacancy, and any below-market leases? What's the average tenancy length?
- What capital expenditures (roof, boiler, parking lot, exteriors) have been made in the last 5 years, and what's planned in the next 2?
- Why hasn't it sold? Are there any deal-killer items the seller is aware of (foundation, flood, title, zoning, code violations)?
- Is there a deadline driving the sale (1031 exchange, divorce, estate, relocation)? That informs how much negotiation room exists.
- Schools are B-rated — typically a magnet for longer-tenancy family renters. What's the average tenant stay here, and is there a school-zone premium baked into asking?
- What's the average days-on-market for RENTAL listings here right now (not sales)? A rising rental-DOM trend means longer vacancies and softer asking-rent achievability than the comps imply.
- What's the recent tenant-quality profile in this submarket — average credit score on applications, eviction rate, late-payment / NSF rate, and stable-employment percentage? A property-management company in the area should have these aggregated.
- How much new apartment / multifamily construction is in the pipeline within 1–3 miles? Heavy new supply (>2% of stock underway) typically softens rents 12–24 months out; light construction supports rent growth.
Investment metrics
- 1% rule
- 1.05% ✓
- Cap rate
- 7.92%
- Cash-on-cash
- 5.83%
- DSCR
- 1.26
- GRM
- 8.0
CMA / ARV
- ARV (median comp)
- $522,721
- List price
- $495,000
- Delta
- -5.30%
- Verdict
- FAIR
- Comps
- 12 within 1.0 mi
Show comp detail 2 sales within ~0.75 mi
| Address | Dist | Beds/Ba | Sqft | Sold | Price | $/sf | Match |
|---|---|---|---|---|---|---|---|
| 11412 N 25th St | 0.29mi | —/— | 4,000 (+14%) | 1mo | $525,000 | $131 | 62 |
| 11500 N 25th Ln | 0.25mi | —/— | 4,000 (+14%) | 7mo | $515,900 | $129 | 58 |
Match score weights: distance 35% · size 25% · config 20% · recency 20%. Top-matched comps best support the ARV.
Projected returns pro-forma
-3.0% appreciation · 2.57% rent growth · sell at horizon
- IRR
- -7.8%
- Equity multiple
- 0.71×
- Total profit
- $-39,505
- Equity at exit
- $73,806
- IRR
- 1.3%
- Equity multiple
- 1.09×
- Total profit
- $12,025
- Equity at exit
- $42,799
Cash invested: $138,600 (down + closing). Projections, not guarantees.
Landlord ↔ Tenant lean methodology
- Overall (STATE)
- 87 Strongly Landlord-Friendly
- State Texas
- 87 Strongly Landlord-Friendly · R+5
- County
- — inherits STATE
- City
- — inherits STATE
ZIP-level market 78504
- Home prices YoY
- -29.4%
- Rents YoY
- 2.6%
- Active inventory
- 888
- Price-to-rent
- 31.8×
Monthly cashflow live
- Estimated rent
- $5,182 high interval (Pro) →
- Mortgage (P&I)
- −$2,596
- Tax est. 1.5%
- −$619 /mo · $7,425/yr
- Insurance
- −$206
- HOA
- −$0
- Vacancy / Maint / Mgmt
- −$1,088
- Net cashflow
- $673
Break-even live
Sensitivity live
| Price | -10% $1,015 | -5% $844 | +0% $673 | +5% $502 | +10% $331 |
|---|---|---|---|---|---|
| Rent | -10% $264 | -5% $468 | +0% $673 | +5% $878 | +10% $1,082 |
| Rate | -1.0pp $922 | -0.5pp $799 | base $673 | +0.5pp $545 | +1.0pp $414 |
4-unit breakdown (identical units grouped — click to expand)
| Units | Beds | Baths | Est. rent |
|---|---|---|---|
| 4× units | 2 | 2 | $5,184 |
| #1 | 2 | 2 | $1,296 |
| #2 | 2 | 2 | $1,296 |
| #3 | 2 | 2 | $1,296 |
| #4 | 2 | 2 | $1,296 |
| Total (4 units) | $5,182 | ||
UW: 25.0% down · 7.5% · 30yr · 1.5% tax · 5.0% vac · 8.0% maint · 8.0% mgmt
Financing live
Cash to close
- Down payment
- $123,750
- Closing costs
- $14,850
- Reserves months
- —
- Total cash needed
- —
Loan-product check · same deal, 3 products live
Conventional
25% down · 7.5% · 30yr
- Down + closing
- —
- Monthly P&I
- —
- Monthly cashflow
- —
- DSCR
- —
- Eligible?
- —
Personal DTI + credit; lowest rate.
DSCR
20% down · 8.5% · 30yr
- Down + closing
- —
- Monthly P&I
- —
- Monthly cashflow
- —
- DSCR
- —
- Eligible?
- —
No personal income docs; deal must DSCR.
Hard money
10% down · 12.0% · 12mo
- Down + closing
- —
- Monthly P&I
- —
- Monthly cashflow
- —
- DSCR
- —
- Eligible?
- —
Short-term bridge; refi at stabilization.
Rent comps 3 comps
| Address | Beds | Baths | Sqft | Rent | $/sqft | DOM | Units | Dist |
|---|---|---|---|---|---|---|---|---|
| 11401 N 25th St Unit 2 McAllen, TX | 3.0 | 2.0 | 4004 | $1,350 | $0.34 | 44d | 1 | 0.26mi |
| 2501 Indian Creek Ave Unit 1 McAllen, TX | 2.0 | 2.0 | 4100 | $1,175 | $0.29 | 24d | 1 | 0.54mi |
| 702 S Logan Dr Unit 3 Edinburg, TX | 2.0 | 2.5 | 4488 | $950 | $0.21 | 44d | 1 | 1.36mi |
Listing history 16 events
-
2026-06-18days on market $495,000 Active 176 DOM
-
2026-06-17days on market $495,000 Active 175 DOM
-
2026-06-16days on market $495,000 Active 174 DOM
-
2026-06-15days on market $495,000 Active 173 DOM
-
2026-06-14days on market $495,000 Active 171 DOM
-
2026-06-13days on market $495,000 Active 170 DOM
-
2026-06-10days on market $495,000 Active 168 DOM
-
2026-06-09days on market $495,000 Active 167 DOM
-
2026-06-08days on market $495,000 Active 166 DOM
-
2026-06-07days on market $495,000 Active 165 DOM
-
2026-06-03days on market $495,000 Active 161 DOM
-
2026-06-02days on market $495,000 Active 160 DOM
-
2026-06-01days on market $495,000 Active 159 DOM
-
2026-05-31days on market $495,000 Active 158 DOM
-
2026-05-31days on market $495,000 Active 157 DOM
-
2025-12-24$495,000 Active 752-char remark
Show marketing remark (752 chars)
This brand-new, modern fourplex offers an exceptional investment opportunity in a high-demand rental corridor of Edinburg, TX. The property features four total units, each designed with open-concept living spaces, quartz countertops, walk-in closets, and a full appliance package including washer, dryer, refrigerator, stove, and microwave. The property will be move-in ready upon completion and is conveniently located just minutes from UTRGV, the Edinburg Courthouse, major employers, retail, and dining. Strong rental potential supported by steady tenant demand in this growing area. Note: Property is currently under construction. Don’t miss this opportunity to add a high-yield, new-construction asset to your investment portfolio.
ⓘ Source: listings_history table (triggers on properties + properties_extension) + one-shot
backfill from property_details.listing_events for pre-trigger history.
Climate risk First Street
- Flood 5/10 Major FEMA zone X · 51% chance over 30 yrs
- Wildfire 5/10 Major
- Heat 9/10 Extreme 7 d/yr ≥111°F today · 24 d/yr by 30 yrs out
- Wind 8/10 Severe 99% chance of damaging wind over 30 yrs
- Air quality 2/10 Low 0 unhealthy d/yr today · 1 by 30 yrs out
Nearby sold comps map
Loading sold comps map…
Walkable amenities ~0.75 mi
Loading nearby amenities…
Taxation est. · year 1
- Rental income
- $62,184
- − Mortgage interest
- −$27,728
- − Property taxes
- −$7,425
- − Insurance
- −$2,475
- − Repairs & maintenance
- −$4,975
- − Management
- −$4,975
- − Depreciation
- −$14,400
- Taxable income
- $207
- Est. tax owed @ 24.0%
- −$50
- After-tax cash flow
- $8,026/yr
For passive investors: Depreciation is non-cash, so a rental often shows a tax loss while cash-flowing — sheltering income. Rental losses are passive: they offset passive income freely, and up to $25,000/yr can offset ordinary (W-2) income if you actively participate and your MAGI is under $100k (phasing out to $0 by $150k); unused losses carry forward. On sale, claimed depreciation is recaptured at up to 25%, and gains may owe capital-gains tax (a 1031 exchange can defer both). Figures are a year-1 estimate at your 24.0% rate — not tax advice; consult a CPA.
Condition & rehab AI · 12 photos
This brand-new, modern fourplex is move-in ready and offers exceptional investment potential in a high-demand rental corridor.
Value-add opportunities
- Both Landscaping and curb appeal improvements — Enhances both resale and rental appeal.
- Both Addition of smart home features — Improves both resale and rental appeal by adding modern amenities.
Renovation cost estimate screening
Value-add ROI direction
- Both Landscaping and curb appeal improvements — Enhances both resale and rental appeal. ↑
- Both Addition of smart home features — Improves both resale and rental appeal by adding modern amenities. ↑
ⓘ Cost ranges are severity-bucket heuristics (US national rule-of-thumb). Get contractor quotes + a written scope before underwriting a rehab budget.
Schools (NCES district)
- District
- Edinburg CISD
- NCES district ID
- 4818180
- Math proficiency
- 20% ▼ -34.00%
- Reading proficiency
- 34% ▼ -11.00%
- Median HH income
- $36,985
- Composite
- 22.42/100
- National rank
- #8114
- State rank
- #699 of 826 in TX
Livability — McAllen
- Score
- 76/100
- State rank
- #119
- US rank
- #3771
Category grades
Schools grade is shown separately in the Schools card above.
Census & demographics
- Census place
- McAllen, TX
- County
- Hidalgo County · 623,128 people
- City population
- 144,650
- Metro
- McAllen-Edinburg-Mission, TX
- Population (ZIP)
- 63,094
- Household income
- $81,905
- Rent vs Own
- Severe rent burden
- 1468.0
Population outlook (Hidalgo County) Hauer SSP2
- Today (2025)
- 955,232 people
- By 2030
- 1,009,774 · +5.7%
- By 2040
- 1,120,332 · +17.3%
- By 2050
- 1,225,036 · +28.2%
- By 2075
- 1,439,189 · +50.7%
- By 2100
- 1,533,429 · +60.5%
Race, ethnicity, and origin ACS 2023
- Neighborhood character
- Predominantly Hispanic (82%)
- Race & ethnicity
- Hispanic / Latino 82% Two or more races 39% White 11% Asian 5%
- Hispanic origin (detail)
- Mexican 75%
- Common ancestry
- Lithuanian 1% Italian 1%
- Foreign-born
- 24% · Canada, South Korea, Vietnam
- Languages at home
- 34% English-only · Spanish 62% Other Asian/Pacific 1% Tagalog/Filipino 1%
Political lean MEDSL · Hidalgo
- 2024 margin
- Toss-up / Even · D 48.1% · R 51.0%
- 2008→2024 swing
- -41.6pp toward R · 2008: 38.7pp · 2024: -2.9pp
- All cycles
- 2024: R+2.9 2020: D+17.1 2016: D+40.5 2012: D+41.8 2008: D+38.7
Not yet ingested
- Civics
- —
Market trends
- HPI YoY
- ▼ -80.87%
- Current HPI
- 194.1764
- Rent YoY
- ▲ 2.57%
- Metro
- McAllen-Edinburg-Mission, TX
- State GDP YoY
- ▲ 3.95%
- F500 in state
- 110
Industry mix (Fortune 500 HQ in TX)
| Industry | F500 HQs | Revenue |
|---|---|---|
| Energy | 16 | $1,198B |
|
||
| Technology | 5 | $198B |
|
||
| Engineering / Construction | 4 | $72B |
|
||
| Energy Services | 3 | $60B |
|
||
| Utilities | 3 | $41B |
|
||
| Healthcare | 2 | $330B |
|
||
Price history
1 event — show timeline
- 2025-12-24 Listed $495,000 MCALLENMLS
Cash-flow waterfall
monthlySold comps — $/sqft
last 12 mo · ≤1 miLoading sold comps…