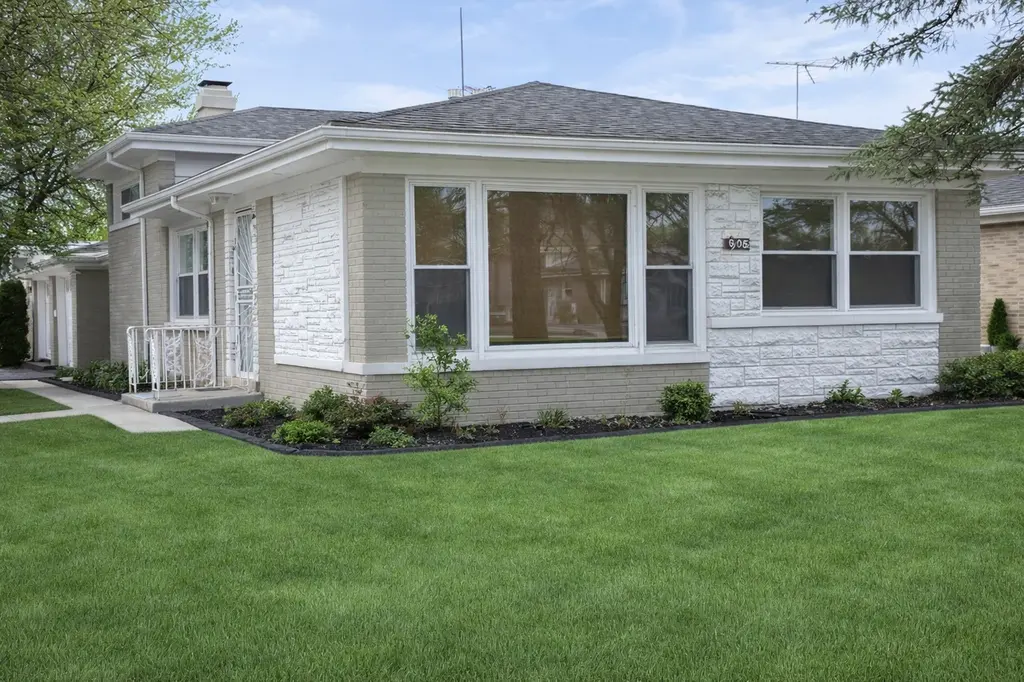
1396 Buffalo Ave · Calumet City, IL
Flood risk 5/10 · Moderate
- FEMA flood zone
- X (shaded)
- Chance of flooding over 30 yrs
- 0.5%
- Est. flood insurance / yr
- $473 – $860
Fire risk 1/10 · Minimal
- Est. fire insurance / yr
- $804 – $1,492
Heat risk 3/10 · Minor
- Hot days now (above 102°F)
- 7 days/yr
- Hot days in 30 yrs
- 15 days/yr
Wind risk 2/10 · Minimal
- Chance of severe wind over 30 yrs
- —
Air-quality risk 4/10 · Minor
- Unhealthy air days now
- 5 days/yr
- Unhealthy air days in 30 yrs
- 6 days/yr
Risk factors via First Street. Map © Google.
Why this score? — see what drove the D- grade
The composite is a weighted blend of 9 inputs, each scored 0–100. Each bar is that input's sub-score; the figure is the points it added to the 100-point composite (weight × sub-score).
- ARV discount +9.9/15.0
- Cash flow +7.2/30.0
- 1% rule +5.5/10.0
- Rent growth +4.0/5.0
- Livability +3.6/5.0
- Condition / age +2.5/5.0
- DSCR +1.4/10.0
- Schools +1.0/10.0
- Appreciation +0.0/10.0
$159,000
🖨 Deal sheet (PDF) 📄 Offer letter ✓ Due diligence
Listing remarks MLS
A Beautiful Large Split-Level Home On A Large Corner Lot In Calumet City. This Home Was Redesigned With An Open-Airy Concept In Mind. Your Main Level Consists Of A Great Room With Living, Dining And Kitchen Space. The Upgrades On This Floor Include A Sleek Modern 78" Fireplace, Gourmet Kitchen With An Oversized Island And Winecooler. Main Level Includes One Of The Four Spacious Bedrooms And Two Are Located On The Second Level With New Hardwood Flooring. .. .The Fourth Is On Its Own Separated By The Family Room With ANOTHER Large Fireplace AND Dry Sauna For Maximum Relaxation In Your Home. This Property Boasts Tons Of Decor Features And Includes An ATTACHED 2 Car Garage!
Key facts
- 5,619 sq ft lot
- 2 garage spots
- Built 1961
Property features AI
Finance
- Other: Property not currently leased; Possession at closing
- HOA & community: No master association fee required; Community features include curbs, sidewalks, street lights and paved streets
Exterior
- Parking: Attached garage with 2 garage spaces; Garage door opener; Concrete driveway; 2 total parking spaces
- Utilities: Public water; Public sewer
- Home design: Detached single-family home; Tri-level / split-level design; Fee simple ownership; Rehab completed in 2019
- Construction: Brick construction; Asphalt roof; Concrete perimeter foundation; Built approximately 61–70 years ago; Built before 1978
- Exterior features: Patio; Porch; Fenced yard; Corner lot; Mature trees
Interior
- Kitchen: Island kitchen; Range; Microwave; Dishwasher; High-end refrigerator; Wine refrigerator; Stainless steel appliances
- Bedrooms: 4 bedrooms (master and an additional bedroom on the main level; others on second level)
- Flooring: Hardwood floors throughout main living areas and bedrooms
- Bathrooms: 2 full bathrooms; Bathroom(s) in basement; Whirlpool and full body spray shower in at least one bath
- Fireplaces: Two wood-burning fireplaces (located in family room and living room) with attached doors/screens
- Heating & cooling: Natural gas heating; Central air conditioning
- Interior features: First-floor bedroom; First-floor full bathroom; Built-in features; Finished partial basement; Screens on windows; 8 total rooms
- Laundry & utility: Laundry room; Washer and dryer included; Gas dryer hookup in garage
Neighborhood map
What this means for you Summary
Snapshot
- This is a 3-bed/1.5-bath single-family listed at $159k.
Deal economics
- At list price, monthly cash flow is $-220 ($-3k/yr) — negative.
- To cash-flow at today's rent, offer at most $154k (3.4% below list).
- Meets the 1% rule at list price ($2k rent vs $159k).
- Recommended offer: $154k (3.4% below list) — sets the bar for cash-flow.
- Cap rate 4.6% vs local median 8.3% in Calumet City — below-typical yield; the buyer is paying a premium for something (appreciation thesis, condition, location) that the cap rate doesn't capture.
Location & tenants
- Location reads 71/100 on livability (#330 in IL) — a middle-class / working-renter tenant base. Strengths: commute A+, cost of living A+, housing A+; Watch: employment C-, crime D-, amenities F.
- Thornton Fractional Twp Hsd 215 (suburban): math 9% / reading 13% proficiency, ranked #563 of 620 in IL (top 91%) — low school quality limits family demand, transient renter base, plan for 1-2y turnover.
- Zoned schools: Hoover Elem School (556 students, 0% FRL); Schrum Memorial School (math 24% / reading 24%, grade F, #332 of 665 statewide, top 55%, 277 students, 0% FRL); Thornton Fractnl No High School (math 6% / reading 10%, grade F, #587 of 693 statewide, top 85%, 1,383 students, 0% FRL).
- Market conditions: Rents rising fast (+6.2%/yr); 195 active listings in the ZIP; 16 comparable units currently listed for rent nearby; rentals at typical pace (median 15d on market — plan ~3-4 weeks tenant-placement turnaround); 6,272 units permitted in Cook County in 2024 (4,658 in 5+ unit buildings).
- This rent runs 36% of the median local income ($55k/yr) — at the standard rent-burdened threshold; future hikes will face affordability resistance.
Forward outlook
- Local home prices are declining (-3.0%/yr); year-one equity from $1k of loan paydown is wiped out by about $5k of value loss. Plan a longer hold.
Negotiation context
- It's been on market 21 days — a 2% lower offer ($157k) is reasonable based on typical stale-listing flexibility.
- 12 sale attempts since 10y ago; this cycle's ask has dropped $31k (16%) from the opening price — seller is motivated, your offer sets the floor, not the list.
Risks & watch-outs
- Watch-outs: property tax is 4.8% of price.
- Climate carrying-cost: moderate flood risk — expect insurance premiums to compound above CPI over the hold.
Questions for the listing agent
- What do current leases actually rent for vs. the listed asking? Can we see a recent rent roll and the last 12 months of T-12 income?
- Built in 1961 — when were the roof, HVAC, electrical panel, plumbing, and water heater last replaced?
- Property tax is high relative to price — has the assessment been appealed recently, and will the sale trigger a re-assessment?
- Is there a deadline driving the sale (1031 exchange, divorce, estate, relocation)? That informs how much negotiation room exists.
- Schools are F-rated, which usually means shorter tenancies and higher turnover. Who's the typical renter profile here, and what's been the actual vacancy rate?
- Crime grade is D in this area — have there been break-ins, vandalism, or insurance claims at this property in the last 3 years? What carrier currently insures it and at what premium?
- The area grade is low — what's the realistic commute time and amenity access for the typical tenant pool here? Any planned neighborhood developments (good or bad) we should know about?
- What's the average days-on-market for RENTAL listings here right now (not sales)? A rising rental-DOM trend means longer vacancies and softer asking-rent achievability than the comps imply.
- What's the recent tenant-quality profile in this submarket — average credit score on applications, eviction rate, late-payment / NSF rate, and stable-employment percentage? A property-management company in the area should have these aggregated.
- How much new for-sale + rental construction is in the pipeline within 1–3 miles? Heavy new supply typically softens prices + rents 12–24 months out; constrained supply supports both.
Investment metrics
- 1% rule
- 1.05% ✓
- Cap rate
- 4.63%
- Cash-on-cash
- -5.94%
- DSCR
- 0.74
- GRM
- 7.9
CMA / ARV
- ARV (on-the-fly)
- $167,829
- Comps found
- 12
Show comp detail 12 sales within ~0.75 mi
| Address | Dist | Beds/Ba | Sqft | Sold | Price | $/sf | Match |
|---|---|---|---|---|---|---|---|
| 877 163rd St | 0.15mi | 3/1.5 | 1,339 (+3%) | 2mo | $189,000 | $141 | 87 |
| 1387 Price Ave | 0.35mi | 3/1.0 | 1,341 (+3%) | 3mo | $93,900 | $70 | 74 |
| 910 163rd St | 0.19mi | 3/1.5 | 1,160 (-11%) | 1mo | $150,000 | $129 | 72 |
| 1382 Burnham Ave | 0.19mi | 3/1.5 | 1,147 (-12%) | 1mo | $105,000 | $92 | 71 |
| 1272 Burnham Ave | 0.35mi | 3/1.5 | 1,147 (-12%) | 3mo | $186,000 | $162 | 61 |
| 1216 Balmoral Ave | 0.50mi | 3/1.5 | 1,177 (-10%) | 1mo | $135,000 | $115 | 60 |
| 1278 Balmoral Ave | 0.38mi | 4/1.5 (+1) | 1,177 (-10%) | 3mo | $199,000 | $169 | 59 |
| 1295 Hirsch Ave | 0.38mi | 4/2.0 (+1) | 1,166 (-10%) | 3mo | $265,000 | $227 | 56 |
| 1394 Forest Pl | 0.55mi | 3/1.0 | 1,147 (-12%) | 2mo | $81,000 | $71 | 51 |
| 1450 Forest Ave | 0.64mi | 3/1.0 | 1,147 (-12%) | 3mo | $105,000 | $92 | 46 |
| 1461 Wentworth Ave | 0.74mi | 4/1.5 (+1) | 1,400 (+8%) | 4mo | $130,000 | $93 | 44 |
| 1531 Lincoln Ave | 0.69mi | 3/1.0 | 1,109 (-15%) | 1mo | $170,000 | $153 | 41 |
Match score weights: distance 35% · size 25% · config 20% · recency 20%. Top-matched comps best support the ARV.
Projected returns pro-forma
-3.0% appreciation · 6.17% rent growth · sell at horizon
- IRR
- -21.2%
- Equity multiple
- 0.24×
- Total profit
- $-33,997
- Equity at exit
- $23,707
- IRR
- -6.6%
- Equity multiple
- 0.50×
- Total profit
- $-22,377
- Equity at exit
- $13,747
Cash invested: $44,520 (down + closing). Projections, not guarantees.
Landlord ↔ Tenant lean methodology
- Overall (STATE)
- 43 Moderately Tenant-Leaning
- State Illinois
- 43 Moderately Tenant-Leaning · D+7
- County
- — inherits STATE
- City
- — inherits STATE
ZIP-level market 60409
- Home prices YoY
- -27.6%
- Rents YoY
- 6.2%
- Active inventory
- 195
- Price-to-rent
- 7.9×
Monthly cashflow live
- Estimated rent
- $1,671 high interval (Pro) →
- Mortgage (P&I)
- −$834
- Tax from tax record
- −$640 /mo · $7,684/yr
- Insurance
- −$66
- HOA
- −$0
- Lot rent
- −$0
- Vacancy / Maint / Mgmt
- −$351
- Net cashflow
- $-220
Break-even live
Sensitivity live
| Price | -10% $331 | -5% $276 | +0% $-220 | +5% $-265 | +10% $-310 |
|---|---|---|---|---|---|
| Rent | -10% $-352 | -5% $-286 | +0% $-220 | +5% $-154 | +10% $-88 |
| Rate | -1.0pp $-140 | -0.5pp $-180 | base $-220 | +0.5pp $-261 | +1.0pp $-303 |
UW: 25.0% down · 7.5% · 30yr · 1.5% tax · 5.0% vac · 8.0% maint · 8.0% mgmt
Financing live
Cash to close
- Down payment
- $39,750
- Closing costs
- $4,770
- Reserves months
- —
- Total cash needed
- —
Loan-product check · same deal, 3 products live
Conventional
25% down · 7.5% · 30yr
- Down + closing
- —
- Monthly P&I
- —
- Monthly cashflow
- —
- DSCR
- —
- Eligible?
- —
Personal DTI + credit; lowest rate.
DSCR
20% down · 8.5% · 30yr
- Down + closing
- —
- Monthly P&I
- —
- Monthly cashflow
- —
- DSCR
- —
- Eligible?
- —
No personal income docs; deal must DSCR.
Hard money
10% down · 12.0% · 12mo
- Down + closing
- —
- Monthly P&I
- —
- Monthly cashflow
- —
- DSCR
- —
- Eligible?
- —
Short-term bridge; refi at stabilization.
Rent comps 16 comps
| Address | Beds | Baths | Sqft | Rent | $/sqft | DOM | Units | Dist |
|---|---|---|---|---|---|---|---|---|
| 1312 Gordon Ave Calumet City, IL | 2.0 | 1.0 | 1134 | $1,600 | $1.41 | 9d | 1 | 0.41mi |
| 1539 Wentworth Ave Unit 3W Calumet City, IL | 3.0 | 1.0 | 1100 | $1,700 | $1.55 | 14d | 1 | 0.79mi |
| 17104 Wentworth Ave Unit 4 Lansing, IL | 2.0 | 1.0 | 1100 | $1,400 | $1.27 | 1d | 1 | 0.94mi |
| 3023 Bernice Rd Apt 2S Lansing, IL | 3.0 | 1.0 | 1000 | $1,600 | $1.60 | 0d | 1 | 1.03mi |
| 3023 Bernice Rd Unit 3030 3N Lansing, IL | 3.0 | 1.0 | 1000 | $1,400 | $1.40 | 1d | 1 | 1.03mi |
| 3069 Bernice Rd Apt 2S Lansing, IL | 3.0 | 1.0 | 950 | $1,535 | $1.62 | 5d | 1 | 1.03mi |
| 3069 Bernice Rd Apt 2N Lansing, IL | 3.0 | 1.0 | 950 | $1,535 | $1.62 | 23d | 1 | 1.03mi |
| 34 Elizabeth St Calumet City, IL | 3.0 | 1.0 | 1246 | $2,400 | $1.93 | 0d | 1 | 1.14mi |
| 3 Waltham St Hammond, IN | 3.0 | 1.0 | 1200 | $1,095 | $0.91 | 26d | 1 | 1.26mi |
| 5 Ruth St Unit 2W Hammond, IN | 2.0 | 1.0 | 900 | $1,250 | $1.39 | 15d | 1 | 1.29mi |
| 3 Ruth St Hammond, IN | 2.0 | 1.0 | 900 | $1,250 | $1.39 | 26d | 1 | 1.29mi |
| 3649 173rd Ct Lansing, IL | 2.0 | 2.0 | 972 | $1,357 | $1.40 | 26d | 1 | 1.31mi |
| 407 Kenwood St Hammond, IN | 2.0 | 1.0 | 920 | $1,495 | $1.62 | 19d | 1 | 1.34mi |
| 407 Kenwood St Hammond, IN | 2.0 | 1.0 | 920 | $1,495 | $1.62 | 26d | 1 | 1.34mi |
| 3020 178th St Apt C7 Lansing, IL | 2.0 | 1.0 | 900 | $1,550 | $1.72 | 26d | 1 | 1.49mi |
| 3020 178th St Unit C1 Lansing, IL | 2.0 | 1.0 | 900 | $1,550 | $1.72 | 0d | 1 | 1.49mi |
Listing history 50 events
-
2026-06-22days on market $159,000 Active 21 DOM
-
2026-06-21days on market $159,000 Active 20 DOM
-
2026-06-18days on market $159,000 Active 17 DOM
-
2026-06-17days on market $159,000 Active 16 DOM
-
2026-06-16days on market $159,000 Active 15 DOM
-
2026-06-15days on market $159,000 Active 14 DOM
-
2026-06-13days on market $159,000 Active 12 DOM
-
2026-06-09days on market $159,000 Active 8 DOM
-
2026-06-08days on market $159,000 Active 7 DOM
-
2026-06-07days on market $159,000 Active 6 DOM
-
2026-06-04remarks 464-char remark
-
2026-06-04days on market $159,000 Active 3 DOM
-
2026-06-03days on market $159,000 Active 2 DOM
-
2026-06-02pricedays on market $159,000 Active 1 DOM
-
2026-06-01days on market $189,900 Active 44 DOM
-
2026-05-31days on market $189,900 Active 43 DOM
-
2026-04-18$189,900 Active
-
2020-04-10soldstatus $155,000
-
2020-03-16soldstatus $155,000 Closed Sale 683-char remark
Show marketing remark (683 chars)
A Beautiful Large Split-Level Home On A Large Corner Lot In Calumet City. This Home Was Redesigned With An Open-Airy Concept In Mind. Your Main Level Consists Of A Great Room With Living, Dining And Kitchen Space. The Upgrades On This Floor Include A Sleek Modern 78" Fireplace, Gourmet Kitchen With An Oversized Island And Winecooler. Main Level Includes One Of The Four Spacious Bedrooms And Two Are Located On The Second Level With New Hardwood Flooring. .. .The Fourth Is On Its Own Separated By The Family Room With ANOTHER Large Fireplace AND Dry Sauna For Maximum Relaxation In Your Home. This Property Boasts Tons Of Decor Features And Includes An ATTACHED 2 Car Garage!
-
2020-01-21historical Contingent (Do Not Show) 683-char remark
Show marketing remark (683 chars)
A Beautiful Large Split-Level Home On A Large Corner Lot In Calumet City. This Home Was Redesigned With An Open-Airy Concept In Mind. Your Main Level Consists Of A Great Room With Living, Dining And Kitchen Space. The Upgrades On This Floor Include A Sleek Modern 78" Fireplace, Gourmet Kitchen With An Oversized Island And Winecooler. Main Level Includes One Of The Four Spacious Bedrooms And Two Are Located On The Second Level With New Hardwood Flooring. .. .The Fourth Is On Its Own Separated By The Family Room With ANOTHER Large Fireplace AND Dry Sauna For Maximum Relaxation In Your Home. This Property Boasts Tons Of Decor Features And Includes An ATTACHED 2 Car Garage!
-
2020-01-09$179,000 New 683-char remark
Show marketing remark (683 chars)
A Beautiful Large Split-Level Home On A Large Corner Lot In Calumet City. This Home Was Redesigned With An Open-Airy Concept In Mind. Your Main Level Consists Of A Great Room With Living, Dining And Kitchen Space. The Upgrades On This Floor Include A Sleek Modern 78" Fireplace, Gourmet Kitchen With An Oversized Island And Winecooler. Main Level Includes One Of The Four Spacious Bedrooms And Two Are Located On The Second Level With New Hardwood Flooring. .. .The Fourth Is On Its Own Separated By The Family Room With ANOTHER Large Fireplace AND Dry Sauna For Maximum Relaxation In Your Home. This Property Boasts Tons Of Decor Features And Includes An ATTACHED 2 Car Garage!
-
2020-01-09historical
Show marketing remark (683 chars)
A Beautiful Large Split-Level Home On A Large Corner Lot In Calumet City. This Home Was Redesigned With An Open-Airy Concept In Mind. Your Main Level Consists Of A Great Room With Living, Dining And Kitchen Space. The Upgrades On This Floor Include A Sleek Modern 78" Fireplace, Gourmet Kitchen With An Oversized Island And Winecooler. Main Level Includes One Of The Four Spacious Bedrooms And Two Are Located On The Second Level With New Hardwood Flooring. .. .The Fourth Is On Its Own Separated By The Family Room With ANOTHER Large Fireplace AND Dry Sauna For Maximum Relaxation In Your Home. This Property Boasts Tons Of Decor Features And Includes An ATTACHED 2 Car Garage!
-
2019-11-29price
-
2019-10-23price
-
2019-09-19New
-
2019-03-25soldstatus $70,000 Closed Sale
-
2019-03-06status Pending
-
2019-02-12$76,220 New
-
2018-07-17historical Contingent
-
2018-07-16historical
-
2018-05-02status Reactivated
-
2018-03-29status Pending
-
2018-03-17price
-
2018-02-12New
-
2018-01-05historical
-
2017-12-31price
-
2017-11-28price
-
2017-10-17price
-
2017-10-09price
-
2017-09-17price
-
2017-09-08historical
-
2017-09-08New
-
2017-08-02status Reactivated
-
2017-05-11status Pending
-
2017-04-18price
-
2017-03-22status Reactivated
-
2017-03-08historical Contingent
-
2017-01-25price
-
2017-01-06price
-
2016-11-14status Reactivated
ⓘ Source: listings_history table (triggers on properties + properties_extension) + one-shot
backfill from property_details.listing_events for pre-trigger history.
Tax reassessment forecast IL · Partial reset (capped growth)
- Current annual tax
- $7,684 · $640/mo
- Projected year-2 tax
- $7,684 · $640/mo
- Expected delta
- $0/yr ($0/mo · 0.0%)
ⓘ Screening estimate from a state-policy table — verify with the county assessor before closing.
Climate risk First Street
- Flood 5/10 Major FEMA zone X (shaded) · 50% chance over 30 yrs
- Wildfire 1/10 Low
- Heat 3/10 Moderate 7 d/yr ≥102°F today · 15 d/yr by 30 yrs out
- Wind 2/10 Low
- Air quality 4/10 Moderate 5 unhealthy d/yr today · 6 by 30 yrs out
Nearby sold comps map
Loading sold comps map…
Walkable amenities ~0.75 mi
Loading nearby amenities…
Taxation est. · year 1
- Rental income
- $20,052
- − Mortgage interest
- −$8,906
- − Property taxes
- −$7,684
- − Insurance
- −$795
- − Repairs & maintenance
- −$1,604
- − Management
- −$1,604
- − Depreciation
- −$4,625
- Taxable loss
- −$5,166
- Est. tax savings @ 24.0%
- +$1,240
- After-tax cash flow
- $-1,403/yr
For passive investors: Depreciation is non-cash, so a rental often shows a tax loss while cash-flowing — sheltering income. Rental losses are passive: they offset passive income freely, and up to $25,000/yr can offset ordinary (W-2) income if you actively participate and your MAGI is under $100k (phasing out to $0 by $150k); unused losses carry forward. On sale, claimed depreciation is recaptured at up to 25%, and gains may owe capital-gains tax (a 1031 exchange can defer both). Figures are a year-1 estimate at your 24.0% rate — not tax advice; consult a CPA.
Schools (NCES district)
- District
- Thornton Fractional Twp Hsd 215
- NCES district ID
- 1738940
- Math proficiency
- 9% ▼ -3.00%
- Reading proficiency
- 13% ▼ -3.00%
- Median HH income
- $48,207
- Composite
- 10.27/100
- National rank
- #9793
- State rank
- #563 of 620 in IL
Livability — Calumet City
- Score
- 71/100
- State rank
- #330
- US rank
- #6552
Category grades
Schools grade is shown separately in the Schools card above.
Census & demographics
- Census place
- Calumet City, IL
- County
- Cook County · 4,486,803 people
- City population
- 35,100
- Metro
- Chicago-Naperville-Elgin, IL-IN-WI
- Population (ZIP)
- 35,100
- Household income
- $55,369
- Rent vs Own
- Severe rent burden
- 2415.0
Population outlook (Cook County) Hauer SSP2
- Today (2025)
- 5,347,519 people
- By 2030
- 5,357,703 · +0.2%
- By 2040
- 5,324,924 · -0.4%
- By 2050
- 5,230,762 · -2.2%
- By 2075
- 4,785,735 · -10.5%
- By 2100
- 4,188,836 · -21.7%
Race, ethnicity, and origin ACS 2023
- Neighborhood character
- Predominantly Black (74%)
- Race & ethnicity
- Black 74% Hispanic / Latino 15% White 7% Two or more races 4%
- Hispanic origin (detail)
- Mexican 14%
- Common ancestry
- Romanian 2%
- Foreign-born
- 9% · Canada
- Languages at home
- 83% English-only · Spanish 14%
Political lean MEDSL · Cook
- 2024 margin
- Solid D (+42.0) · D 70.4% · R 28.4% · Other 1.2%
- 2008→2024 swing
- -11.4pp toward R · 2008: 53.4pp · 2024: 42.0pp
- All cycles
- 2024: D+42.0 2020: D+50.3 2016: D+53.0 2012: D+49.4 2008: D+53.4
Not yet ingested
- Civics
- —
Market trends
- HPI YoY
- ▼ -75.01%
- Current HPI
- 197.2137
- Rent YoY
- ▲ 6.17%
- Metro
- Chicago-Naperville-Elgin, IL-IN-WI
- State GDP YoY
- ▲ 1.59%
- F500 in state
- 60
Industry mix (Fortune 500 HQ in IL)
| Industry | F500 HQs | Revenue |
|---|---|---|
| Insurance | 4 | $201B |
|
||
| Consumer Goods | 4 | $87B |
|
||
| Industrial Machinery | 3 | $64B |
|
||
| Healthcare | 2 | $55B |
|
||
| Retail / Pharmacy | 1 | $148B |
|
||
| Agriculture / Food | 1 | $86B |
|
||
Price history
+216.5% since first listed51 events — show timeline
- 2026-04-18 Listed $189,900 MRED as Distributed by MLS Grid
- 2020-04-10 Sold (Public Records) $155,000 Public Records
- 2020-03-16 Sold (MLS) $155,000 MRED as Distributed by MLS Grid
- 2020-01-21 Contingent — MRED as Distributed by MLS Grid
- 2020-01-09 Listing Removed — MRED as Distributed by MLS Grid
- 2020-01-09 Listed $179,000 MRED as Distributed by MLS Grid
- 2019-11-29 Price Changed — MRED as Distributed by MLS Grid
- 2019-10-23 Price Changed — MRED as Distributed by MLS Grid
- 2019-09-19 Listed — MRED as Distributed by MLS Grid
- 2019-03-25 Sold (MLS) $70,000 MRED as Distributed by MLS Grid
- 2019-03-06 Pending — MRED as Distributed by MLS Grid
- 2019-02-12 Listed $76,220 MRED as Distributed by MLS Grid
- 2018-07-17 Contingent — MRED as Distributed by MLS Grid
- 2018-07-16 Listing Removed — MRED as Distributed by MLS Grid
- 2018-05-02 Relisted — MRED as Distributed by MLS Grid
- 2018-03-29 Pending — MRED as Distributed by MLS Grid
- 2018-03-17 Price Changed — MRED as Distributed by MLS Grid
- 2018-02-12 Listed — MRED as Distributed by MLS Grid
- 2018-01-05 Listing Removed — MRED as Distributed by MLS Grid
- 2017-12-31 Price Changed — MRED as Distributed by MLS Grid
- 2017-11-28 Price Changed — MRED as Distributed by MLS Grid
- 2017-10-17 Price Changed — MRED as Distributed by MLS Grid
- 2017-10-09 Price Changed — MRED as Distributed by MLS Grid
- 2017-09-17 Price Changed — MRED as Distributed by MLS Grid
- 2017-09-08 Listing Removed — MRED as Distributed by MLS Grid
- 2017-09-08 Listed — MRED as Distributed by MLS Grid
- 2017-08-02 Relisted — MRED as Distributed by MLS Grid
- 2017-05-11 Pending — MRED as Distributed by MLS Grid
- 2017-04-18 Price Changed — MRED as Distributed by MLS Grid
- 2017-03-22 Relisted — MRED as Distributed by MLS Grid
- 2017-03-08 Contingent — MRED as Distributed by MLS Grid
- 2017-01-25 Price Changed — MRED as Distributed by MLS Grid
- 2017-01-06 Price Changed — MRED as Distributed by MLS Grid
- 2016-11-14 Relisted — MRED as Distributed by MLS Grid
- 2016-11-14 Listing Removed — MRED as Distributed by MLS Grid
- 2016-11-06 Price Changed — MRED as Distributed by MLS Grid
- 2016-09-16 Price Changed — MRED as Distributed by MLS Grid
- 2016-09-16 Relisted — MRED as Distributed by MLS Grid
- 2016-09-15 Listing Removed — MRED as Distributed by MLS Grid
- 2016-08-26 Price Changed — MRED as Distributed by MLS Grid
- 2016-08-10 Price Changed — MRED as Distributed by MLS Grid
- 2016-06-03 Price Changed — MRED as Distributed by MLS Grid
- 2016-05-06 Price Changed — MRED as Distributed by MLS Grid
- 2016-04-09 Price Changed — MRED as Distributed by MLS Grid
- 2016-03-15 Listed — MRED as Distributed by MLS Grid
- 2015-11-30 Listing Removed — MRED as Distributed by MLS Grid
- 2015-11-03 Price Changed — MRED as Distributed by MLS Grid
- 2015-10-20 Price Changed — MRED as Distributed by MLS Grid
- 2003-03-17 Sold (Public Records) $125,000 Public Records
- 1998-11-24 Sold (Public Records) $103,000 Public Records
- 1978-11-02 Sold (Public Records) $60,000 Public Records
Property tax history
+5.8%/yrLatest (2023): $7,684 · +19.0% YoY. Source: county tax records.
Cash-flow waterfall
monthlySold comps — $/sqft
last 12 mo · ≤1 miLoading sold comps…