725 Cloverwood Dr · Wylie, TX
Flood risk No data
- FEMA flood zone
- —
- Chance of flooding over 30 yrs
- —
- Est. flood insurance / yr
- —
Fire risk No data
- Est. fire insurance / yr
- —
Heat risk No data
- Hot days now (above threshold)
- —
- Hot days in 30 yrs
- —
Wind risk No data
- Chance of severe wind over 30 yrs
- —
Air-quality risk No data
- Unhealthy air days now
- —
- Unhealthy air days in 30 yrs
- —
Risk factors via First Street. Map © Google.
Why this score? — see what drove the D grade
The composite is a weighted blend of 9 inputs, each scored 0–100. Each bar is that input's sub-score; the figure is the points it added to the 100-point composite (weight × sub-score).
- Cash flow +12.2/30.0
- ARV discount +8.2/15.0
- Condition / age +5.0/5.0
- Schools +4.2/10.0
- 1% rule +3.7/10.0
- DSCR +3.6/10.0
- Livability +3.5/5.0
- Rent growth +2.2/5.0
- Appreciation +0.0/10.0
$229,230
🖨 Deal sheet (PDF) 📄 Offer letter ✓ Due diligence
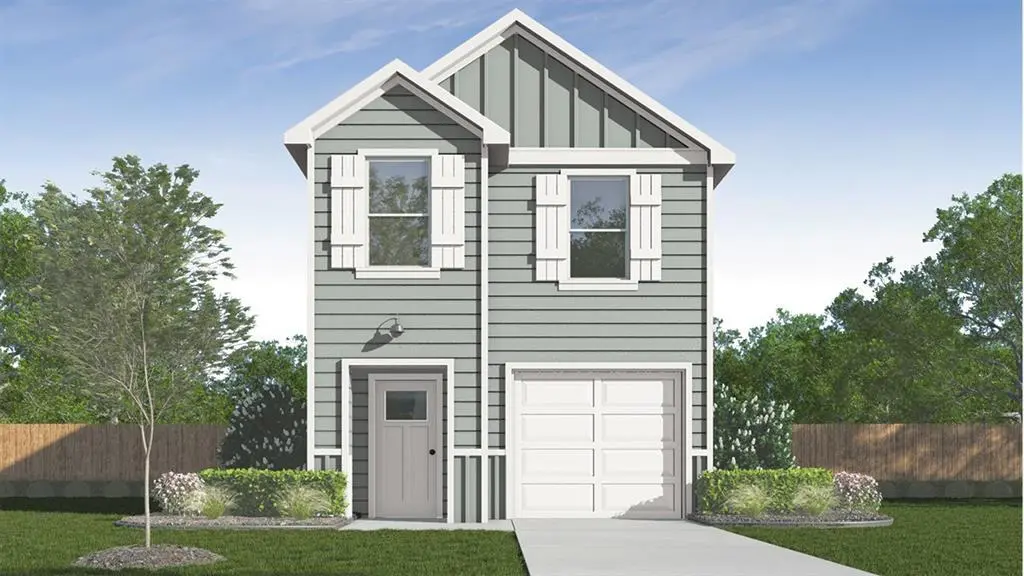
Listing remarks
New homes in Princeton, TX! Welcome to Arbor Trails! This gorgeous new Express homes community is located in Collin County, Branch , Princeton area off CR 437. DR Horton, your new home builder, we offer 3 different plans in Arbor Trails ranging from a 2 2.5 1 1,130 sq ft to a 4 2.5 1 that's 1,549 sq ft.
Key facts
- 3,572 sq ft lot
- Garage
- Built 2025
Property features AI
Finance
- Other: Located in the Arbor Trails North subdivision; Lot smaller than 0.5 acre (about 0.082 acre)
- Financial info: Treat as clear loan type; No second mortgage indicated
- HOA & community: Mandatory HOA; HOA semi-annual fee of 250; Association covers management fees; Neighborhood management company
Exterior
- Parking: Attached garage; One covered/garage space
- Security: Carbon monoxide detectors; Smoke detectors
- Utilities: City water; City sewer; Municipal utility district
- Home design: Single-family residence; Two levels; New construction completed in 2025; Smart home features present
- Construction: Frame and siding construction; Composition roof; Slab foundation
- Exterior features: Wood fencing; Concrete, curbs and sidewalks; Underground utilities
Interior
- Kitchen: Dishwasher; Disposal; Electric oven; Electric range
- Bedrooms: Primary bedroom on 2nd level; Three additional bedrooms on 2nd level
- Flooring: Carpet; Laminate
- Bathrooms: Two full bathrooms; One half bathroom
- Heating & cooling: Central heating (electric); Central air conditioning (electric)
- Interior features: Cable TV available; High-speed internet available; Other interior features
- Laundry & utility: HVAC system (listed under energy efficiency)
Neighborhood map
What this means for you Summary
Snapshot
- This is a 4-bed/2.5-bath single-family listed at $229k. Condition is rated excellent.
Deal economics
- At list price, monthly cash flow is $-44 ($-534/yr) — negative.
- To cash-flow at today's rent, offer at most $223k (2.8% below list).
- To meet the 1% rule (rent ≥ 1% of price), the offer needs to be $200k (12.7% below list).
- Recommended offer: $200k (12.7% below list) — sets the bar for 1% rule.
- Cap rate 6.1% vs local median 4.0% in Wylie — top-decile yield for the area; either an underpriced asset or a hidden risk that comps aren't pricing in. Stress-test before assuming the spread holds.
Location & tenants
- Location reads 69/100 on livability (#419 in TX) — a middle-class / working-renter tenant base. Strengths: crime A+, employment A+, housing A+; Watch: amenities F, commute F, health & safety F.
- Princeton ISD (suburban): math 51% / reading 47% proficiency, ranked #188 of 826 in TX (top 23%) — families likely to look elsewhere, expect single-tenant / working-renter base with shorter leases.
- Zoned schools: Mayfield El (609 students, 73% FRL); Clark Middle (math 53% / reading 42%, grade C-, #408 of 1,662 statewide, top 25%, 707 students, 66% FRL); Princeton H S (math 52% / reading 54%, grade C-, #437 of 1,632 statewide, top 27%, 1,521 students, 57% FRL).
- Market conditions: Rents soft (-1.0%/yr); 1410 active listings in the ZIP; 40 comparable units currently listed for rent nearby; rentals at typical pace (median 21d on market — plan ~3-4 weeks tenant-placement turnaround); solid renter incomes; 19,194 units permitted in Collin County in 2024 (3,988 in 5+ unit buildings).
Forward outlook
- Local home prices are declining (-3.0%/yr); year-one equity from $2k of loan paydown is wiped out by about $7k of value loss. Plan a longer hold.
- Collin County population projected at +60% by 2050 — long-run rental-demand tailwind backs the buy-and-hold thesis.
Negotiation context
- It's been on market 32 days — a 3% lower offer ($222k) is reasonable based on typical stale-listing flexibility.
- 2 sale attempts with the ask held roughly flat each time — persistent listings suggest the price (not the market) is what's stuck; bring a comps-based counter.
Questions for the listing agent
- What do current leases actually rent for vs. the listed asking? Can we see a recent rent roll and the last 12 months of T-12 income?
- It's been on market 32 days. Have you received any prior offers? Is the seller open to a 13% concession, seller financing, or rate buy-down credit?
- What does the HOA fee cover, when was the last increase, and are there any pending special assessments or reserve-fund shortfalls?
- Is there a deadline driving the sale (1031 exchange, divorce, estate, relocation)? That informs how much negotiation room exists.
- Schools are B-rated — typically a magnet for longer-tenancy family renters. What's the average tenant stay here, and is there a school-zone premium baked into asking?
- The area grade is low — what's the realistic commute time and amenity access for the typical tenant pool here? Any planned neighborhood developments (good or bad) we should know about?
- What's the average days-on-market for RENTAL listings here right now (not sales)? A rising rental-DOM trend means longer vacancies and softer asking-rent achievability than the comps imply.
- What's the recent tenant-quality profile in this submarket — average credit score on applications, eviction rate, late-payment / NSF rate, and stable-employment percentage? A property-management company in the area should have these aggregated.
- How much new for-sale + rental construction is in the pipeline within 1–3 miles? Heavy new supply typically softens prices + rents 12–24 months out; constrained supply supports both.
Investment metrics
- 1% rule
- 0.87% ✗
- Cap rate
- 6.06%
- Cash-on-cash
- -0.83%
- DSCR
- 0.96
- GRM
- 9.5
CMA / ARV
- ARV (median comp)
- $232,693
- List price
- $229,230
- Delta
- -1.49%
- Verdict
- FAIR
- Comps
- 20 within 1.0 mi
Show comp detail 12 sales within ~0.75 mi
| Address | Dist | Beds/Ba | Sqft | Sold | Price | $/sf | Match |
|---|---|---|---|---|---|---|---|
| 6100 Pinion Trl | 0.07mi | 4/2.5 | 1,549 (0%) | 1mo | $237,490 | $153 | 96 |
| 6314 Sandpiper Ln | 0.20mi | 4/2.5 | 1,535 (-1%) | 1mo | $207,999 | $136 | 89 |
| 6110 Pinion Trl | 0.07mi | 3/2.5 (-1) | 1,419 (-8%) | 1mo | $229,990 | $162 | 77 |
| 724 Wagtail Dr | 0.14mi | 3/2.5 (-1) | 1,360 (-12%) | 2mo | $195,999 | $144 | 67 |
| 6308 Sandpiper Ln | 0.18mi | 3/2.5 (-1) | 1,360 (-12%) | 1mo | $217,999 | $160 | 66 |
| 6412 Longspur Ln | 0.37mi | 3/2.0 (-1) | 1,402 (-10%) | 0mo | $222,999 | $159 | 60 |
| 6413 Longspur Ln | 0.39mi | 3/2.0 (-1) | 1,411 (-9%) | 1mo | $215,000 | $152 | 59 |
| 416 Sandhill Crane Ln | 0.39mi | 3/2.0 (-1) | 1,402 (-10%) | 0mo | $221,999 | $158 | 59 |
| 6508 Glade St | 0.42mi | 3/2.0 (-1) | 1,402 (-10%) | 1mo | $222,999 | $159 | 57 |
| 6414 Willet Rd | 0.42mi | 3/2.0 (-1) | 1,402 (-10%) | 1mo | $252,999 | $180 | 57 |
| 403 Shearwater Ave | 0.49mi | 3/2.0 (-1) | 1,402 (-10%) | 2mo | $253,674 | $181 | 53 |
| 5430 Longshadow Dr | 0.74mi | 3/2.0 (-1) | 1,436 (-7%) | 1mo | $205,000 | $143 | 46 |
Match score weights: distance 35% · size 25% · config 20% · recency 20%. Top-matched comps best support the ARV.
Projected returns pro-forma
-3.0% appreciation · 0.0% rent growth · sell at horizon
- IRR
- -21.2%
- Equity multiple
- 0.29×
- Total profit
- $-45,788
- Equity at exit
- $34,179
- IRR
- -24.1%
- Equity multiple
- -0.03×
- Total profit
- $-65,966
- Equity at exit
- $19,820
Cash invested: $64,184 (down + closing). Projections, not guarantees.
Landlord ↔ Tenant lean methodology
- Overall (STATE)
- 87 Strongly Landlord-Friendly
- State Texas
- 87 Strongly Landlord-Friendly · R+5
- County
- — inherits STATE
- City
- — inherits STATE
ZIP-level market 75407
- Home prices YoY
- -30.3%
- Rents YoY
- -1.0%
- Active inventory
- 1410
- Price-to-rent
- 9.5×
Monthly cashflow live
- Estimated rent
- $2,002 high interval (Pro) →
- Mortgage (P&I)
- −$1,202
- Tax est. 1.5%
- −$287 /mo · $3,438/yr
- Insurance
- −$96
- HOA
- −$42
- Vacancy / Maint / Mgmt
- −$420
- Net cashflow
- $-44
Break-even live
Sensitivity live
| Price | -10% $114 | -5% $35 | +0% $-44 | +5% $-124 | +10% $-203 |
|---|---|---|---|---|---|
| Rent | -10% $-203 | -5% $-124 | +0% $-44 | +5% $35 | +10% $114 |
| Rate | -1.0pp $71 | -0.5pp $14 | base $-44 | +0.5pp $-104 | +1.0pp $-164 |
UW: 25.0% down · 7.5% · 30yr · 1.5% tax · 5.0% vac · 8.0% maint · 8.0% mgmt
Financing live
Cash to close
- Down payment
- $57,308
- Closing costs
- $6,877
- Reserves months
- —
- Total cash needed
- —
Loan-product check · same deal, 3 products live
Conventional
25% down · 7.5% · 30yr
- Down + closing
- —
- Monthly P&I
- —
- Monthly cashflow
- —
- DSCR
- —
- Eligible?
- —
Personal DTI + credit; lowest rate.
DSCR
20% down · 8.5% · 30yr
- Down + closing
- —
- Monthly P&I
- —
- Monthly cashflow
- —
- DSCR
- —
- Eligible?
- —
No personal income docs; deal must DSCR.
Hard money
10% down · 12.0% · 12mo
- Down + closing
- —
- Monthly P&I
- —
- Monthly cashflow
- —
- DSCR
- —
- Eligible?
- —
Short-term bridge; refi at stabilization.
Rent comps 40 comps
| Address | Beds | Baths | Sqft | Rent | $/sqft | DOM | Units | Dist |
|---|---|---|---|---|---|---|---|---|
| 6102 Pinion Trl , TX | 3.0 | 2.5 | 1419 | $1,600 | $1.13 | 45d | 1 | 0.07mi |
| 6015 Pinion Trl , TX | 4.0 | 2.5 | 1615 | $1,950 | $1.21 | 45d | 1 | 0.08mi |
| 623 Linden Rd Princeton, TX | 3.0 | 2.5 | 1419 | $1,650 | $1.16 | 45d | 1 | 0.09mi |
| 6018 Primrose Rd , TX | 3.0–4.0 | 2.5 | 1484 | $1,875 | $1.26 | 5d | 5 | 0.11mi |
| 6222 Sandpiper Ln Unit NA Princeton, TX | 3.0 | 2.5 | 1400 | $1,750 | $1.25 | 9d | 1 | 0.13mi |
| 724 Wagtail Dr Princeton, TX | 3.0 | 2.5 | 1360 | $1,650 | $1.21 | 0d | 1 | 0.14mi |
| 724 Wagtail Dr Princeton, TX | 3.0 | 2.5 | 1360 | $1,675 | $1.23 | 4d | 1 | 0.14mi |
| 721 Wagtail Dr Princeton, TX | 4.0 | 2.5 | 1535 | $1,600 | $1.04 | 26d | 1 | 0.17mi |
| 6225 Kingfisher Way Princeton, TX | 3.0 | 2.5 | 1290 | $1,625 | $1.26 | 6d | 1 | 0.18mi |
| 801 Wagtail Dr , TX | 4.0 | 2.5 | 1535 | $1,975 | $1.29 | 9d | 1 | 0.18mi |
| 803 Wagtail Dr , TX | 3.0 | 2.5 | 1360 | $1,605 | $1.18 | 24d | 1 | 0.18mi |
| 6310 Sandpiper Ln Princeton, TX | 4.0 | 2.5 | 1549 | $2,030 | $1.31 | 13d | 1 | 0.19mi |
| 6311 Whimbrel Way Princeton, TX | 4.0 | 2.5 | 1535 | $1,775 | $1.16 | 0d | 1 | 0.19mi |
| 732 Sandhill Crane Ln Princeton, TX | 4.0 | 2.5 | 1570 | $1,875 | $1.19 | 13d | 1 | 0.19mi |
| 812 Sandhill Crane Ln Princeton, TX | 3.0 | 2.5 | 1309 | $1,850 | $1.41 | 45d | 1 | 0.21mi |
| 6313 Kingfisher Way Princeton, TX | 3.0 | 3.0 | 1360 | $1,650 | $1.21 | 45d | 1 | 0.23mi |
| 905 Blue Heron Dr Princeton, TX | 4.0 | 2.5 | 1535 | $1,775 | $1.16 | 24d | 1 | 0.23mi |
| 905 Blue Heron Dr Princeton, TX | 4.0 | 2.5 | 1535 | $1,775 | $1.16 | 26d | 1 | 0.23mi |
| 926 Wood Stork Way Princeton, TX | 3.0 | 2.5 | 1285 | $1,700 | $1.32 | 26d | 1 | 0.23mi |
| 904 Sandhill Crane Ln Princeton, TX | 4.0 | 2.5 | 1600 | $1,750 | $1.09 | 45d | 1 | 0.24mi |
| 914 Sandhill Crane Ln Princeton, TX | 3.0 | 2.5 | 1189 | $1,775 | $1.49 | 9d | 1 | 0.25mi |
| 919 Blue Heron Dr Princeton, TX | 4.0 | 2.5 | 1535 | $1,700 | $1.11 | 19d | 1 | 0.26mi |
| 919 Blue Heron Dr Princeton, TX | 4.0 | 2.5 | 1535 | $1,775 | $1.16 | 45d | 1 | 0.26mi |
| 911 Sandhill Crane Ln Princeton, TX | 3.0 | 2.5 | 1360 | $1,575 | $1.16 | 46d | 1 | 0.26mi |
| 600 Sandhill Crane Ln Princeton, TX | 3.0 | 2.0 | 1402 | $2,100 | $1.50 | 14d | 1 | 0.27mi |
| 935 Sandhill Crane Ln Princeton, TX | 3.0 | 2.5 | 1189 | $1,999 | $1.68 | 20d | 1 | 0.28mi |
| 6234 Sanderling St Princeton, TX | 4.0 | 2.5 | 1535 | $1,725 | $1.12 | 45d | 1 | 0.29mi |
| 6505 Glade St Princeton, TX | 4.0 | 2.0 | 1600 | $1,800 | $1.12 | 45d | 1 | 0.43mi |
| 241 Boxberry Way Princeton, TX | 3.0 | 2.0 | 1411 | $1,725 | $1.22 | 45d | 1 | 0.46mi |
| 416 Finch CIR Princeton, TX | 3.0 | 2.0 | 1266 | $1,350 | $1.07 | 45d | 1 | 0.48mi |
| 5847 Rock Maple Dr Princeton, TX | 3.0 | 2.0 | 1481 | $1,785 | $1.21 | 9d | 1 | 0.49mi |
| 5847 Rock Maple Dr Princeton, TX | 3.0 | 2.0 | 1481 | $1,785 | $1.21 | 18d | 1 | 0.49mi |
| 5808 Cherry Hollow Way Princeton, TX | 3.0 | 2.0 | 1260 | $1,749 | $1.39 | 19d | 1 | 0.49mi |
| 427 Bower DR Princeton, TX | 4.0 | 2.0 | 1600 | $1,850 | $1.16 | 26d | 1 | 0.50mi |
| 5836 Crystal Water Way Princeton, TX | 3.0 | 2.0 | 1481 | $1,799 | $1.21 | 7d | 1 | 0.52mi |
| 613 Holleman Dr , TX | 3.0 | 2.0 | 1260 | $1,800 | $1.43 | 0d | 1 | 0.52mi |
| 545 Holleman Dr Princeton, TX | 3.0 | 2.0 | 1474 | $1,750 | $1.19 | 45d | 1 | 0.55mi |
| 538 Montclair Ave Princeton, TX | 3.0 | 2.0 | 1260 | $1,775 | $1.41 | 12d | 1 | 0.57mi |
| 402 Harvest St Princeton, TX | 3.0 | 2.0 | 1433 | $1,665 | $1.16 | 14d | 1 | 0.58mi |
| 656 Waymaker Way Princeton, TX | 4.0 | 3.0 | 2015 | $2,175 | $1.08 | 0d | 1 | 0.58mi |
HOA detail
- Monthly dues
- $42 · $504/yr
Listing history 23 events
-
2026-05-14price $234,230 304-char remark
-
2026-05-13price $234,230 1014-char remark
-
2026-05-07price $226,990 304-char remark
-
2026-05-06price $234,230 304-char remark
-
2026-05-06price $226,990 304-char remark
-
2026-05-02price $229,230 1014-char remark
-
2026-04-28status Active 1014-char remark
-
2026-04-28price $239,230 1014-char remark
-
2026-04-27price $236,990 304-char remark
-
2026-04-24$239,230 Active 304-char remark
-
2026-01-23historical 1014-char remark
-
2026-01-22historical
-
2026-01-08price $229,990 1014-char remark
-
2025-12-31price $237,230 1014-char remark
-
2025-11-20price $234,990
-
2025-11-19price $234,990 1014-char remark
-
2025-11-07price $229,990 1014-char remark
-
2025-11-07price $234,990 1014-char remark
-
2025-11-07price $229,990 1014-char remark
-
2025-11-06price $229,990
-
2025-10-29price $234,990 1014-char remark
-
2025-10-17$234,990 Active
-
2025-10-16$239,990 Active 1014-char remark
ⓘ Source: listings_history table (triggers on properties + properties_extension) + one-shot
backfill from property_details.listing_events for pre-trigger history.
Nearby sold comps map
Loading sold comps map…
Walkable amenities ~0.75 mi
Loading nearby amenities…
Taxation est. · year 1
- Rental income
- $24,026
- − Mortgage interest
- −$12,840
- − Property taxes
- −$3,438
- − Insurance
- −$1,146
- − Repairs & maintenance
- −$1,922
- − Management
- −$1,922
- − HOA
- −$504
- − Depreciation
- −$6,669
- Taxable loss
- −$4,416
- Est. tax savings @ 24.0%
- +$1,060
- After-tax cash flow
- $526/yr
For passive investors: Depreciation is non-cash, so a rental often shows a tax loss while cash-flowing — sheltering income. Rental losses are passive: they offset passive income freely, and up to $25,000/yr can offset ordinary (W-2) income if you actively participate and your MAGI is under $100k (phasing out to $0 by $150k); unused losses carry forward. On sale, claimed depreciation is recaptured at up to 25%, and gains may owe capital-gains tax (a 1031 exchange can defer both). Figures are a year-1 estimate at your 24.0% rate — not tax advice; consult a CPA.
Condition & rehab AI · 2 photos
This home is in excellent condition with no visible signs of wear or damage. It is move-in ready and offers a spacious floor plan with 4 bedrooms and 2.5 bathrooms.
Schools (NCES district)
- District
- Princeton ISD
- NCES district ID
- 4835850
- Math proficiency
- 51% ▼ -8.00%
- Reading proficiency
- 47% ▬ 0.00%
- Median HH income
- $54,827
- Composite
- 42.44/100
- National rank
- #3226
- State rank
- #188 of 826 in TX
Livability — Wylie
- Score
- 69/100
- State rank
- #419
- US rank
- #8623
Category grades
Schools grade is shown separately in the Schools card above.
Census & demographics
- County
- Collin County · 1,159,394 people
- City population
- 34,171
- Metro
- Dallas-Fort Worth-Arlington, TX
- Population (ZIP)
- 34,171
- Household income
- $100,037
- Rent vs Own
- Severe rent burden
- 368.0
Population outlook (Collin County) Hauer SSP2
- Today (2025)
- 1,210,074 people
- By 2030
- 1,358,201 · +12.2%
- By 2040
- 1,654,061 · +36.7%
- By 2050
- 1,937,359 · +60.1%
- By 2075
- 2,567,039 · +112.1%
- By 2100
- 2,952,048 · +144.0%
Race, ethnicity, and origin ACS 2023
- Neighborhood character
- Diverse neighborhood (Simpson 0.66)
- Race & ethnicity
- White 47% Hispanic / Latino 30% Black 17% Two or more races 10% Asian 4% Native American 1%
- Hispanic origin (detail)
- Mexican 26%
- Common ancestry
- Lithuanian 2% Romanian 1% Russian 1%
- Foreign-born
- 15% · Canada, China, Mexico
- Languages at home
- 70% English-only · Spanish 22% Other Indo-European 2% Other Asian/Pacific 1%
Political lean MEDSL · Collin
- 2024 margin
- R (+11.1) · D 43.1% · R 54.3% · Other 2.6%
- 2008→2024 swing
- +14.4pp toward D · 2008: -25.6pp · 2024: -11.1pp
- All cycles
- 2024: R+11.1 2020: R+4.3 2016: R+17.0 2012: R+31.6 2008: R+25.6
Not yet ingested
- Civics
- —
Market trends
- HPI YoY
- ▼ -103.99%
- Current HPI
- 238.9373
- Rent YoY
- ▼ -1.02%
- Metro
- Dallas-Fort Worth-Arlington, TX
- State GDP YoY
- ▲ 3.95%
- F500 in state
- 110
Industry mix (Fortune 500 HQ in TX)
| Industry | F500 HQs | Revenue |
|---|---|---|
| Energy | 16 | $1,198B |
|
||
| Technology | 5 | $198B |
|
||
| Engineering / Construction | 4 | $72B |
|
||
| Energy Services | 3 | $60B |
|
||
| Utilities | 3 | $41B |
|
||
| Healthcare | 2 | $330B |
|
||
Price history
-2.5% since first listed14 events — show timeline
- 2026-05-26 Pending — NTREIS
- 2026-05-24 Price Changed $229,230 NTREIS
- 2026-05-22 Price Changed $221,990 NTREIS
- 2026-05-22 Price Changed $216,990 NTREIS
- 2026-05-14 Price Changed $234,230 NTREIS
- 2026-05-07 Price Changed $226,990 NTREIS
- 2026-05-06 Price Changed $234,230 NTREIS
- 2026-05-06 Price Changed $226,990 NTREIS
- 2026-04-27 Price Changed $236,990 NTREIS
- 2026-04-24 Listed $239,230 NTREIS
- 2026-01-22 Listing Removed — NTREIS
- 2025-11-20 Price Changed $234,990 NTREIS
- 2025-11-06 Price Changed $229,990 NTREIS
- 2025-10-17 Listed $234,990 NTREIS
Cash-flow waterfall
monthlySold comps — $/sqft
last 12 mo · ≤1 miLoading sold comps…