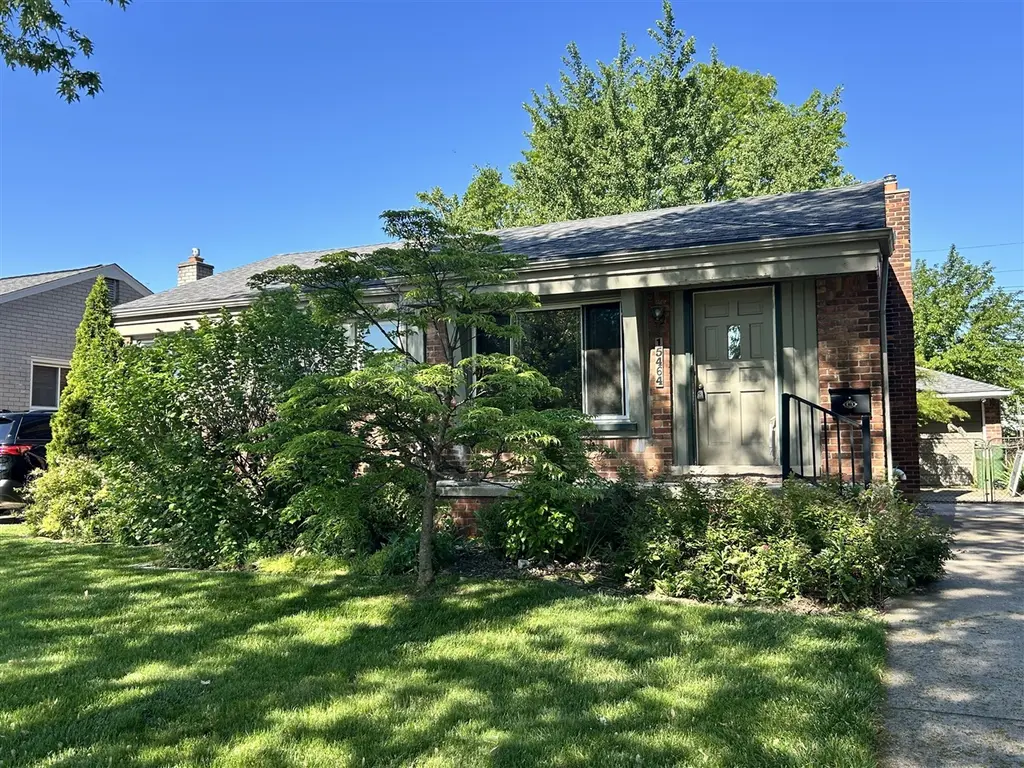
15464 Cameron St · Southgate, MI
Flood risk 1/10 · Minimal
- FEMA flood zone
- X (unshaded)
- Chance of flooding over 30 yrs
- 0.0%
- Est. flood insurance / yr
- $473 – $860
Fire risk 1/10 · Minimal
- Est. fire insurance / yr
- $784 – $1,456
Heat risk 3/10 · Minor
- Hot days now (above 96°F)
- 7 days/yr
- Hot days in 30 yrs
- 15 days/yr
Wind risk 2/10 · Minimal
- Chance of severe wind over 30 yrs
- —
Air-quality risk 3/10 · Minor
- Unhealthy air days now
- 3 days/yr
- Unhealthy air days in 30 yrs
- 5 days/yr
Risk factors via First Street. Map © Google.
Why this score? — see what drove the B- grade
The composite is a weighted blend of 9 inputs, each scored 0–100. Each bar is that input's sub-score; the figure is the points it added to the 100-point composite (weight × sub-score).
- Cash flow +25.9/30.0
- ARV discount +15.0/15.0
- DSCR +8.7/10.0
- 1% rule +6.9/10.0
- Livability +4.2/5.0
- Rent growth +3.5/5.0
- Schools +2.5/10.0
- Condition / age +2.5/5.0
- Appreciation +0.0/10.0
$140,000
🖨 Deal sheet 📄 Offer letter ✓ Due diligence
Listing remarks MLS
Investor Special in Southgate! Opportunity awaits with this 3-bedroom, 1-bath ranch offering 972 sq. ft. of living space in a convenient Southgate location. This home is in need of a full renovation but provides a solid canvas for investors, flippers, or buyers looking to build equity through improvements. Features include hardwood floors throughout much of the home, an eat-in kitchen, and a functional ranch layout. Outside, you'll find a spacious yard highlighted by a charming garden pond, creating a unique outdoor setting with plenty of potential for landscaping enhancements. Whether you're looking for your next project or a property to customize from the ground up, this home offers endless possibilities. Home is being sold as-is. Bring your vision and transform this Southgate ranch into something special!
Key facts
- Spacious yard
- Garden pond
- Eat-in kitchen
Tags
Property features AI
Exterior
- Parking: Detached 1-car garage
- Utilities: Public water; Electricity available; Natural gas available
- Home design: Ranch-style single family home; One story
- Construction: Built in 1953; Brick construction; Asphalt shingle roof
- Exterior features: Paved road access; 0.14-acre lot
Interior
- Kitchen: Range; Refrigerator; Dishwasher
- Bedrooms: Primary bedroom (12 x 11); Bedroom 2 (10 x 10); Bedroom 3 (10 x 10)
- Bathrooms: One full bathroom (10 x 6)
- Heating & cooling: Forced air heating; Cooling available
- Interior features: Fireplace; Three total rooms; Full basement
- Laundry & utility: Washer; Dryer; Natural gas water heater
Neighborhood map
What this means for you Summary
Snapshot
- This is a 3-bed/1.0-bath single-family listed at $140k.
Deal economics
- At list price, monthly cash flow is $344 ($4k/yr) — positive.
- The deal already cash-flows at list — no discount required.
- Meets the 1% rule at list price ($2k rent vs $140k).
- Cap rate 9.2% vs local median 5.2% in Southgate — top-decile yield for the area; either an underpriced asset or a hidden risk that comps aren't pricing in. Stress-test before assuming the spread holds.
Location & tenants
- Location reads 85/100 on livability (#29 in MI, #582 nationally) — a professional / high-income tenant draw. Strengths: amenities A+, commute A+, cost of living A+; Watch: schools D, crime D-.
- Southgate Community School District (suburban): math 21% / reading 36% proficiency, ranked #379 of 540 in MI (top 70%) — low school quality limits family demand, transient renter base, plan for 1-2y turnover.
- Market conditions: Rents rising fast (+4.0%/yr); 115 active listings in the ZIP; 7 comparable units currently listed for rent nearby; rentals leasing fast (median 2d on market — plan ~1-2 weeks tenant-placement turnaround); 2,639 units permitted in Wayne County in 2024 (1,216 in 5+ unit buildings).
- This rent runs 30% of the median local income ($66k/yr) — at the standard rent-burdened threshold; future hikes will face affordability resistance.
Forward outlook
- Local home prices are declining (-3.0%/yr); year-one equity from $968 of loan paydown is wiped out by about $4k of value loss. Plan a longer hold.
- Wayne County population projected at -17% by 2050 — secular population decline; favor cash flow + early exit over multi-decade hold.
- At projected returns (-3.0% appreciation + 4.0% rent growth), your $39k cash investment doubles in ~10 years — after that, you're playing with house money.
Negotiation context
- Only 4 days on market — expect competitive offers; lowballing is unlikely to land.
- 3 sale attempts with the ask held roughly flat each time — persistent listings suggest the price (not the market) is what's stuck; bring a comps-based counter.
- Current owner paid $93k; list at $140k implies a 51% gain — meaningful room to come down on a strong offer.
Risks & watch-outs
- Watch-outs: built in 1953 — expect roof / HVAC / electrical / plumbing capex.
Questions for the listing agent
- Built in 1953 — when were the roof, HVAC, electrical panel, plumbing, and water heater last replaced?
- Is there a deadline driving the sale (1031 exchange, divorce, estate, relocation)? That informs how much negotiation room exists.
- Schools are D-rated, which usually means shorter tenancies and higher turnover. Who's the typical renter profile here, and what's been the actual vacancy rate?
- Crime grade is D in this area — have there been break-ins, vandalism, or insurance claims at this property in the last 3 years? What carrier currently insures it and at what premium?
- What's the average days-on-market for RENTAL listings here right now (not sales)? A rising rental-DOM trend means longer vacancies and softer asking-rent achievability than the comps imply.
- What's the recent tenant-quality profile in this submarket — average credit score on applications, eviction rate, late-payment / NSF rate, and stable-employment percentage? A property-management company in the area should have these aggregated.
- How much new for-sale + rental construction is in the pipeline within 1–3 miles? Heavy new supply typically softens prices + rents 12–24 months out; constrained supply supports both.
Investment metrics
- 1% rule
- 1.19% ✓
- Cap rate
- 9.24%
- Cash-on-cash
- 10.53%
- DSCR
- 1.47
- GRM
- 7.0
CMA / ARV
- ARV (on-the-fly)
- $179,820
- Comps found
- 12
Show comp detail 12 sales within ~0.75 mi
| Address | Dist | Beds/Ba | Sqft | Sold | Price | $/sf | Match |
|---|---|---|---|---|---|---|---|
| 15110 Drake St | 0.22mi | 3/1.5 | 972 (0%) | 2mo | $155,000 | $159 | 86 |
| 14559 Balsam St | 0.41mi | 3/1.0 | 1,026 (+6%) | 2mo | $165,000 | $161 | 70 |
| 15444 Mulberry St | 0.29mi | 3/1.0 | 1,073 (+10%) | 1mo | $180,000 | $168 | 68 |
| 15464 Mulberry St | 0.29mi | 3/1.0 | 1,073 (+10%) | 2mo | $198,000 | $185 | 67 |
| 15646 Cynthia St | 0.47mi | 2/1.0 (-1) | 1,019 (+5%) | 7mo | $210,000 | $206 | 59 |
| 14706 Eureka Rd | 0.42mi | 3/1.0 | 1,088 (+12%) | 2mo | $192,000 | $176 | 59 |
| 16612 Drake St | 0.55mi | 2/1.0 (-1) | 1,000 (+3%) | 7mo | $200,000 | $200 | 59 |
| 15675 Mulberry St | 0.34mi | 2/2.0 (-1) | 1,073 (+10%) | 1mo | $204,000 | $190 | 57 |
| 14801 Pennsylvania Rd | 0.74mi | 2/1.0 (-1) | 967 (-0%) | 3mo | $184,000 | $190 | 57 |
| 14834 Kennebec St | 0.44mi | 3/1.0 | 1,088 (+12%) | 6mo | $160,000 | $147 | 54 |
| 16672 Drake St | 0.59mi | 3/1.0 | 1,073 (+10%) | 1mo | $224,900 | $210 | 54 |
| 15338 Helen St | 0.52mi | 3/1.0 | 1,096 (+13%) | 4mo | $160,000 | $146 | 51 |
Match score weights: distance 35% · size 25% · config 20% · recency 20%. Top-matched comps best support the ARV.
Projected returns pro-forma
-3.0% appreciation · 4.04% rent growth · sell at horizon
- IRR
- 0.7%
- Equity multiple
- 1.03×
- Total profit
- $1,009
- Equity at exit
- $20,874
- IRR
- 11.3%
- Equity multiple
- 1.93×
- Total profit
- $36,574
- Equity at exit
- $12,105
Cash invested: $39,200 (down + closing). Projections, not guarantees.
Landlord ↔ Tenant lean methodology
- Overall (STATE)
- 62 Landlord-Friendly
- State Michigan
- 62 Landlord-Friendly · EVEN
- County
- — inherits STATE
- City
- — inherits STATE
ZIP-level market 48195
- Rents YoY
- 4.0%
- Active inventory
- 115
- Price-to-rent
- 7.0×
Monthly cashflow live
- Estimated rent
- $1,664 high interval (Pro) →
- Mortgage (P&I)
- −$734
- Tax from tax record
- −$178 /mo · $2,141/yr
- Insurance
- −$58
- HOA
- −$0
- Vacancy / Maint / Mgmt
- −$350
- Net cashflow
- $344
Break-even live
UW: 25.0% down · 7.5% · 30yr · 1.5% tax · 5.0% vac · 8.0% maint · 8.0% mgmt
Financing live
Cash to close
- Down payment
- $35,000
- Closing costs
- $4,200
- Reserves months
- —
- Total cash needed
- —
Loan-product check · same deal, 3 products live
Conventional
25% down · 7.5% · 30yr
- Down + closing
- —
- Monthly P&I
- —
- Monthly cashflow
- —
- DSCR
- —
- Eligible?
- —
Personal DTI + credit; lowest rate.
DSCR
20% down · 8.5% · 30yr
- Down + closing
- —
- Monthly P&I
- —
- Monthly cashflow
- —
- DSCR
- —
- Eligible?
- —
No personal income docs; deal must DSCR.
Hard money
10% down · 12.0% · 12mo
- Down + closing
- —
- Monthly P&I
- —
- Monthly cashflow
- —
- DSCR
- —
- Eligible?
- —
Short-term bridge; refi at stabilization.
Rent comps 7 comps
| Address | Beds | Baths | Sqft | Rent | $/sqft | DOM | Units | Dist |
|---|---|---|---|---|---|---|---|---|
| 13861 Strathcona St Southgate, MI | 1.0–2.0 | 1.0–1.5 | 797 | $1,140 | $1.43 | 1d | 5 | 0.82mi |
| 13750 Village Green Blvd Southgate, MI | 1.0–2.0 | 1.0 | 862 | $1,625 | $1.88 | 1d | 9 | 0.87mi |
| 15027 Brookview Dr Riverview, MI | 1.0–2.0 | 1.0 | 1020 | $1,499 | $1.47 | 1d | 34 | 0.87mi |
| 13185 Sycamore St Southgate, MI | 3.0 | 1.0 | 1080 | $1,700 | $1.57 | 24d | 1 | 1.24mi |
| 13210 Village Park Dr Southgate, MI | 2.0 | 1.0 | 630 | $1,125 | $1.78 | 1d | 9 | 1.25mi |
| 17400 Fort St Riverview, MI | 1.0–2.0 | 1.0 | 800 | $1,225 | $1.53 | 1d | 10 | 1.30mi |
| 16167 Weddel St Taylor, MI | 2.0–3.0 | 1.0 | 1064 | $1,600 | $1.50 | 1d | 1 | 1.34mi |
Listing history 5 events
-
2026-06-07statusdays on market $140,000 Pending 4 DOM
-
2026-06-04days on market $140,000 Active 3 DOM
-
2026-06-03days on market $140,000 Active 2 DOM
-
2026-06-02remarks 699-char remark
-
2026-06-02$140,000 Active 1 DOM
ⓘ Source: listings_history table (triggers on properties + properties_extension) + one-shot
backfill from property_details.listing_events for pre-trigger history.
Tax reassessment forecast MI · Partial reset (capped growth)
- Current annual tax
- $2,141 · $178/mo
- Projected year-2 tax
- $2,148 · $179/mo
- Expected delta
- +$8/yr (+$1/mo · 0.4%)
ⓘ Screening estimate from a state-policy table — verify with the county assessor before closing.
Climate risk First Street
- Flood 1/10 Low FEMA zone X (unshaded) · 0% chance over 30 yrs
- Wildfire 1/10 Low
- Heat 3/10 Moderate 7 d/yr ≥96°F today · 15 d/yr by 30 yrs out
- Wind 2/10 Low
- Air quality 3/10 Moderate 3 unhealthy d/yr today · 5 by 30 yrs out
Nearby sold comps map
Loading sold comps map…
Walkable amenities ~0.75 mi
Loading nearby amenities…
Taxation est. · year 1
- Rental income
- $19,973
- − Mortgage interest
- −$7,842
- − Property taxes
- −$2,141
- − Insurance
- −$700
- − Repairs & maintenance
- −$1,598
- − Management
- −$1,598
- − Depreciation
- −$4,073
- Taxable income
- $2,022
- Est. tax owed @ 24.0%
- −$485
- After-tax cash flow
- $3,643/yr
For passive investors: Depreciation is non-cash, so a rental often shows a tax loss while cash-flowing — sheltering income. Rental losses are passive: they offset passive income freely, and up to $25,000/yr can offset ordinary (W-2) income if you actively participate and your MAGI is under $100k (phasing out to $0 by $150k); unused losses carry forward. On sale, claimed depreciation is recaptured at up to 25%, and gains may owe capital-gains tax (a 1031 exchange can defer both). Figures are a year-1 estimate at your 24.0% rate — not tax advice; consult a CPA.
Schools (NCES district)
- District
- Southgate Community School District
- NCES district ID
- 2632340
- Math proficiency
- 21% ▼ -8.00%
- Reading proficiency
- 36% ▬ 0.00%
- Median HH income
- $49,234
- Composite
- 24.83/100
- National rank
- #7591
- State rank
- #379 of 540 in MI
Livability — Southgate
- Score
- 85/100
- State rank
- #29
- US rank
- #582
Category grades
Schools grade is shown separately in the Schools card above.
Census & demographics
- Census place
- Southgate, MI
- County
- Wayne County · 1,562,939 people
- City population
- 29,366
- Metro
- Detroit-Warren-Dearborn, MI
- Population (ZIP)
- 29,366
- Household income
- $66,118
- Rent vs Own
- Severe rent burden
- 727.0
Population outlook (Wayne County) Hauer SSP2
- Today (2025)
- 1,675,273 people
- By 2030
- 1,620,300 · -3.3%
- By 2040
- 1,502,341 · -10.3%
- By 2050
- 1,384,039 · -17.4%
- By 2075
- 1,124,592 · -32.9%
- By 2100
- 881,193 · -47.4%
Race, ethnicity, and origin ACS 2023
- Neighborhood character
- Predominantly White (75%)
- Race & ethnicity
- White 75% Hispanic / Latino 11% Black 8% Two or more races 8% Asian 3%
- Hispanic origin (detail)
- Mexican 8% Puerto Rican 1%
- Common ancestry
- Romanian 9% Lithuanian 3% Slovak 3%
- Foreign-born
- 6% · Canada, China
- Languages at home
- 90% English-only · Other Indo-European 4% Spanish 3% Other Asian/Pacific 1%
Political lean MEDSL · Wayne
- 2024 margin
- Strong D (+29.0) · D 62.7% · R 33.7% · Other 3.6%
- 2008→2024 swing
- -20.5pp toward R · 2008: 49.5pp · 2024: 29.0pp
- All cycles
- 2024: D+29.0 2020: D+38.1 2016: D+37.3 2012: D+46.9 2008: D+49.5
Not yet ingested
- Civics
- —
Market trends
- HPI YoY
- ▼ -187.28%
- Current HPI
- 207.9776
- Rent YoY
- ▲ 4.04%
- Metro
- Detroit-Warren-Dearborn, MI
- State GDP YoY
- ▲ 1.37%
- F500 in state
- 28
Industry mix (Fortune 500 HQ in MI)
| Industry | F500 HQs | Revenue |
|---|---|---|
| Automotive Parts | 3 | $48B |
|
||
| Automotive | 2 | $372B |
|
||
| Chemicals | 1 | $45B |
|
||
| Automotive Retail | 1 | $29B |
|
||
| Healthcare / Medical Devices | 1 | $23B |
|
||
| Automotive Technology | 1 | $20B |
|
||
Price history
+50.5% since first listed4 events — show timeline
- 2026-06-01 Listed $140,000 MiRealSource-MiMLS
- 2026-06-01 Listed $140,000 REALCOMP
- 2026-06-01 Listed $140,000 SW Michigan MLS
- 1998-03-31 Sold (Public Records) $93,000 Public Records
Property tax history
+1.2%/yrLatest (2025): $2,141 · -18.1% YoY. Source: county tax records.
Cash-flow waterfall
monthlySold comps — $/sqft
last 12 mo · ≤1 miLoading sold comps…