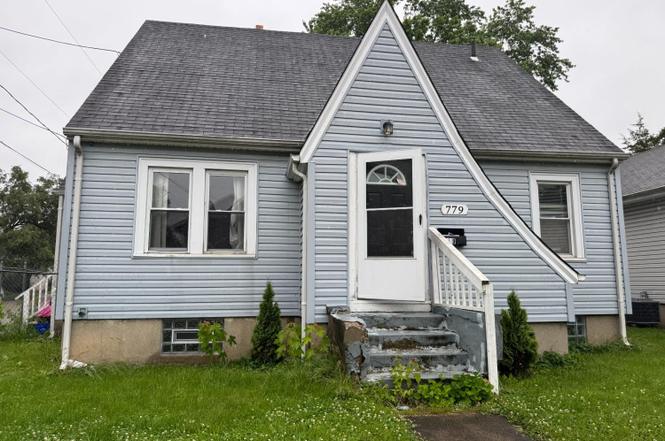
779 Symmes Ave · Hamilton, OH
Flood risk 3/10 · Minor
- FEMA flood zone
- X (unshaded)
- Chance of flooding over 30 yrs
- 0.2%
- Est. flood insurance / yr
- $473 – $860
Fire risk 1/10 · Minimal
- Est. fire insurance / yr
- $713 – $1,323
Heat risk 5/10 · Moderate
- Hot days now (above 104°F)
- 7 days/yr
- Hot days in 30 yrs
- 19 days/yr
Wind risk 2/10 · Minimal
- Chance of severe wind over 30 yrs
- 1.0%
Air-quality risk 3/10 · Minor
- Unhealthy air days now
- 2 days/yr
- Unhealthy air days in 30 yrs
- 3 days/yr
Risk factors via First Street. Map © Google.
Why this score? — see what drove the D grade
The composite is a weighted blend of 9 inputs, each scored 0–100. Each bar is that input's sub-score; the figure is the points it added to the 100-point composite (weight × sub-score).
- Cash flow +16.7/30.0
- ARV discount +6.2/15.0
- DSCR +5.2/10.0
- 1% rule +3.7/10.0
- Livability +3.7/5.0
- Schools +3.6/10.0
- Rent growth +2.5/5.0
- Condition / age +2.5/5.0
- Appreciation +0.0/10.0
$179,900
🖨 Deal sheet 📄 Offer letter ✓ Due diligence
Listing remarks MLS
New Water Heater 97-newly Remodeled Kitchen With Pantry, Built In Microwave And Dishwasher-updated Plumbing-new Roof Over 3 Car Garage
Key facts
- Ample outdoor space
- Full basement
- Generous backyard
Tags
Property features AI
Finance
- Other: Zoned residential; Located on city street with paved road access; Directions: Take OH-4 to Symmes Ave; property on west side of Symmes Ave near local schools and shopping.
- HOA & community: No HOA; Lifestyle community: Other
Exterior
- Parking: Attached garage with 3 spaces
- Utilities: Public water; Public sewer; Natural gas
- Home design: Cape Cod style; Single-family home; Two levels; Entry level primary bedroom
- Construction: Shingle and wood siding; Slate roof; Poured foundation
- Exterior features: Corner lot; Patio; Porch; Wood and insulated windows
Interior
- Kitchen: Pantry; Eat-in kitchen; Walkout from kitchen; Wood cabinets; Oven/Range; Refrigerator
- Bedrooms: Three bedrooms total; Primary bedroom on level 1, approx. 12 x 14; Second bedroom on level 1, approx. 10 x 12; Third bedroom on level 2, approx. 12 x 14
- Flooring: Wall-to-wall carpet
- Bathrooms: Two full bathrooms; One full bath on level 1; One full bath on level 2
- Heating & cooling: Forced air heating (gas); Central air conditioning; Gas water heating
- Interior features: Wall-to-wall carpet in living area; Full unfinished basement; Ceiling fan; 220 Volt
Neighborhood map
What this means for you Summary
Snapshot
- This is a 3-bed/2.0-bath single-family listed at $180k.
Deal economics
- At list price, monthly cash flow is $112 ($1k/yr) — positive.
- The deal already cash-flows at list — no discount required.
- To meet the 1% rule (rent ≥ 1% of price), the offer needs to be $157k (12.7% below list).
- Recommended offer: $157k (12.7% below list) — sets the bar for 1% rule.
- Cap rate 7.0% vs local median 4.6% in Hamilton — top-decile yield for the area; either an underpriced asset or a hidden risk that comps aren't pricing in. Stress-test before assuming the spread holds.
Location & tenants
- Location reads 73/100 on livability (#332 in OH) — a middle-class / working-renter tenant base. Strengths: cost of living A+, housing A+, schools B; Watch: crime C-, amenities C-, employment D.
- Hamilton City (suburban): math 42% / reading 45% proficiency, ranked #517 of 656 in OH (top 79%) — families likely to look elsewhere, expect single-tenant / working-renter base with shorter leases; 63% free/reduced lunch — lower-income household profile, screen leases tightly.
- Market conditions: 11 active listings in the ZIP; 7 comparable units currently listed for rent nearby; rentals at typical pace (median 24d on market — plan ~3-4 weeks tenant-placement turnaround); 43% of comp listings sitting > 30 days — soft ceiling on asking rent; 1,163 units permitted in Butler County in 2024 (356 in 5+ unit buildings).
- This rent runs 39% of the median local income ($48k/yr) — at the standard rent-burdened threshold; future hikes will face affordability resistance.
Forward outlook
- Local home prices are declining (-3.0%/yr); year-one equity from $1k of loan paydown is wiped out by about $5k of value loss. Plan a longer hold.
Negotiation context
- Only 1 days on market — expect competitive offers; lowballing is unlikely to land.
- 3 sale attempts since 29y ago with the ask held roughly flat each time — persistent listings suggest the price (not the market) is what's stuck; bring a comps-based counter.
- Current owner paid $104k; list at $180k implies a 73% gain — meaningful room to come down on a strong offer.
Risks & watch-outs
- Watch-outs: built in 1949 — expect roof / HVAC / electrical / plumbing capex.
- Climate carrying-cost: extreme-heat days projected 7→19/yr by 2055 (HVAC capex compounding) — expect insurance premiums to compound above CPI over the hold.
Questions for the listing agent
- Built in 1949 — when were the roof, HVAC, electrical panel, plumbing, and water heater last replaced?
- Is there a deadline driving the sale (1031 exchange, divorce, estate, relocation)? That informs how much negotiation room exists.
- Schools are B-rated — typically a magnet for longer-tenancy family renters. What's the average tenant stay here, and is there a school-zone premium baked into asking?
- The area grade is low — what's the realistic commute time and amenity access for the typical tenant pool here? Any planned neighborhood developments (good or bad) we should know about?
- What's the average days-on-market for RENTAL listings here right now (not sales)? A rising rental-DOM trend means longer vacancies and softer asking-rent achievability than the comps imply.
- What's the recent tenant-quality profile in this submarket — average credit score on applications, eviction rate, late-payment / NSF rate, and stable-employment percentage? A property-management company in the area should have these aggregated.
- How much new for-sale + rental construction is in the pipeline within 1–3 miles? Heavy new supply typically softens prices + rents 12–24 months out; constrained supply supports both.
Investment metrics
- 1% rule
- 0.87% ✗
- Cap rate
- 7.04%
- Cash-on-cash
- 2.67%
- DSCR
- 1.12
- GRM
- 9.5
CMA / ARV
- ARV (on-the-fly)
- $175,009
- Comps found
- 12
Show comp detail 12 sales within ~0.75 mi
| Address | Dist | Beds/Ba | Sqft | Sold | Price | $/sf | Match |
|---|---|---|---|---|---|---|---|
| 1018 Minor Ave | 0.36mi | 3/2.0 | 1,104 (-5%) | 2mo | $214,900 | $195 | 74 |
| 890 Weller Ave | 0.23mi | 2/2.0 (-1) | 1,240 (+7%) | 0mo | $220,000 | $177 | 72 |
| 348 Fairview Ave | 0.32mi | 3/1.0 | 1,263 (+9%) | 2mo | $125,000 | $99 | 65 |
| 2031 Benninghofen Ave | 0.29mi | 2/1.0 (-1) | 1,080 (-7%) | 2mo | $140,000 | $130 | 64 |
| 1024 Corwin Ave | 0.60mi | 2/2.0 (-1) | 1,132 (-2%) | 0mo | $210,000 | $186 | 63 |
| 639 Minor Ave | 0.33mi | 2/1.0 (-1) | 1,240 (+7%) | 2mo | $172,000 | $139 | 62 |
| 340 Belle Ave | 0.38mi | 2/1.5 (-1) | 1,246 (+8%) | 3mo | $132,500 | $106 | 60 |
| 928 Hooven Ave | 0.37mi | 2/1.5 (-1) | 1,056 (-9%) | 3mo | $175,000 | $166 | 59 |
| 321 Laurel Ave | 0.36mi | 3/1.0 | 1,304 (+12%) | 1mo | $195,000 | $150 | 57 |
| 1518 Pleasant Ave | 0.62mi | 3/1.5 | 1,280 (+10%) | 3mo | $88,000 | $69 | 50 |
| 3300 Pleasant Ave | 0.61mi | 3/2.0 | 1,302 (+12%) | 3mo | $275,000 | $211 | 49 |
| 332 Chase Ave | 0.62mi | 2/1.0 (-1) | 1,304 (+12%) | 2mo | $197,500 | $151 | 39 |
Match score weights: distance 35% · size 25% · config 20% · recency 20%. Top-matched comps best support the ARV.
Projected returns pro-forma
-3.0% appreciation · 3.0% rent growth · sell at horizon
- IRR
- -12.1%
- Equity multiple
- 0.56×
- Total profit
- $-22,065
- Equity at exit
- $26,824
- IRR
- -3.0%
- Equity multiple
- 0.80×
- Total profit
- $-10,218
- Equity at exit
- $15,554
Cash invested: $50,372 (down + closing). Projections, not guarantees.
Landlord ↔ Tenant lean methodology
- Overall (STATE)
- 73 Landlord-Friendly
- State Ohio
- 73 Landlord-Friendly · R+6
- County
- — inherits STATE
- City
- — inherits STATE
ZIP-level market 45015
- Home prices YoY
- -24.1%
- Active inventory
- 11
- Price-to-rent
- 9.5×
Monthly cashflow live
- Estimated rent
- $1,571 high interval (Pro) →
- Mortgage (P&I)
- −$943
- Tax from tax record
- −$111 /mo · $1,332/yr
- Insurance
- −$75
- HOA
- −$0
- Vacancy / Maint / Mgmt
- −$330
- Net cashflow
- $112
Break-even live
UW: 25.0% down · 7.5% · 30yr · 1.5% tax · 5.0% vac · 8.0% maint · 8.0% mgmt
Financing live
Cash to close
- Down payment
- $44,975
- Closing costs
- $5,397
- Reserves months
- —
- Total cash needed
- —
Loan-product check · same deal, 3 products live
Conventional
25% down · 7.5% · 30yr
- Down + closing
- —
- Monthly P&I
- —
- Monthly cashflow
- —
- DSCR
- —
- Eligible?
- —
Personal DTI + credit; lowest rate.
DSCR
20% down · 8.5% · 30yr
- Down + closing
- —
- Monthly P&I
- —
- Monthly cashflow
- —
- DSCR
- —
- Eligible?
- —
No personal income docs; deal must DSCR.
Hard money
10% down · 12.0% · 12mo
- Down + closing
- —
- Monthly P&I
- —
- Monthly cashflow
- —
- DSCR
- —
- Eligible?
- —
Short-term bridge; refi at stabilization.
Rent comps 7 comps
| Address | Beds | Baths | Sqft | Rent | $/sqft | DOM | Units | Dist |
|---|---|---|---|---|---|---|---|---|
| 1008 Fairview Ave Hamilton, OH | 3.0 | 1.0 | 1080 | $1,600 | $1.48 | 2d | 1 | 0.21mi |
| 1005 Minor Ave Hamilton, OH | 2.0 | 1.0 | 886 | $1,495 | $1.69 | 20d | 1 | 0.37mi |
| 1118 Bonacker Ave Unit 1116 Hamilton, OH | 2.0 | 1.0 | 1000 | $1,195 | $1.20 | 44d | 1 | 0.65mi |
| 1794 See Ave Hamilton, OH | 3.0 | 1.0 | 1272 | $1,800 | $1.42 | 10d | 1 | 0.80mi |
| 1310 Shuler Ave Unit 2 Hamilton, OH | 2.0 | 1.0 | 976 | $895 | $0.92 | 24d | 1 | 0.91mi |
| 969 Harmon Ave Hamilton, OH | 3.0 | 1.0 | 1350 | $1,695 | $1.26 | 44d | 1 | 1.20mi |
| 967 Shuler Ave Hamilton, OH | 3.0 | 2.0 | 1466 | $1,795 | $1.22 | 44d | 1 | 1.21mi |
Listing history 2 events
-
2026-06-19remarks 459-char remark
-
2026-06-19$179,900 Active 1 DOM
ⓘ Source: listings_history table (triggers on properties + properties_extension) + one-shot
backfill from property_details.listing_events for pre-trigger history.
Tax reassessment forecast OH · Partial reset (capped growth)
- Current annual tax
- $1,332 · $111/mo
- Projected year-2 tax
- $2,069 · $172/mo
- Expected delta
- +$737/yr (+$61/mo · 55.4%)
ⓘ Screening estimate from a state-policy table — verify with the county assessor before closing.
Climate risk First Street
- Flood 3/10 Moderate FEMA zone X (unshaded) · 20% chance over 30 yrs
- Wildfire 1/10 Low
- Heat 5/10 Major 7 d/yr ≥104°F today · 19 d/yr by 30 yrs out
- Wind 2/10 Low 100% chance of damaging wind over 30 yrs
- Air quality 3/10 Moderate 2 unhealthy d/yr today · 3 by 30 yrs out
Nearby sold comps map
Loading sold comps map…
Walkable amenities ~0.75 mi
Loading nearby amenities…
Taxation est. · year 1
- Rental income
- $18,856
- − Mortgage interest
- −$10,077
- − Property taxes
- −$1,332
- − Insurance
- −$900
- − Repairs & maintenance
- −$1,508
- − Management
- −$1,508
- − Depreciation
- −$5,233
- Taxable loss
- −$1,703
- Est. tax savings @ 24.0%
- +$409
- After-tax cash flow
- $1,753/yr
For passive investors: Depreciation is non-cash, so a rental often shows a tax loss while cash-flowing — sheltering income. Rental losses are passive: they offset passive income freely, and up to $25,000/yr can offset ordinary (W-2) income if you actively participate and your MAGI is under $100k (phasing out to $0 by $150k); unused losses carry forward. On sale, claimed depreciation is recaptured at up to 25%, and gains may owe capital-gains tax (a 1031 exchange can defer both). Figures are a year-1 estimate at your 24.0% rate — not tax advice; consult a CPA.
Schools (NCES district)
- District
- Hamilton City
- NCES district ID
- 3904410
- Math proficiency
- 42% ▼ -13.00%
- Reading proficiency
- 45% ▼ -10.00%
- Median HH income
- $40,488
- Composite
- 36.48/100
- National rank
- #4656
- State rank
- #517 of 656 in OH
Livability — Hamilton
- Score
- 73/100
- State rank
- #332
- US rank
- #5467
Category grades
Schools grade is shown separately in the Schools card above.
Census & demographics
- Census place
- Hamilton, OH
- County
- Butler County · 381,674 people
- City population
- 140,900
- Metro
- Cincinnati, OH-KY-IN
- Population (ZIP)
- 11,038
- Household income
- $48,312
- Rent vs Own
- Severe rent burden
- 407.0
Population outlook (Butler County) Hauer SSP2
- Today (2025)
- 387,706 people
- By 2030
- 392,028 · +1.1%
- By 2040
- 395,307 · +2.0%
- By 2050
- 391,116 · +0.9%
- By 2075
- 378,642 · -2.3%
- By 2100
- 343,248 · -11.5%
Race, ethnicity, and origin ACS 2023
- Neighborhood character
- Predominantly White (78%)
- Race & ethnicity
- White 78% Two or more races 10% Hispanic / Latino 9% Black 4% Native American 1%
- Hispanic origin (detail)
- Mexican 4% Cuban 1% Dominican 1%
- Common ancestry
- Lithuanian 2% Italian 2% Greek 1%
- Foreign-born
- 11% · Canada
- Languages at home
- 88% English-only · Spanish 6% Arabic 3% French/Haitian/Cajun 1%
Political lean MEDSL · Butler
- 2024 margin
- Strong R (+26.3) · D 36.4% · R 62.7%
- 2008→2024 swing
- -3.6pp toward R · 2008: -22.6pp · 2024: -26.3pp
- All cycles
- 2024: R+26.3 2020: R+24.0 2016: R+28.3 2012: R+26.2 2008: R+22.6
Not yet ingested
- Civics
- —
Market trends
- HPI YoY
- ▼ -80.41%
- Current HPI
- 253.3351
- Rent YoY
- —
- Metro
- Cincinnati, OH-KY-IN
- State GDP YoY
- ▲ 1.98%
- F500 in state
- 48
Industry mix (Fortune 500 HQ in OH)
| Industry | F500 HQs | Revenue |
|---|---|---|
| Insurance | 3 | $145B |
|
||
| Industrial Machinery | 3 | $49B |
|
||
| Financial Services | 3 | $24B |
|
||
| Consumer Goods | 2 | $93B |
|
||
| Aerospace / Defense | 2 | $47B |
|
||
| Utilities | 2 | $33B |
|
||
Price history
+463.9% since first listed9 events — show timeline
- 2026-06-18 Listed $179,900 Cincy MLS
- 2022-11-21 Sold (Public Records) $104,100 Public Records
- 2022-10-04 Sold (Public Records) $90,000 Public Records
- 2014-03-29 Listing Removed — Cincy MLS
- 2013-11-13 Listed $59,900 Cincy MLS
- 1997-12-22 Sold (MLS) $69,000 Cincy MLS
- 1997-11-06 Sold (Public Records) $69,000 Public Records
- 1997-08-24 Listed $71,900 Cincy MLS
- 1985-01-15 Sold (Public Records) $31,900 Public Records
Property tax history
+3.5%/yrLatest (2025): $1,332 · +0.5% YoY. Source: county tax records.
Cash-flow waterfall
monthlySold comps — $/sqft
last 12 mo · ≤1 miLoading sold comps…